copy the linklink copied!Chapter 2. Students’ socio-economic status and performance
This chapter shows how strongly socio-economic status is associated with performance in the countries and economies that participated in PISA 2018. It first examines the large heterogeneity in socio-economic status observed both between and within countries. It also discusses how student performance varies, even amongst students of similar socio-economic status, depending on the country/economy in which the students are enrolled in school. The chapter also illustrates how some school systems achieve excellence and weaken the association between students’ socio-economic status and performance in PISA.
Many modern societies suffer from rising inequality and low social mobility (OECD, 2018[1]). Income inequality in OECD countries today is at its highest level since the 1980s (OECD, 2015[2]), and the economic recovery observed since 2010 has not reversed this trend. Rising inequality and low social mobility not only threaten long-term growth (Cingano, 2014[3]) but more fundamentally endanger democratic societies. Young people may lack confidence in political institutions if they feel that they have to limit their expectations for their future because of their family’s or their own financial situation.
Long-standing research finds that the most reliable predictor of a child’s future success at school – and, in many cases, of access to well-paid and high-status occupations – is his or her family. Children from low-income and low-educated families usually face many barriers to learning. Less household wealth often translates into fewer educational resources, such as books, games and interactive learning materials in the home. From the beginning, parents of higher socio-economic status are more likely to provide their children with the financial support and home resources for individual learning. As they are likely to have higher levels of education, they are also more likely to provide a more stimulating home environment to promote cognitive development (Sirin, 2005[4]; Thomson, 2018[5]). These parents may be more at ease teaching their child the specific behaviours and cultural references that are the most valued at school. Advantaged parents may also provide greater psychological support for their child in environments that encourage the development of the skills necessary for success at school (Evans et al., 2010[6]).
However, results from previous rounds of PISA suggest that school systems may be able to help mitigate the impact of families’ socio-economic status on their child’s life outcomes. Schools can serve to channel resources towards disadvantaged children and thus help create a more equitable distribution of learning opportunities and outcomes (Downey and Condron, 2016[7]).
Socio-economically advantaged students usually perform better in PISA than disadvantaged students, but the gap in reading performance related to socio-economic status varies considerably across countries. In PISA 2018, advantaged students outperformed disadvantaged students in reading by 89 score points. Nine years earlier, in PISA 2009, this gap related to socio-economic status, was 87 score points.
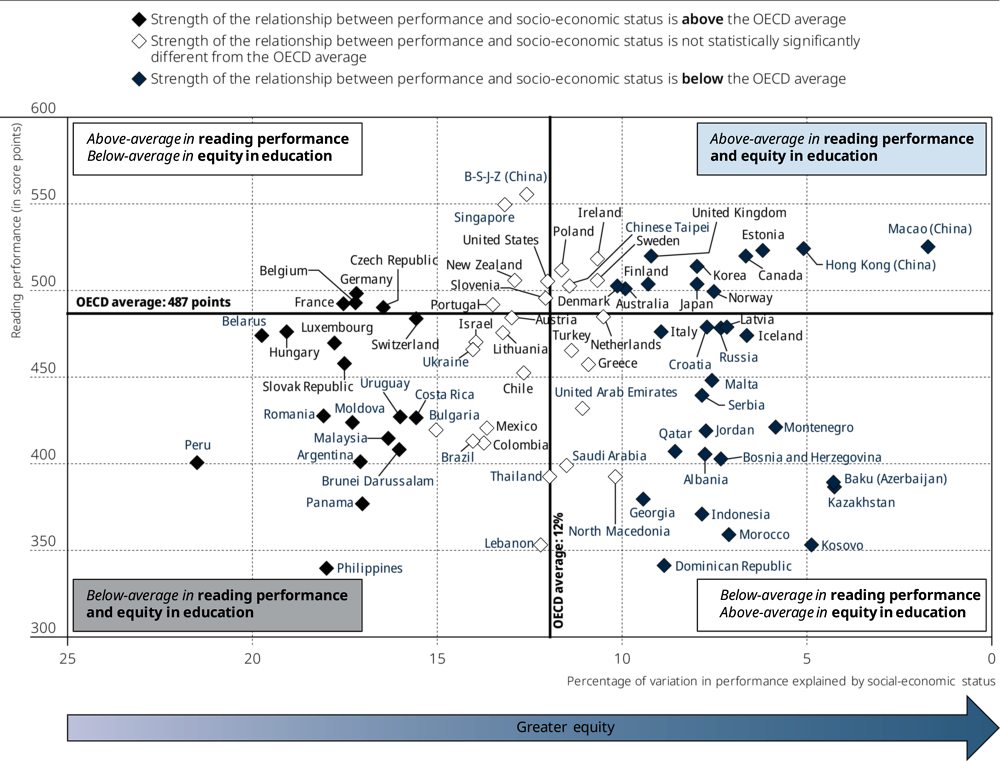
On average across OECD countries, 12% of reading performance was accounted for by the PISA index of economic, social and cultural status.
In 11 countries and economies, including the OECD countries Australia, Canada, Denmark, Estonia, Finland, Japan, Korea, Norway and the United Kingdom, average performance was higher than the OECD average while the relationship between socio-economic status and reading performance was weaker than the OECD average.
On average across OECD countries, 17.4% of advantaged students, but only 2.9% of disadvantaged students were top performers in reading, meaning that they attained Level 5 or 6 in the PISA reading test. Amongst the 23 countries and economies where the proportions of top performers were larger than the OECD average, the socio-economic disparities in top performance were smallest in Macao (China) and largest in France.
copy the linklink copied!Variation in students’ socio-economic status and in their performance
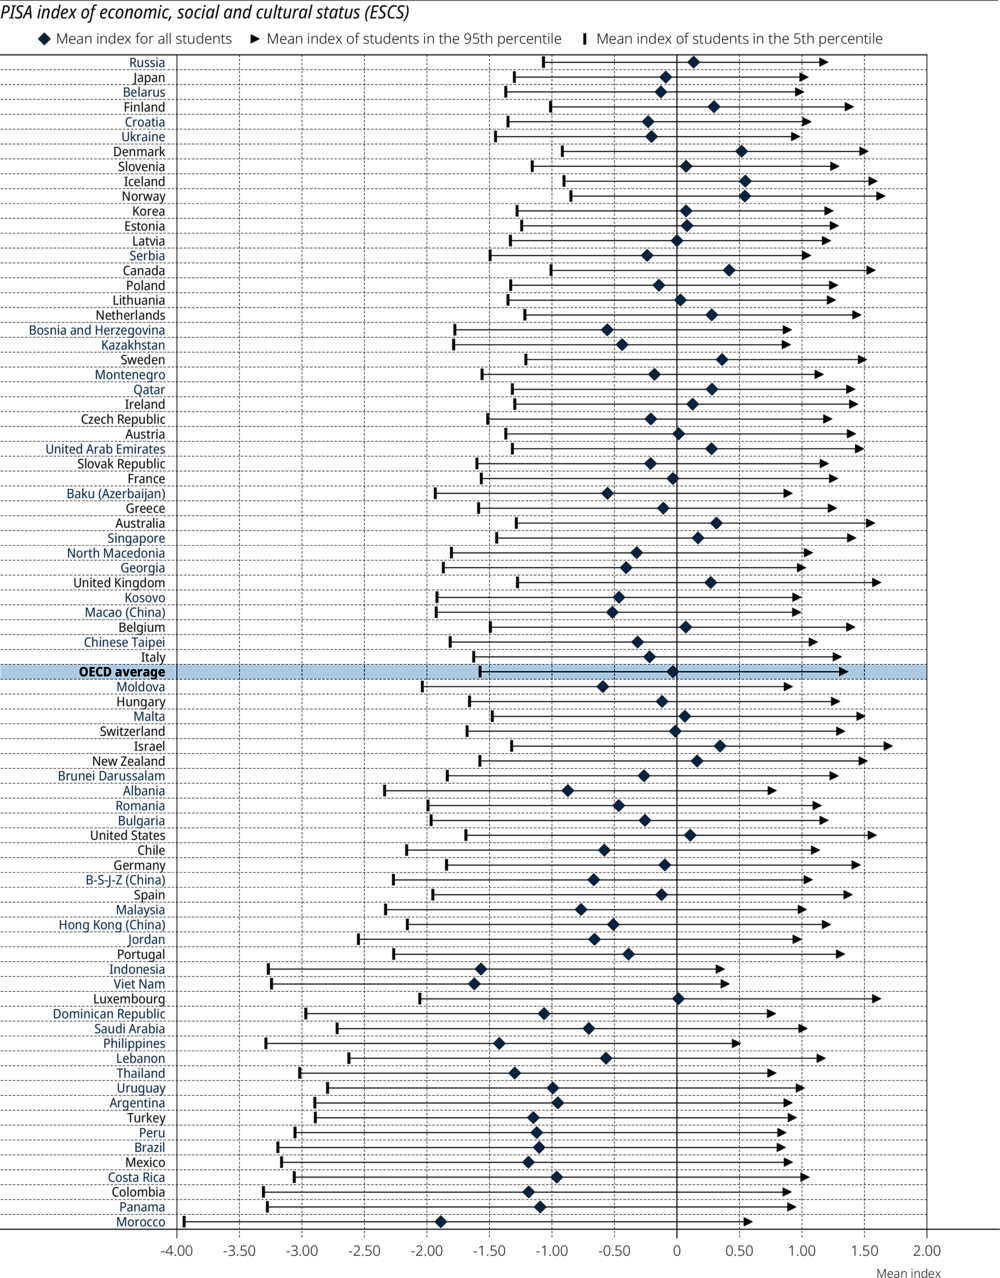
In PISA, a student’s socio-economic status is estimated by the PISA index of economic, social and cultural status, a composite measure that combines into a single score the financial, social, cultural and human capital resources available to students (see Box II.2.1). The socio-economic status of students varies between countries/economies (Figure II.2.1); but in the vast majority of cases, differences in socio-economic status, which may be seen as a proxy of the socio-economic inequalities in the countries,1 are larger within than between countries/economies. In only 7 countries, namely Belarus, Denmark, Finland, Japan, the Russian Federation (hereafter “Russia”), Slovenia and Ukraine, the within-country gap between the most- and least-advantaged students (i.e. the difference between the 95th and 5th percentiles of the distribution of socio-economic status) is narrower than the gap between the highest and lowest mean socio-economic status measured at the country/economy level. Particularly wide within-country gaps in socio-economic status were observed in Morocco, Panama, Colombia, Mexico, Costa Rica, Brazil and Viet Nam (in descending order). In contrast, in Russia, Japan, Belarus, Finland and Croatia (in ascending order), these gaps were relatively narrow.
Variations in socio-economic status within and between countries/economies should be taken into account when comparing students’ performance. This can be achieved by measuring students on the same scale, which allows for a comparison of the performance of groups of students of similar socio-economic status across countries and economies.
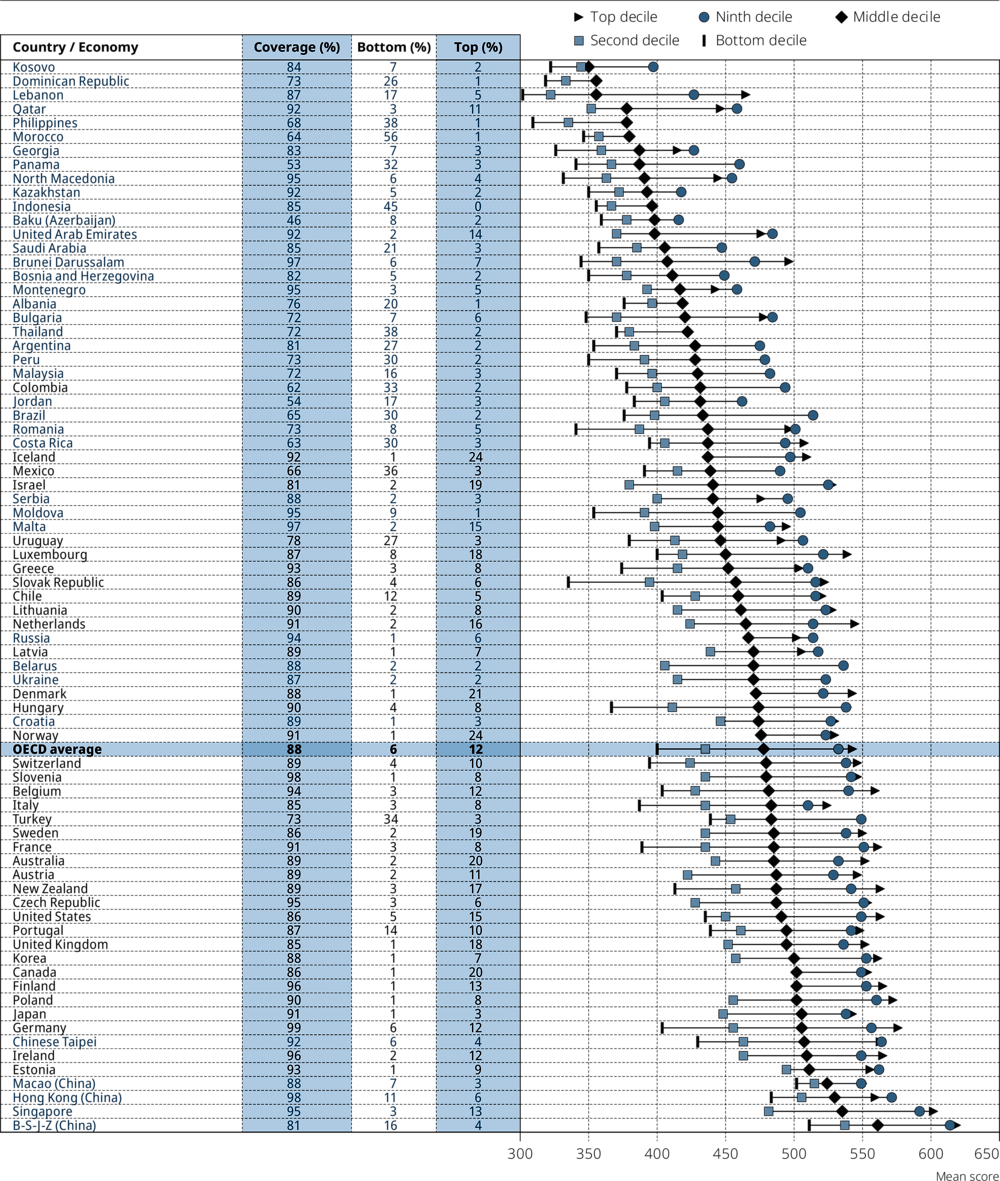
Figure II.2.2 shows performance differences by international deciles of the PISA index of economic, social and cultural status. Countries and economies differ substantially in their national wealth and socio-economic heterogeneity; thus the proportion of 15-year-old students at each decile on the international scale varies considerably (see Table II.B1.2.2 available on line). For example, in Denmark, Iceland and Norway, more than 20% of 15-year-old students were in the top decile of the international distribution of socio-economic status, while in 16 countries (Albania, Argentina, Brazil, Colombia, Costa Rica, the Dominican Republic, Indonesia, Mexico, Morocco, Panama, Peru, the Philippines, Thailand, Turkey, Saudi Arabia and Uruguay) more than 20% of students were in the bottom decile of this distribution. In all of these countries where there were large proportions of disadvantaged students, except Argentina, Indonesia and Saudi Arabia, less than 80% of 15-year-olds were eligible to sit the PISA test (see Box II.2.2 on the coverage of the PISA sample).
Socio-economic status is a broad concept that aims to reflect the financial, social, cultural and human-capital resources available to students (Cowan et al., 2012[8]). Socio-economic status may also be referred to as “the relative position for the family or individual on a hierarchical social structure, based on their access to, or control over, wealth, prestige and power” (see Willms and Tramonte, 2015[9] quoting (Mueller and Parcel, 1981[10]). Socio-economic status is thus a measure of students’ access to family resources (financial capital, social capital, cultural capital and human capital) and the social position of the student’s family/household.
In PISA, a student’s socio-economic status is estimated by the PISA index of economic, social and cultural status (ESCS), a composite measure that combines into a single score the financial, social, cultural and human-capital resources available to students (see PISA 2018 Technical Report (OECD, forthcoming[11])). In practice, it is derived from several variables related to students’ family background that are then grouped into three components: parents’ education, parents’ occupations, and an index summarising a number of home possessions that can be taken as proxies for material wealth or cultural capital, such as possession of a car, the existence of a quiet room to work, access to the Internet, the number of books and other educational resources available in the home.
The comparability of these indicators across countries and over time raises several challenges (Rutkowski and Rutkowski, 2013[12]; Rutkowski and Rutkowski, 2017[13]; Pokropek, Borgonovi and McCormick, 2017[14]). The more serious concerns are related to the items proxied by home possessions, as the meaning and the national examples included in the items may vary significantly across countries, undermining cross-country comparability. In addition, the prevalence of access to technological goods and services, such mobile phones, has increased over time, thus these items convey distinct information at different times. For example, use of a mobile phone shortly after the technology was introduced could be a proxy for high social status; later on, mobile phones may be regarded as a basic resource, accessible to nearly everyone. For this reason, the index summarising home possessions is computed in a different way for all new cycles, and some items may be included in a way specific to each country, in order to take into account distinctive use by countries.
In PISA 2018, the three components (parents’ education, parents’ occupation and the index of home possessions) are weighted equally. As in 2015, all countries and economies contributed equally to the estimation of ESCS values. Analyses were systematically conducted in order to identify those items that may have been interpreted differently across countries. For these items, country-specific parameters were assigned (OECD, 2017[15]). For the purpose of reporting, the ESCS scale was transformed with 0 as the value of an average OECD student and 1 the standard deviation across equally weighted OECD countries.
Figure II.2.2 illustrates how the performance of students of similar socio-economic status varied, depending on the country/economy in which they live. The figure also shows, for individual countries/economies, the proportions of students in the top and bottom international deciles of socio-economic status and the PISA coverage indices, which should be taken into account when interpreting the figure.
For instance, while Thailand and Turkey show similar proportions of students in the bottom decile of socio-economic status (38% in Thailand and 34% in Turkey) and the two countries have similar shares of 15-year-olds who were enrolled in school in 2018 (around three in four), the average reading score of the students in the bottom international decile was higher in Turkey (440 points) than in Thailand (370 points).
In Denmark, Iceland and Norway, three high-income countries where more than 20% of students are in the top international decile of socio-economic status and more than 87% of 15-year-olds were eligible to sit the PISA test, the average score amongst students in the top international decile of socio-economic status was 510 points in Iceland, 531 points in Norway and 542 points in Denmark. Amongst those students whose socio-economic status was close to the median decile of the international distribution, average reading scores were 438 points in Iceland, 476 points in Norway and 473 points in Denmark.
Ensuring that all children, whatever their personal circumstances, have access to education is the main requirement for achieving equity in education. Chapter 3 of PISA 2018 Results (Volume I): What Students Know and Can Do (OECD, 2019[16]) analyses in detail how enrolment in secondary education has evolved over the different cycles of PISA, notably through the proportion of the population of 15-year-olds who were not enrolled in grade 7 or higher (the “target population” of the sample in PISA).
As discussed in that chapter, the proportion of 15-year-olds in each country/economy who were covered by the PISA 2018 sample, known as Coverage Index 3, exceeded 80% in most OECD countries. However, Colombia (62%), Mexico (66%) and Turkey (73%) did not reach this threshold. In addition, while the coverage index was over 99% in Germany, over 98% in Hong Kong (China), and over 97% in Brunei Darussalam, Malta and Slovenia, in 18 countries it was below 75%. In Brazil, Jordan and Panama, Coverage Index 3 was below 65% and in Albania and Baku (Azerbaijan) it was below 50% (see Table II.B1.2.1).
For these countries, results showing the link between socio-economic status and performance need to be interpreted with caution. For instance, if only teenagers from low-income families drop out of school early because of poor school performance, only those disadvantaged students with the highest performance would be sampled for the PISA assessment. In this hypothetical case, the relationship between socio-economic status and performance as estimated in PISA may be weaker than would be observed if measured across the entire population of 15-year-olds.
Chapter 10 of Volume I (OECD, 2019[16]) also discusses how the proportion of students who scored at or above the minimum level of proficiency on the PISA scales – Level 2 – has evolved over time. This level of proficiency may be equated with the “minimum proficiency level” defined in the first target of the United Nations Sustainable Development Goal 4, which was adopted by the 70th General Assembly of the United Nations in 2015. On average across OECD countries in 2018, 22.6% of 15-year-olds scored below Level 2 in reading. However, this proportion was strongly associated with students’ socio-economic status. Some 35.6% of students in the bottom quarter of the PISA index of economic, social and cultural status (see Box II.2.3 for details) scored at that level, while only 10.7% of students in the top quarter of the index did (Table II.B1.2.6 available on line). Disadvantaged students were 2.7 times more likely than advantaged students not to attain the minimum level of proficiency in reading. While there were significant variations in the magnitude of this difference, the association between socio-economic disadvantage and low performance was statistically significant in all PISA-participating countries and economies, except Macao (China). In 25 of the 79 PISA-participating countries and economies, disadvantaged students were at least three times as likely as advantaged students to be low achievers in reading (Table II.B1.2.6 available on line).
copy the linklink copied!Socio-economic disparities in PISA performance
The strength and slope of the socio-economic gradient
The sections above show that in all countries and economies, student performance in PISA is related to socio-economic status; but they also emphasise that this relationship is far from deterministic. While countries and economies differ widely in terms of economic development and socio-economic structure, an analysis of the socio-economic disparities in academic performance at the national level provides an indication of whether a school system helps promote social mobility. While socio-economic status in PISA can be seen as a proxy of the “rank” of students’ access to family resources within their country/economy, a strong relationship between socio-economic status and performance in PISA may indicate low social mobility within the country/economy.
In PISA, the socio-economic gradient is traditionally used to examine the relationship between students’ socio-economic status and their performance (OECD, 2016[17]). More specifically, the slope of the gradient summarises the differences in performance observed across socio-economic groups, while the strength of the gradient refers to how well socio-economic status predicts performance. For a detailed discussion, see (OECD, 2016[17]; OECD, 2018[18]; OECD, 2013[19]).
The slope of the socio-economic gradient indicates the degree of the disparity in average performance between two students whose socio-economic status differs by one unit in the PISA index of economic, social and cultural status. A positive value for the slope of the socio-economic gradient signals that advantaged students generally performed better than disadvantaged students in PISA 2018. On average across OECD countries in 2018, a one-unit increase in the PISA index of economic, social and cultural status was associated with an increase of 37 score points in the reading assessment. The performance gap related to students’ socio-economic status was widest in Belarus, where a one-unit increase in the index was associated with a difference of as much as 51 score points in reading. In Belgium, the Czech Republic, France, Hungary, Israel, the Slovak Republic and Ukraine, the increase in the index was associated with a difference of between 45 and 50 score points. By contrast, in 15 countries and economies, the associated change in performance amounted to less than 25 score points (Table II.B1.2.3 available on line).
However, the slope of the socio-economic gradient does not describe the magnitude of the gap in performance related to socio-economic status that may be observed between the most and the least advantaged students within a country/economy. On average across OECD countries, the difference in the average index of socio-economic status between disadvantaged students (defined as those in the bottom quarter of the distribution in the PISA index of economic, social and cultural status within their countries/economies; see Box II.2.3) and advantaged students (those in the top quarter of the distribution) corresponded to 2.36 standard deviations in the index. But in 9 countries, namely Belarus, Croatia, Denmark, Finland, Iceland Japan, Korea, Russia and Ukraine, this difference is less than 2 standard deviations in the index, while in 11 countries/economies, namely Argentina, Brazil, Colombia, Costa Rica, Mexico, Morocco, Panama, Peru, Portugal, Saudi Arabia and Turkey, it is greater than 3 standard deviations in the index ( Table II.B1.2.1).
The PISA index of economic, social and cultural status (ESCS) makes it possible to draw comparisons between students and schools with different socio-economic profiles. In this report, students are considered socio-economically advantaged if they are amongst the 25% of students with the highest values in the ESCS index in their country or economy; students are classified as socio-economically disadvantaged if their values in the index are amongst the bottom 25% within their country or economy. Students whose values in the ESCS index are in the middle 50% within their country or economy are classified as having average socio-economic status. Following the same logic, schools are classified as socio-economically advantaged, disadvantaged or average within each country or economy, based on their students’ mean values in the ESCS index.
One may compare how these categories are characterised in relation to the variables that are used to estimate the three components of the ESCS index: parents’ educational attainment, the status of their occupation and home possessions.
On average across OECD countries, parents of socio-economically advantaged students are highly educated: a large majority attained tertiary education (98%) and works in a skilled, white-collar occupation (72%).1 By contrast, the parents of socio-economically disadvantaged students have much lower educational attainment. Across OECD countries, 53% of parents of disadvantaged students attained some post-secondary non-tertiary education as their highest level of formal schooling, 33% attained lower secondary education or less, and only 14% attained tertiary education. Few disadvantaged students have a parent working in a skilled occupation (5%). Many parents of these students work in semi-skilled, white-collar occupations (11%); the majority (84%) work in elementary occupations or semi-skilled, blue-collar occupations.
One of the home possessions that most clearly distinguishes students of different socio-economic status is the number of books at home. While 46% of advantaged students reported having more than 200 books at home, on average, this is the case for only 6% of their disadvantaged peers. Advantaged students also reported a greater availability of other educational resources, such as educational software. In addition, more than 90% of advantaged students but only 69% of disadvantaged students, on average across OECD countries, reported having a quiet place to study at home and a computer that they can use for schoolwork.
← 1. Defined by the first three major groups of the ISCO 08 (managers, professionals, technicians and associated professionals). Semi-skilled, white-collar occupations are defined by the major groups 4 and 5 (clerical support workers, and service and sales workers) and elementary occupations or semi-skilled, blue-collar occupations by the major groups 6 to 9 (skilled agricultural, forestry and fishery workers, craft and related trades workers, plant and machine operators, and assemblers, elementary occupations).
In order to have an idea of the magnitude of the performance gap related to socio-economic status within countries/economies, after taking into account variations in socio-economic status, one may compare the average performance of the least-advantaged students with that of the most-advantaged students. On average across OECD countries in 2018, advantaged students scored 89 points higher in reading than disadvantaged students. The gap between the two groups of students was larger than 100 score points in 19 countries, including the OECD countries Belgium, the Czech Republic, France, Germany, Hungary, Israel, Luxembourg, the Slovak Republic and Switzerland (Table II.B1.2.3 available on line).
Some countries were able to combine higher average performance in reading with smaller socio-economic gaps in performance. In 13 countries and economies, including the OECD countries Canada, Denmark, Estonia, Finland, Ireland, Japan, Korea, Norway, Slovenia and the United Kingdom, average performance was higher than the OECD average while the performance difference between advantaged and disadvantaged was smaller than the OECD average (Table II.B1.2.3 available on line).
The strength of the gradient is measured by the proportion of the variation in performance that is accounted for by differences in socio-economic status. When the relationship between socio-economic status and performance is strong, socio-economic status is a good predictor of performance. On average across OECD countries in 2018, students’ socio-economic status accounted for a significant share of the variation in their performance in the core PISA subjects (reading, mathematics and science). In reading, 12% of the variation in student performance within each country was associated with socio-economic status. In 20 of the 79 countries and economies that participated in PISA 2018 students’ socio-economic status predicted 15% or more of the variation in performance. By contrast, in 31 countries the strength of the gradient predicted less than 10% of this variation (Table II.B1.2.3 available on line).
Socio-economic status is even more related to mathematics and science performance. On average across OECD countries, students’ socio-economic status predicted 13.8% of their performance in mathematics, and 12.8% of their performance in science. In Argentina, Belarus, Belgium, France, Hungary, Peru and the Slovak Republic, more than 20% of mathematics performance was related to students’ socio-economic status (Table II.B1.2.4 available on line).
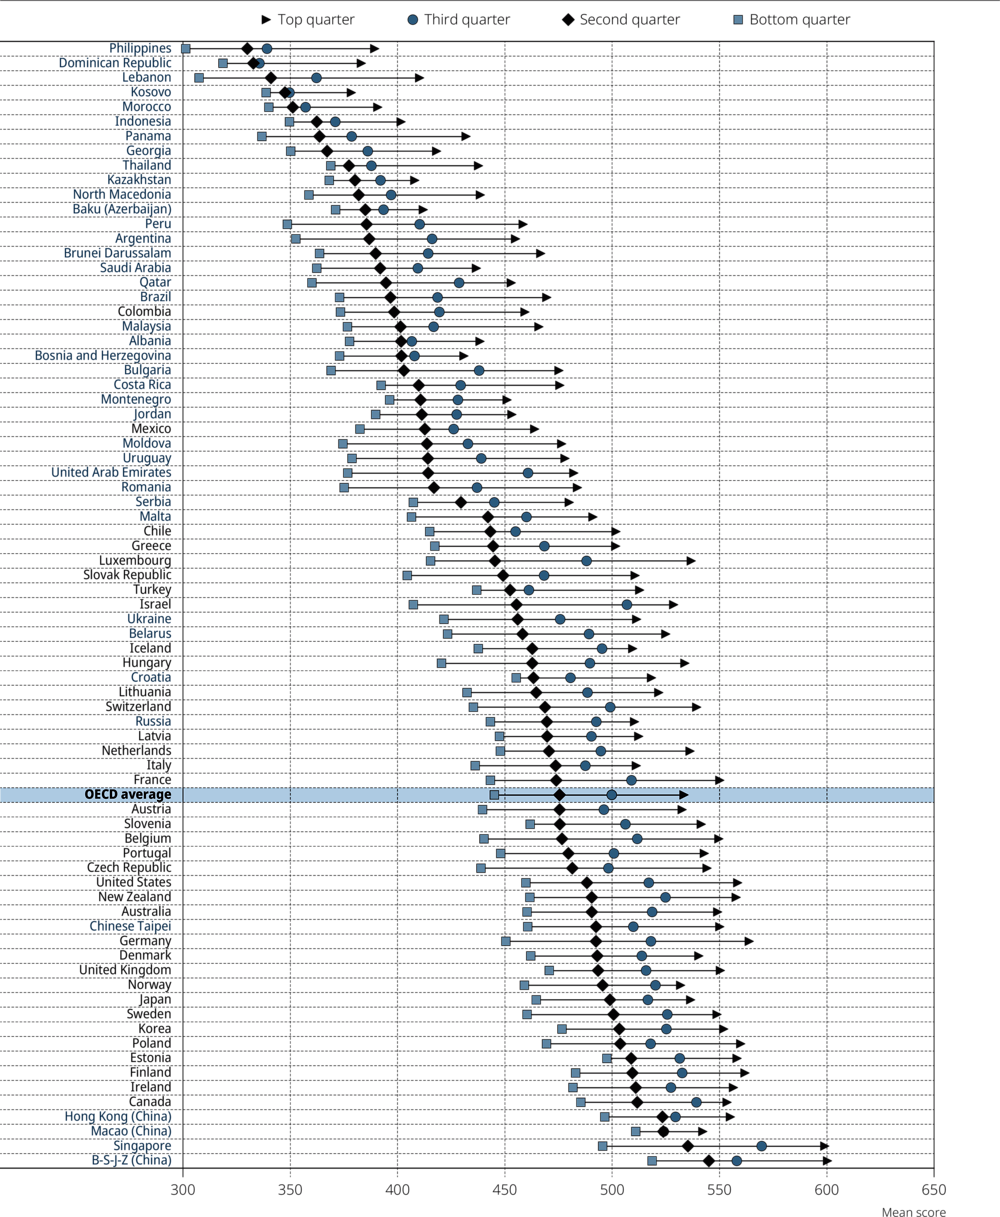
A weak gradient means that the relationship between socio-economic status and performance is not accurately described by a linear relationship; it may be multidimensional and cannot be fully captured by socio-economic indicators. This may also happen when the relative disadvantage of being at the bottom of the national distribution of socio-economic status is greater than the relative advantage of being at the top of this distribution – or the opposite. Both patterns are illustrated in Figure II.2.3, which shows the average performance of students by their socio-economic status.
In all countries, average performance improved with each successive quarter of socio-economic status. However, in some countries, differences in performance were more marked at the bottom of the distribution of socio-economic status, as disadvantaged students scored much lower in reading than students in the three higher quarters of socio-economic status – amongst whom differences in performance were comparatively small. This was the case in Bosnia and Herzegovina, the Czech Republic, Hong Kong (China), Italy, Japan, Macao (China), Malta, Norway, the Slovak Republic and Sweden, where the gap in average reading performance between students in bottom quarter of socio-economic status and those in the next-highest quarter accounted for 40% to 50% of the performance difference between the most-advantaged and least-advantaged students in these countries.2 By contrast, in some countries, such as Croatia, the Dominican Republic, Kosovo, Morocco, Thailand and Turkey, socio-economic disparities in performance were observed at the top of the distribution of the socio-economic index, as most of the link between socio-economic status and performance was related to the fact that advantaged students outperformed students in the three lower quarters of socio-economic status by a wide margin. Identifying these complex patterns may be useful for designing policies that aim to tackle both underperformance and inequity in education (Table II.B1.2.3 available on line).
Changes in socio-economic inequities in performance
One may compare differences in performance related to socio-economic status in PISA 2018 with those that were observed in 2009. Comparing the most disadvantaged students with the most advantaged in their country/economy, as defined in 2009 and 2018, no significant changes were observed in the vast majority of countries (see Table II.2.1).3 In only six countries and economies, namely Bulgaria, Georgia, Kazakhstan, Malta and Montenegro, the socio-economic gap shrank. Only in Georgia and Montenegro was this due to a significant improvement in the performance of disadvantaged students, while the performance of advantaged students remained unchanged. However, in Kazakhstan, the narrowing of the performance gap was due to both a significant decline in the performance of advantaged students and significant improvements in the performance of disadvantaged students; in Bulgaria only the performance of advantaged students declined. In the Czech Republic, Finland, Malaysia, the Republic of Moldova (hereafter “Moldova”), Qatar and the Slovak Republic, disparities in performance related to socio-economic status increased over the period. In Moldova and Qatar, the performance of advantaged students improved at a faster rate than that of disadvantaged students; in Finland and the Slovak Republic, the performance of disadvantaged students declined while the performance of advantaged students did not change significantly over the period.
Top performers and socio-economic status
Differences in achievement related to socio-economic status are even more pronounced when one compares not only average performance, but the attainment of the highest levels of proficiency (as described in PISA 2018 Results [Volume I]: What Students Know and Can Do (OECD, 2019[16])). On average across OECD countries, 8.6% of students were top performers in reading in PISA 2018, meaning that they attained Level 5 or 6 in the PISA reading test. At these levels, students can comprehend lengthy texts, deal with concepts that are abstract or counterintuitive, and establish distinctions between fact and opinion, based on implicit cues pertaining to the content or source of the information.
Only 2.9% of disadvantaged students, compared with 17.4% of advantaged students, attained these levels of performance, on average across OECD countries. In 51 countries and economies, less than 2% of disadvantaged students were top performers; in only 10 countries and economies, namely Australia, Beijing, Shanghai, Jiangsu and Zhejiang (China) (hereafter “B-S-J-Z [China]), Canada, Estonia, Finland, Hong Kong (China), Ireland, Korea, Macao (China) and Singapore, were more than 5% of disadvantaged students top performers. In all countries, the proportion of top performers amongst advantaged students largely exceeded that amongst disadvantaged students (Table II.B1.2.6 available on line).
The countries with the largest proportions of top performers were also those that achieved high levels of performance amongst all of their students. However, within countries, there were large differences, related to socio-economic status, in the probability of achieving the highest levels of performance. For instance, while around 10% of disadvantaged students in B-S-J-Z (China) and Singapore were top performers in reading (the largest proportions observed amongst all participating countries and economies), four times as many advantaged students attained that level of performance. This suggests that even in high-performing school systems social inequities may be perpetuated.
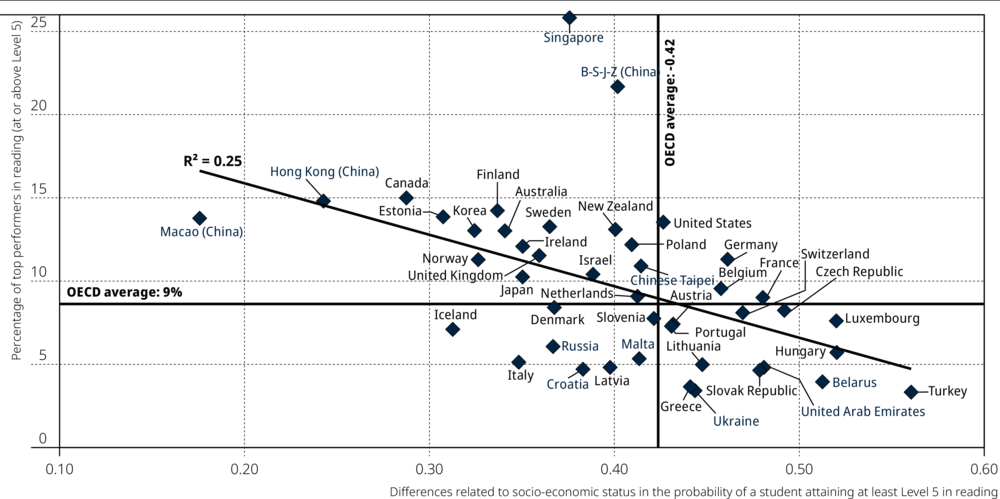
The index of inequality in the probability of attaining the highest levels of reading performance provides an indication of the link between top performance and socio-economic status. This indicator measures how top performers are concentrated along the national distribution of socio-economic status, by “ranking” all students by their level of socio-economic status (Erreygers, Clarke and Van Ourti, 2012[20]; Wagstaff, 2011[21]; Kjellsson and Gerdtham, 2013[22]). It considers only the relationship between the probability of being a top performer and where the student is located in the distribution of socio-economic status within his or her country/economy; it does not consider the variability of socio-economic status or the degree of socio-economic inequality within the country/economy (see Annex A3 for details).4 The index ranges from -1 to 1. The more the index shifts from 0, the more performance is strongly related to socio-economic status. A negative value means that those students at the bottom of the socio-economic distribution are over-represented amongst top performers in reading; a positive value means that students at the top of the socio-economic distribution in their countries/economies are over-represented amongst top performers.
Figure II.2.4 shows this index alongside the proportion of top performers in the country/economy, in school systems where at least 3% of 15-year-old students were top performers in reading. In all countries, the index is positive, meaning that the top performers were more often amongst those at the top of the socio-economic distribution in their country/economy. The extent of socio-economic disparities in the probability of being a top performer was also negatively related to the proportion of top performers in the school system (the R2 is 0.25). On average across OECD countries, the value of the index was 0.42. The highest level of the index, 0.56, was observed in Turkey, where only 3% of students were top performers in reading. However, the socio-economic disparities in top performance were far from perfectly predicted by the proportions of top performers amongst the population of 15-year-old students: amongst the 23 countries and economies where the proportions of top performers were larger than the OECD average, the index of socio-economic disparities ranged from 0.18 in Macao (China) to 0.47 in France.
copy the linklink copied!Performance and fairness in education
No one should be satisfied with a school system where everyone performs equally, but poorly. PISA consistently finds that strong performance and a weak relationship between socio-economic status and education outcomes are not mutually exclusive: some education systems manage to attain both a high level of average performance and equity in education (OECD, 2016[17]).
In 11 of the 25 countries and economies that scored above the OECD average in reading in PISA 2018, the strength of the relationship between student performance and socio-economic status was significantly below the OECD average. School systems in Australia, Canada, Denmark, Estonia, Finland, Hong Kong (China), Japan, Korea, Macao (China), Norway and the United Kingdom achieved high performance in reading while socio-economic status was less predictive of performance than average (Figure II.2.5).
References
[3] Cingano, F. (2014), “Trends in Income Inequality and its Impact on Economic Growth”, OECD Social, Employment and Migration Working Papers, No. 163, OECD Publishing, Paris, https://dx.doi.org/10.1787/5jxrjncwxv6j-en.
[8] Cowan, C. et al. (2012), Improving the Measurement of Socioeconomic Status for the National Assessment of Educational Progress: A Theoretical Foundation.
[7] Downey, D. and D. Condron (2016), “Fifty Years since the Coleman Report”, Sociology of Education, Vol. 89/3, pp. 207-220, https://doi.org/10.1177/0038040716651676.
[20] Erreygers, G., P. Clarke and T. Van Ourti (2012), ““Mirror, mirror, on the wall, who in this land is fairest of all?”—Distributional sensitivity in the measurement of socioeconomic inequality of health”, Journal of Health Economics, Vol. 31/1, pp. 257-270, https://doi.org/10.1016/j.jhealeco.2011.10.009.
[6] Evans, M. et al. (2010), “Family scholarly culture and educational success: Books and schooling in 27 nations”, Research in Social Stratification and Mobility, Vol. 28/2, pp. 171-197, https://doi.org/10.1016/j.rssm.2010.01.002.
[23] Hanushek, E. et al. (2019), The Unwavering SES Achievement Gap: Trends in U.S. Student Performance.
[22] Kjellsson, G. and U. Gerdtham (2013), “On correcting the concentration index for binary variables”, Journal of Health Economics, Vol. 32/3, pp. 659-670, https://doi.org/10.1016/j.jhealeco.2012.10.012.
[10] Mueller, C. and T. Parcel (1981), “Measures of Socioeconomic Status: Alternatives and Recommendations”, Child Development, Vol. 52/1, p. 13, https://doi.org/10.2307/1129211.
[16] OECD (2019), PISA 2018 Results (Volume I): What Students Know and Can Do, PISA, OECD Publishing, Paris, https://dx.doi.org/10.1787/5f07c754-en.
[1] OECD (2018), A Broken Social Elevator? How to Promote Social Mobility, OECD Publishing, Paris, https://dx.doi.org/10.1787/9789264301085-en.
[18] OECD (2018), Equity in Education: Breaking Down Barriers to Social Mobility, PISA, OECD Publishing, Paris, https://dx.doi.org/10.1787/9789264073234-en.
[15] OECD (2017), PISA 2015 Technical Report.
[17] OECD (2016), PISA 2015 Results (Volume I): Excellence and Equity in Education, PISA, OECD Publishing, Paris, https://dx.doi.org/10.1787/9789264266490-en.
[2] OECD (2015), In It Together: Why Less Inequality Benefits All, OECD Publishing, Paris, https://dx.doi.org/10.1787/9789264235120-en.
[19] OECD (2013), PISA 2012 Results: Excellence through Equity (Volume II): Giving Every Student the Chance to Succeed, PISA, OECD Publishing, Paris, https://dx.doi.org/10.1787/9789264201132-en.
[11] OECD (forthcoming), PISA 2018 Technical Report, OECD publishing, Paris.
[14] Pokropek, A., F. Borgonovi and C. McCormick (2017), “On the Cross-Country Comparability of Indicators of Socioeconomic Resources in PISA”, Applied Measurement in Education, Vol. 30/4, pp. 243-258, https://doi.org/10.1080/08957347.2017.1353985.
[12] Rutkowski, D. and L. Rutkowski (2013), “Measuring Socioeconomic Background in PISA: One Size Might not Fit all”, Research in Comparative and International Education, Vol. 8/3, pp. 259-278, https://doi.org/10.2304/rcie.2013.8.3.259.
[13] Rutkowski, L. and D. Rutkowski (2017), “Improving the Comparability and Local Usefulness of International Assessments: A Look Back and A Way Forward”, Scandinavian Journal of Educational Research, Vol. 62/3, pp. 354-367, https://doi.org/10.1080/00313831.2016.1261044.
[4] Sirin, S. (2005), “Socioeconomic Status and Academic Achievement: A Meta-Analytic Review of Research”, Review of Educational Research, Vol. 75/3, pp. 417-453, https://doi.org/10.3102/00346543075003417.
[5] Thomson, S. (2018), “Achievement at school and socioeconomic background—an educational perspective”, npj Science of Learning, Vol. 3/1, https://doi.org/10.1038/s41539-018-0022-0.
[21] Wagstaff, A. (2011), “The concentration index of a binary outcome revisited”, Health Economics, Vol. 20/10, pp. 1155-1160, https://doi.org/10.1002/hec.1752.
[9] Willms, J. and L. Tramonte (2015), “Towards the development of contextual questionnaires for the PISA for development study”, OECD Education Working Papers, No. 118, OECD Publishing, Paris, https://dx.doi.org/10.1787/5js1kv8crsjf-en.
Notes
← 1. A correlation of 0.79 is observed with this indicator and an index of inequalities in incomes (World Bank GINI index) measured in 2015 across the 50 PISA-participating countries with available data.
← 2. See Table II.B1.2.3 available on line; for instance, the average score of students in the bottom quarter of the distribution of ESCS in Italy was 474 points, the average score of students in the second quarter was 474 points and the average score of those in the top quarter was 511 points, so: (474-436)/(511-436)=0.51.
← 3. In order to measure changes in fairness in education over time, this report compares how students who are ranked similarly in the distribution of socio-economic status in the same country/economy, but at different time periods, perform in PISA. This approach relies on an indicator that measures the performance difference between the most-advantaged 25% of students and the least-advantaged 25% in the country, as defined at the time of the assessment. This means that a change in this indicator from one to another PISA assessment may be due to a change in the way students’ socio-economic status is related to performance in PISA; and/or a change in the variation of students’ socio-economic status in the country. As emphasised by (Hanushek et al., 2019[23]), an advantage of this approach is that it makes it possible to compare the relative position of students in the distribution of socio-economic status at the time of the assessment. This approach does not assume that an index of home possessions, which is measured by the same set of items, is invariant across time; nor does it assume that individual items have the same meaning when they are used to measure students’ socio-economic status over time. Even within the same country, some items, such as “access to the Internet”, may not mean the same today as they did ten years ago.
← 4. This indicator is similar to the “concentration index” commonly used to measure inequality in health outcomes.


