.jpg?a4384ad645a7284c15259ce80248ac2e)
Indicator D5. Who are the teachers?
In the great majority of countries with available data, women are over-represented among teachers in primary and secondary education, while they are under-represented in tertiary education.
Between 2005 and 2019, on average across OECD countries, there was a gradual increase in the gender gap in favour of women from primary level to upper secondary level, but a decrease in the gap in favour of men at the tertiary level.
There are relatively few young teachers (under the age of 30), and the proportion decreases with the level of education. Young teachers make up 12% of the teaching population in primary education, 11% in lower secondary education and 8% in upper secondary education, on average across OECD countries
Context
The demand for teachers depends on a range of factors, including average class sizes, required instruction time for students, the use of teaching assistants and other non-classroom staff in schools, enrolment rates at different levels of education, and the starting and ending age of compulsory education.
With large proportions of teachers in many OECD countries set to reach retirement age in the next decade and the size of the school-age population projected to increase in some countries, governments will be under pressure to recruit and train new teachers. There is compelling evidence that the calibre of teachers is the most significant in-school determinant of student achievement, so concerted efforts are needed to attract top talent to the teaching profession and provide them with high-quality training (OECD, 2019[1]). Looking at teachers’ attrition rates and the characteristics of the teachers who leave the profession can then shed light on the way to develop effective policies to attract and retain teachers in the teaching profession (Indicator D7).
In terms of gender, teaching at the pre-primary, primary and lower secondary levels remains largely dominated by women so the gender imbalance in the teaching profession, and its possible effect on students’ learning, warrant detailed study (OECD, 2017[2]).
Finally, the COVID-19 pandemic has posed significant challenges for education systems around the world, notably to ensure the safe return to school (for teachers and students) after the reopening of schools, and government initiatives to tackle this issue are worth investigating (OECD, 2021[3]).
Other findings
At all education levels, the share of women is higher among the new generation of teachers (below the age of 30) than among older teachers (50 years and older).
Although women make up the majority of the teaching profession in upper secondary education, the share of female teachers is significantly higher in general programmes than in vocational ones.
The share of older teachers (aged 50 and over) increases with the education level, from 33% in primary education to 36% in lower secondary and 40% in upper secondary education, on average across OECD countries.
Given that older adults face higher risks of developing severe forms of COVID-19, several countries (Austria, Chile, Colombia, the Czech Republic, Germany, Latvia and Slovenia) have prioritised teachers’ vaccination based on their age, as an attempt to ensure the safe reopening of schools, at the pre-primary to upper secondary levels combined (OECD, 2021[3]).
Gender profile of teachers
Share of female teachers, by level of education
On average across OECD countries, 70% of teachers are women in all levels of education combined (Table D5.1). The greatest concentration of female teachers occurs in the earlier years of schooling, and the share shrinks with each successive level of education. While women represent 96% of the teaching staff at pre-primary level and 82% at primary level, they make up 63% at secondary level and only 44% at tertiary level on average across OECD countries (Figure D5.1).
Women account for over 85% of pre-primary teachers in all OECD and partner countries with available data, and over 65% of primary teachers in all countries except Japan (64%), Turkey (64%), India (54%) and Saudi Arabia (52%). In secondary education, although female teachers continue to dominate, the proportion of female teachers is smaller than at lower levels. Women make up 68% of lower secondary teachers on average across OECD countries, with values ranging from 43% in Japan to 84% in Latvia. At upper secondary level the share of female teachers’ drops to 60% on average across OECD countries, with significant variations across countries (from 31% in Japan to 81% in Latvia) (Table D5.1).
At the tertiary level, the gender profile of teachers is reversed, with men making up the majority across OECD countries and female teachers accounting for 44% of the teaching staff on average. In fact, among countries with available data, only in Finland, Latvia, Lithuania, New Zealand and the Russian Federation do women make up more than 50% of teachers in tertiary education (Figure D5.1).
Share of female upper secondary teachers, by programme orientation
The share of women among upper secondary teachers tends to be higher in general than in vocational programmes, although women are over-represented in both types of programmes. In general education, women account for 63% of teachers on average across OECD countries, and there are more female than male teachers in all countries except Switzerland (48%). The share of female teachers is particularly high in countries such as Latvia and Lithuania, where over 80% are women. In contrast, in vocational programmes, women account for a smaller share of teachers: 56% on average across OECD countries. The share of female teachers in vocational education ranges from 45% or less in Denmark and Switzerland to over 70% in Latvia, Lithuania and the Slovak Republic (Table D5.1).
In some countries, the share of female teachers differs significantly between general and vocational programmes. For instance, in Austria, Brazil, Chile, Finland, Hungary, Latvia and Lithuania, the share of female teachers in general programmes is at least 10 percentage points higher than in vocational programmes, even though women still make up at least 50% vocational teachers in all of these countries except Brazil (49%) and Chile (48%). In contrast, the share of female teachers is the same in general and vocational programmes in the Czech Republic (at 60%), Norway (55%) and Slovenia (67%) (Table D5.1).
Several factors may contribute to gender imbalances in the teaching profession across levels of education and programme types. One explanation may be cultural: social perceptions of the links between gender and choice of profession may influence both men and women’s career choices. This gender bias often arises very early, at home, when parents might base their aspirations for their children’s professions on gender stereotypes (OECD, 2015[4]) (Croft et al., 2014[5]) (Kane and Mertz, 2012[6]). Even within the teaching profession, there are gender imbalances in the different fields of study. At the lower secondary level, women make up a smaller share of teachers in science, mathematics and technology than in the overall teaching population (OECD, 2017[2]) (OECD, 2014[7]). This may result from the social perception of science and technology as being a masculine domain, which may discourage women from pursuing tertiary studies in that field (see Indicator B4 and (OECD, 2014[7])).
From an economic point of view, the choice of future jobs is also influenced by young people’s expectations for future earning potential. On average across OECD countries, male teachers earn less than their male tertiary-educated counterparts in other professions, while female teachers in primary and lower secondary education earn virtually the same as women with tertiary degrees in other fields (see Indicator D3 and (OECD, 2017[2])). These differences in relative salaries are likely to make the teaching profession more appealing to women than to men, compared to other professions.
The potential impact of this gender imbalance in the teaching profession on student achievement, student motivation and teacher retention is worthy of study (OECD, 2021[8]) (Drudy, 2008[9]). While there is little evidence that a teacher’s gender has an effect on student performance (Antecol, Eren and Ozbeklik, 2015[10]) (Holmlund and Sund, 2008[11]), aiming for a better balance between genders could nevertheless have positive effects on all students. In particular, male and female teachers can contribute to students developing positive gender identities and challenge stereotyped views (Hutchings et al., 2008[12]). There is also some evidence that female teachers’ attitudes towards some school subjects, such as mathematics, can influence their female students’ achievement (OECD, 2014[13]) (Beilock et al., 2010[14]).
Trends in the gender profile of teachers
Share of female teachers, by age group and level of education
The higher proportion of women among young teachers, together with the predominance of female tertiary graduates in the field of education (see Education at a Glance Database), may raise concerns about future gender imbalances at the primary to upper secondary levels, where women already dominate the profession.
In most countries, the share of women is higher among young teachers (under the age of 30) than among older teachers (aged 50 or older). At primary level, the difference between the two age groups is rather small, with women making up 83% of the younger group, compared to 82% of the older group, on average across OECD countries. At lower secondary level, the difference is also small on average: women make up 68% of teachers under the age of 30, and 67% of those of aged 50 or older. The difference grows larger at upper secondary level: on average across OECD countries, 63% of young teachers are women at this level, compared to 57% in the older group (Table D5.2).
However, at tertiary level, where female teachers are in the minority on average, the higher share of women among the younger generation of teachers suggests there will be an increase in gender parity. On average across OECD countries, the share of women is closer to 50% among younger tertiary teachers, accounting for 51% of teachers under the age of 30, compared to 39% among those aged 50 or older (Table D5.2).
Trends in the share of female teachers between 2005 and 2019
The indicators above are consistent with the gender distribution dynamics observed over the decade, which point to a gradual increase in the gender gap in the teaching profession at the primary and secondary level, but a decrease at the tertiary level.
On average, for all OECD countries with data for both years, the rise in the share of female teachers (from 69% in 2005 to 72% in 2019) has widened the gender gap by 3 percentage points for the primary and secondary levels combined. This increase in the gender gap reaches 7 percentage points in Ireland and Korea, 8 percentage points in Greece and 11 percentage points in Slovenia. The share of female teachers in 2019 remains below the OECD average in Korea (68%) and Greece (67%), while it is above-average in Ireland (79%) and Slovenia (89%) (Table D5.2).
At tertiary level, on average across OECD countries with available trend data, there was a 5 percentage-point decrease in the gender gap, as the share of female teachers increased from 39% in 2005 to 44% in 2019. The largest increases in the share of female teachers (over 10 percentage points) are found in Japan, the Netherlands and the Russian Federation. While women remain under-represented among tertiary teachers in Japan (28%) and the Netherlands (46%), the share of female tertiary teachers reaches 62% in 2019 in the Russian Federation. At the other end of the spectrum, the Czech Republic experienced a 2 percentage-point decrease in the share of female tertiary teachers, from 40% in 2005 to 38% in 2019 (Figure D5.2).
The persistent gender imbalances in the teaching profession, together with imbalances in school leadership, have raised a number of concerns, and countries such as the United Kingdom have implemented policies encouraging the recruitment and retention of a diverse and inclusive teacher workforce, including in terms of gender (OECD, 2014[7]) (OECD, 2017[2]).
Teachers’ age distribution
Teachers’ age distribution varies considerably across countries and levels of education, and can be affected by a variety of factors, such as the size and age distribution of the population, the duration of tertiary education, and teachers’ salaries and working conditions. Declining birth rates, for example, may drive down the demand for new teachers, and more time spent in tertiary education can delay the entrance of teachers into the labour market. Competitive salaries, good working conditions and career development opportunities may have attracted young people to teaching in some countries or helped to retain effective teachers in others.
Young teachers (below the age of 30) only account for a small proportion of the teaching population: 12% in primary education, 11% in lower secondary and 8% in upper secondary, on average across OECD countries. The pattern is particularly striking at the upper secondary level, where young teachers make up less than 10% of the teaching population in most countries. In fact, they account for 5% or less of upper secondary teachers in the Czech Republic, Finland, Germany, Greece, Hungary, Italy, Lithuania, Poland, Portugal, Slovenia, Spain and Switzerland (Table D5.3).
On average across OECD countries, more than half of primary, lower secondary and upper secondary teachers are aged between 30 and 49, and a high share of teachers are at least 50 years old. The share of older teachers (aged 50 and over) increases with the education level, from 33% in primary education to 38% in secondary education and 40% in tertiary education. In most countries, at least one teacher in every three at tertiary level is aged 50 or over. There is, however, a high level of variation across countries, with the share at tertiary level ranging from 13% in Luxembourg to 56% in Italy (Figure D5.3).
The ageing of the teaching force has a number of implications for countries’ education systems. In addition to prompting recruitment and training efforts to replace retiring teachers, it may also affect budgetary decisions. In most school systems, teachers’ salaries increase with years of teaching experience. Thus, the ageing of teachers increases school costs, which can in turn limit the resources available for other initiatives (see Indicator C7).
In addition, during the current COVID-19 crisis, the high share of teachers over the age of 50 may raise health concerns, as older individuals are more at risk of developing severe forms of the disease (Jordan, Adab and Cheng, 2020[15]). As an attempt ensure the safe reopening of schools, a number of countries had prioritised teachers’ vaccination as of March 2021. Teachers’ age was a criterion for the prioritisation of vaccination among teachers at the pre-primary to upper secondary levels combined in Austria, Chile, Colombia, the Czech Republic, Germany, Latvia and Slovenia (OECD, 2021[3]).
There are two categories of instructional personnel:
Teachers’ aides and teaching/research assistants include non-professional personnel or students who support teachers in providing instruction to students.
Teaching staff refers to professional personnel directly involved in teaching to students. The classification includes classroom teachers, special-education teachers and other teachers who work with a whole class of students in a classroom, in small groups in a resource room, or in one-to-one teaching situations inside or outside a regular class. At the tertiary level, academic staff include personnel whose primary assignment is instruction or research. Teaching staff also include departmental chairs whose duties include some teaching, but exclude non-professional personnel who support teachers in providing instruction to students, such as teachers’ aides and other paraprofessional personnel.
The share of teachers in the population corresponds to the proportion of teachers in a given age group (e.g. below the age of 30) among the total population of the same age group.
For more information, please see the OECD Handbook for Internationally Comparative Education Statistics 2018 (OECD, 2018[16]) and Annex 3 for country-specific notes (https://www.oecd.org/education/education-at-a-glance/EAG2021_Annex3_ChapterD.pdf).
Data refer to the academic year 2018/19 and are based on the UNESCO-UIS/OECD/EUROSTAT data collection on education statistics administered by the OECD in 2020 (for details, see Annex 3 at https://www.oecd.org/education/education-at-a-glance/EAG2021_Annex3_ChapterD.pdf).
References
[10] Antecol, H., O. Eren and S. Ozbeklik (2015), “The effect of teacher gender on student achievement in primary school: Evidence from a randomized experiment”, IZA Discussion Paper 6453.
[14] Beilock, S. et al. (2010), “Female teachers’ math anxiety affects girls’ math achievement”, Proceedings of the National Academy of Sciences of the United States of America, Vol. 107/5, https://doi.org/10.1073/pnas.0910967107.
[5] Croft, A. et al. (2014), “The Second Shift Reflected in the Second Generation”, Psychological Science, Vol. 25/7, pp. 1418-1428, https://doi.org/10.1177/0956797614533968.
[9] Drudy, S. (2008), “Gender balance/gender bias: the teaching profession and the impact of feminisation”, Gender and Education, Vol. 20/4, pp. 309-323, https://doi.org/10.1080/09540250802190156.
[11] Holmlund, H. and K. Sund (2008), “Is the gender gap in school performance affected by the sex of the teacher?”, Labour Economics, Vol. 15/1, pp. 37-53, https://doi.org/10.1016/J.LABECO.2006.12.002.
[12] Hutchings, M. et al. (2008), “Nice and kind, smart and funny: What children like and want to emulate in their teachers”, Oxford Review of Education, Vol. 34/2, https://doi.org/10.1080/03054980701663959.
[15] Jordan, R., P. Adab and K. Cheng (2020), “Covid-19: Risk factors for severe disease and death”, BMJ, p. m1198, https://doi.org/10.1136/bmj.m1198.
[6] Kane, J. and J. Mertz (2012), “Debunking Myths about Gender and Mathematics Performance”, Notices of the American Mathematical Society, Vol. 59/01, p. 10, https://doi.org/10.1090/noti790.
[8] OECD (2021), Positive, High-achieving Students?: What Schools and Teachers Can Do, TALIS, OECD Publishing, Paris, https://dx.doi.org/10.1787/3b9551db-en.
[3] OECD (2021), The State of School Education – One year into the pandemic, OECD Publishing, Paris.
[1] OECD (2019), TALIS 2018 Results (Volume I): Teachers and School Leaders as Lifelong Learners, TALIS, OECD Publishing, Paris, https://dx.doi.org/10.1787/1d0bc92a-en.
[16] OECD (2018), OECD Handbook for Internationally Comparative Education Statistics 2018: Concepts, Standards, Definitions and Classifications, OECD Publishing, Paris, https://doi.org/10.1787/9789264304444-en.
[2] OECD (2017), “Gender imbalances in the teaching profession”, Education Indicators in Focus, No. 49, OECD Publishing, Paris, https://dx.doi.org/10.1787/54f0ef95-en.
[4] OECD (2015), “What Lies Behind Gender Inequality in Education?”, PISA in Focus, No. 49, OECD Publishing, Paris, https://dx.doi.org/10.1787/5js4xffhhc30-en.
[7] OECD (2014), PISA 2012 Results: What Students Know and Can Do (Volume I, Revised edition, February 2014): Student Performance in Mathematics, Reading and Science, PISA, OECD Publishing, Paris, https://dx.doi.org/10.1787/9789264208780-en.
[13] OECD (2014), TALIS 2013 Results: An International Perspective on Teaching and Learning, TALIS, OECD Publishing, Paris, https://dx.doi.org/10.1787/9789264196261-en.
Cut-off date for the data: 17 June 2021. Any updates on data can be found on line at https://doi.org/10.1787/eag-data-en. More breakdowns can also be found at http://stats.oecd.org/, Education at a Glance Database.
Table D5.1. Gender distribution of teachers (2019) |
|---|
Percentage of female teachers in public and private institutions by level of education, based on head counts |
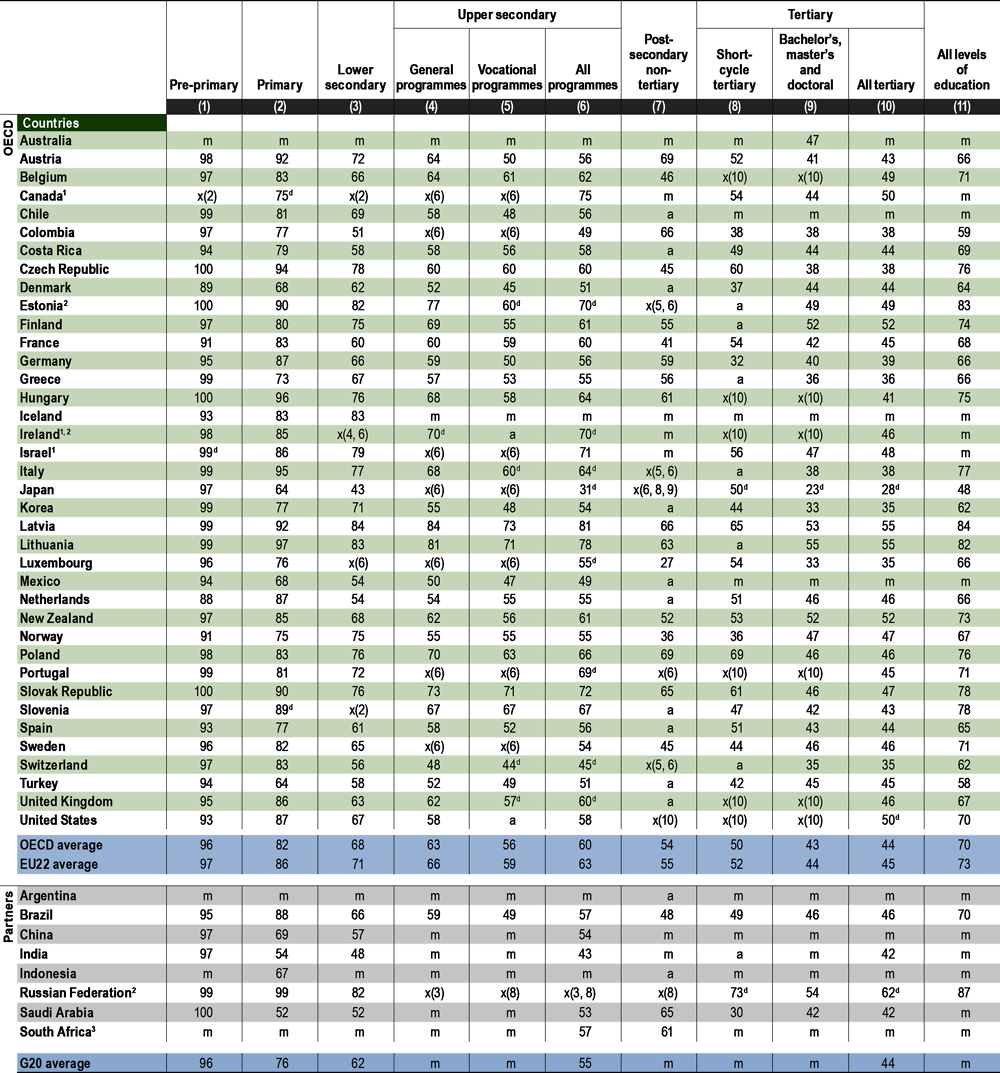 |
Note: The data for "All levels of education" do not include early childhood educational development (ISCED 01). |
1. For Canada, tertiary level values include only public institutions. For Ireland values for all levels except pre-primary education include only public institutions. For Israel, values for pre-primary, lower secondary, upper secondary, short-cycle tertiary and all tertiary include only public institutions. |
Source: OECD/UIS/Eurostat (2021). See Source section for more information and Annex 3 for notes (https://www.oecd.org/education/education-at-a-glance/EAG2021_Annex3_ChapterD.pdf). Please refer to the Reader's Guide for information concerning symbols for missing data and abbreviations. |
Table D5.2. Gender distribution of teachers by age group (2019) and percentage of female teachers for all ages (2005 and 2019) |
|---|
Percentage of female teachers, by age group and level of education |
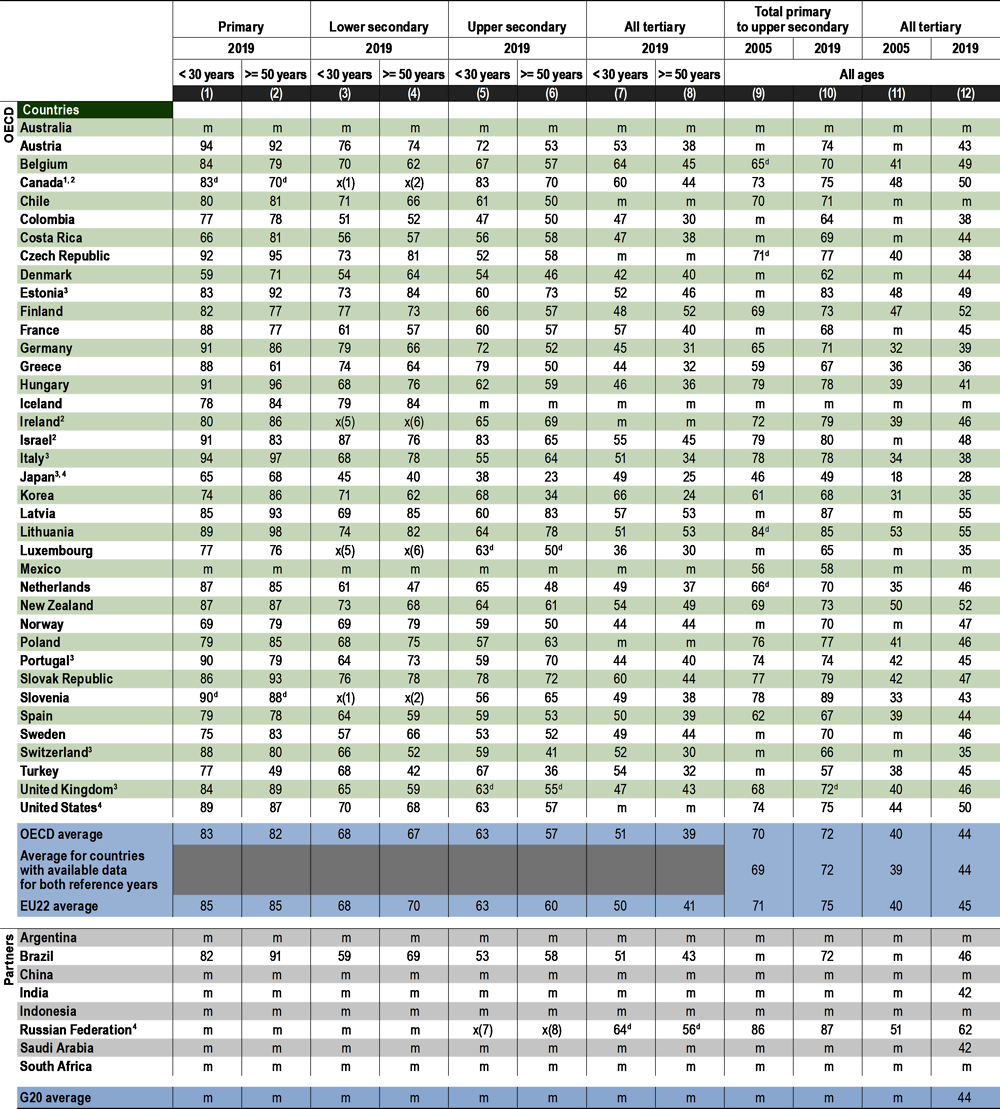 |
2. For Canada, tertiary level values include only public institutions. For Ireland, values for all levels of education include only public institutions. For Israel, values for lower secondary, upper secondary and all tertiary include only public institutions. |
3. Upper secondary includes programmes outside upper secondary level. See Annex 3 for further details. |
4. Tertiary includes programmes outside tertiary level. See Annex 3 for further details. |
Source: OECD/UIS/Eurostat (2021). See Source section for more information and Annex 3 for notes (https://www.oecd.org/education/education-at-a-glance/EAG2021_Annex3_ChapterD.pdf ). Please refer to the Reader's Guide for information concerning symbols for missing data and abbreviations. |
Table D5.3. Age distribution of teachers (2019) |
|---|
Percentage of teachers in public and private institutions, by level of education and age group, based on head counts |
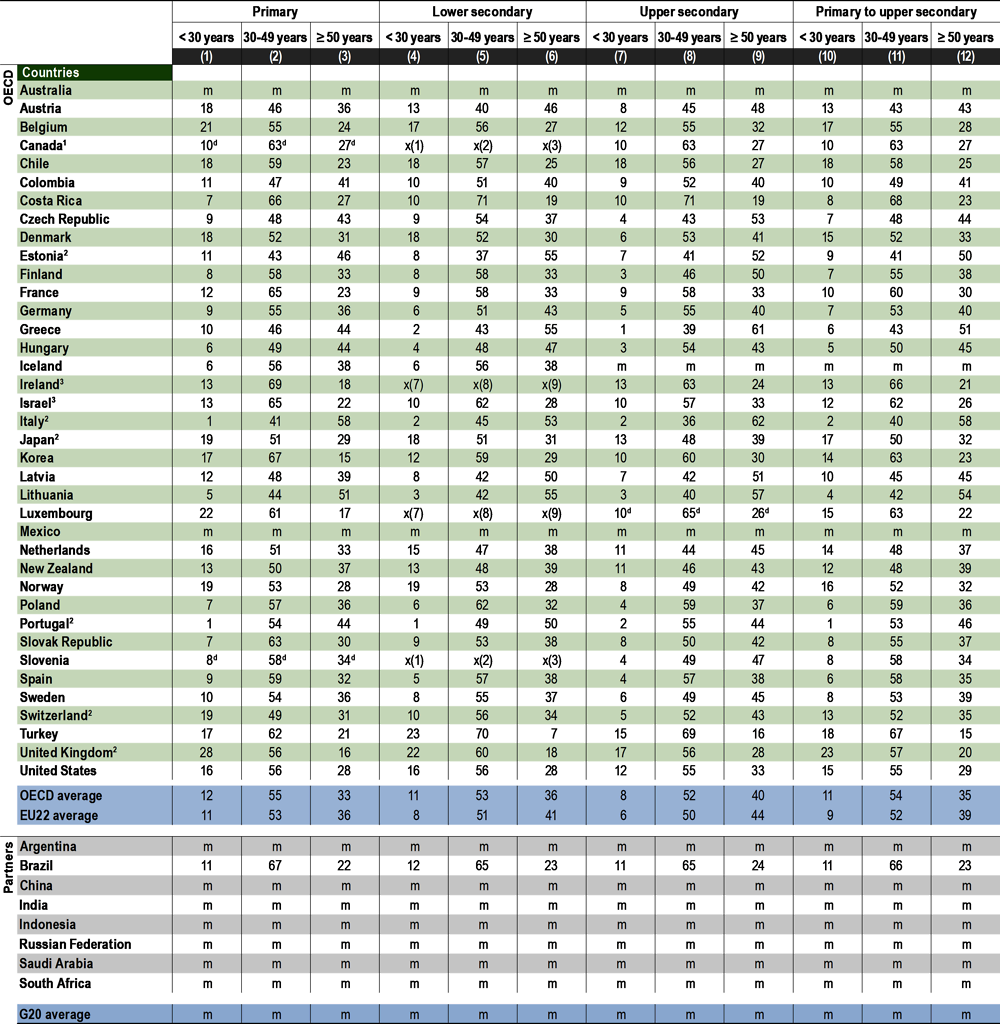 |
2. Upper secondary includes programmes outside upper secondary level. See Annex 3 for further details. |
3. For Ireland values for all levels of education include only public institutions. For Israel, values for lower secondary and upper secondary education include only public institutions. |
Source: OECD/UIS/Eurostat (2021). See Source section for more information and Annex 3 for notes (https://www.oecd.org/education/education-at-a-glance/EAG2021_Annex3_ChapterD.pdf). Please refer to the Reader's Guide for information concerning symbols for missing data and abbreviations. |