.jpg?a4384ad645a7284c15259ce80248ac2e)
Indicator C1. How much is spent per student on educational institutions?
On average, OECD countries spend USD 11 700 per student on primary to tertiary educational institutions. This represents about USD 10 500 per student at primary, secondary and post-secondary non-tertiary level, and USD 17 100 at tertiary level.
In non-tertiary education (primary, secondary and post-secondary non-tertiary levels), 96% of institutions’ expenditure per student is devoted to core educational services (such as teaching costs); the remainder is devoted to ancillary services (such as student welfare). At the tertiary level, a much lower share of institutional expenditure goes to core services (68%), while roughly 32% of total educational expenditure per student is on ancillary and research and development (R&D).
Across OECD countries, total cumulative expenditure on students enrolled at primary or secondary school between the age of 6 and 15 add up to around USD 102 200 per student. However, this total cumulative expenditure varies considerably among countries, ranging from USD 28 700 to USD 230 000.
Context
The willingness of policy makers to expand access to educational opportunities and to provide high-quality education can translate into higher costs per student and must be balanced against other demands on public expenditure and the overall tax burden. As a result, the question of whether the resources devoted to education yield adequate returns features prominently in public debate. Although it is difficult to assess the optimal resources needed to prepare each student for life and work in modern societies, international comparisons of spending on educational institutions per student can provide useful reference points.
This indicator provides an assessment of the investment in each student. Expenditure per student on educational institutions is influenced by teachers’ salaries (see Indicator D3), pension systems, instructional and teaching hours (see Indicators D1 and D4), the cost of teaching materials and facilities (see Indicator C6), the programme provided (e.g. general or vocational), and the number of students enrolled in the education system (see Indicator B1). Policies to attract new teachers, reduce average class sizes or change staffing patterns (see Indicator D2) have also affected per-student expenditure. Ancillary services and R&D activities also influence the level of expenditure per student.
In general, at primary and secondary levels, educational expenditure is dominated by spending on instructional services. At the tertiary level, other services, particularly those related to ancillary services or R&D activities, can account for a significant proportion of educational spending.
Other findings
On average, private sources in OECD countries spend almost USD 1 800 per student per year from primary to tertiary education. Private sources spend around USD 900 per student in primary, secondary and post-secondary non-tertiary levels, while, this figure increases up to USD 5 100 per student in tertiary levels of education.
On average, total expenditure per student is similar in private institutions and public ones from primary to tertiary education. Total expenditure is higher in private institutions than in public ones in primary, secondary and post-secondary non-tertiary levels, while the opposite is observed at tertiary levels.
Public expenditure on public institutions averaged about USD 10 700 per student from primary to tertiary education across OECD countries. Public expenditure per student in primary, secondary and post-secondary non-tertiary programmes was almost USD 3 800 lower than at the tertiary level.
From 2012 to 2018, expenditure on primary to tertiary educational institutions grew at a rate of 1.7% a year on average across OECD countries, while the number of students remained fairly stable. This resulted in an average annual growth rate of 1.6% in expenditure per student over this period.
On average, OECD countries spent the equivalent of 23% of gross domestic product (GDP) per capita per student on primary, secondary and post-secondary non-tertiary educational institutions in 2018. The figure is much higher at tertiary level, where countries spent, on average, 37% of GDP per capita per tertiary student. The higher spending is largely driven by the expenditure on R&D activities per tertiary student, which accounts for 11% of GDP per capita.
Overall expenditure per student on educational institutions
Annual expenditure per student on educational institutions from primary to tertiary level provides an assessment of the investment made in each student. In 2018, the average annual spending per student from primary to tertiary education in OECD countries as a whole was almost USD 11 700. But this average masks a broad range of spending across OECD and partner countries. Annual spending per student at these levels ranged from around USD 3 100 in Colombia to around USD 18 000 in Norway and the United States, and to more than USD 24 900 in Luxembourg (Table C1.1). The drivers of expenditure per student vary across countries and by level of education: the countries with the highest expenditure per student enrolled in primary through tertiary education (e.g. Luxembourg and the United States) are also among those that tend to pay their teachers at primary and secondary level the most (see Indicator D3). In contrast, Colombia has one of the highest ratios of students to teaching staff, which tends to drive costs down (see Indicator D2).
Annual expenditure per student can also vary significantly within countries, particularly in those where a large share of education expenditure is provided by local governments (Box C1.1).
Expenditure per student on educational institutions by level of education
The way resources are allocated across the different levels of education varies widely from level to level and largely reflects the mode of educational provision. Education still essentially takes place in settings with generally similar organisations, curricula, teaching styles and management. These shared features have tended to result in similar patterns of expenditure per student from primary to post-secondary non-tertiary levels. OECD countries as a whole spend on average around USD 9 600 per student at the primary level and USD 11 200 per student at secondary level. At secondary level, and particularly at upper secondary, the level of expenditure is strongly influenced by the programme orientation. Vocational education and training (VET) programmes, which may require specific equipment and infrastructure, typically cost more per student than general programmes. The size of the work-based component of VET programmes also influences their cost through expenditure on training and wages (Table C1.1).
Private sources in OECD countries spend around USD 1 800 per student in primary to tertiary levels of education. However, the greater reliance on private funding in tertiary education has led to higher expenditure at this level than in lower levels of education, reaching more than USD 5 100 (see Indicator C3, and Table C1.5, available on line). In 2018, while OECD countries spent on average around USD 10 500 per student at the primary, secondary and post-secondary non-tertiary levels, expenditure per student reached USD 17 100 at the tertiary level. However, the average expenditure at tertiary level is driven up by high values in a few countries, ranging from USD 24 500 to USD 47 700, most notably Canada, Luxembourg, Norway, Sweden, the United Kingdom and the United States (Table C1.1).
Expenditure per student on educational institutions rises with the level of education in almost all countries, but the range varies markedly across countries (Table C1.1). OECD countries spend on average 17% more per secondary student than they do per primary student. This percentage is near 50% or more in the Czech Republic, France and the Netherlands. However, Chile, Denmark, Israel, Mexico, Poland and the Slovak Republic all invest more per primary student than on each secondary student, despite the fact that teacher’s salaries, a strong driver of total expenditure, tend to increase with higher levels of education. Similarly, educational institutions in OECD countries spend an average of 22% more on each tertiary student (excluding R&D) than on each primary student. Hungary, Mexico, Turkey, the United Kingdom and the United States spend about twice as much on a tertiary student (excluding R&D) than they do on a primary student (Table C1.1).
Decentralisation of government services in OECD countries often results in subnational governments being responsible for the delivery of key government services such as education (Dougherty and Phillips, 2019[1]). In this stream of literature, evidence shows that educational performance (Kim and Dougherty, 2018[2]) and human capital levels (Blöchliger, Égert and Bonesmo Fredriksen, 2013[3]) might increase as a result of an increase in the overall budget devoted to education due to fiscal decentralisation.Annual expenditure per student can be quite heterogeneous across countries with large differences between regions, due to their economic circumstances and geographic challenges. Among the eight countries with available data at subnational level, Canada, Colombia and the United States have the highest variation in annual expenditure per student on educational institutions at primary and secondary levels combined: in the United States, the region with the highest value (USD 28 000) spends almost three times as much per student as the region with the lowest value (almost USD 9 000). Smaller regional differences are found in Germany, Spain and Switzerland, while in Belgium and Lithuania, expenditure per student on primary and secondary educational institutions is almost identical across the regions.
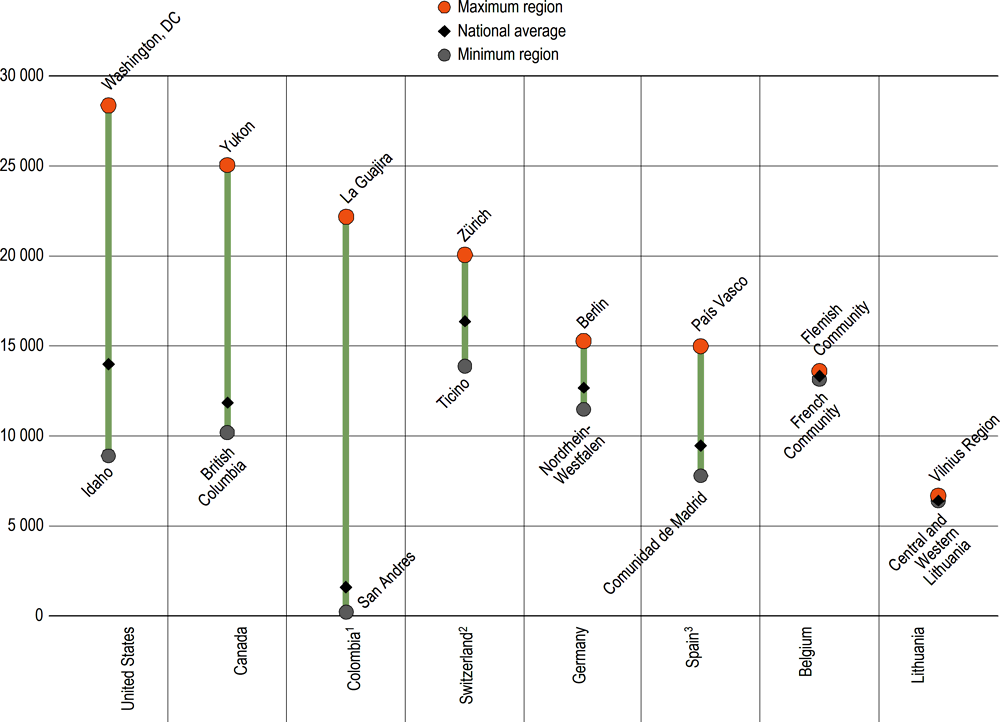
Note: To ensure comparability across countries, expenditure figures were converted into common currency (USD) using national purchasing power parities (PPPs). However, differences in the cost of living within countries were not taken into account.
1. Government expenditure data transferred to subnational entities.
2. Only expenditure for teaching and non-teaching staff.
3. Public expenditure on education in public institutions.
Countries are ranked in descending order of maximum subnational expenditure on educational institutions per full-time equivalent student.
Source: OECD (2021). See Source section for more information and Annex 3 for notes (https://www.oecd.org/education/education-at-a-glance/EAG2021_Annex3_ChapterC.pdf).
Expenditure per student on core education services, ancillary services and R&D
On average across OECD countries, expenditure on core education services (such as teaching costs and other expenditure related to education) represents 89% of total expenditure per student from primary to tertiary educational institutions, exceeding 90% in Chile, Latvia, Poland and Turkey. In about one-third of OECD and partner countries with available data, annual expenditure on R&D and ancillary services per student accounts for around 15% or more of the total annual expenditure per student on primary to tertiary institutions. In Finland and the Slovak Republic, this reaches about 20% (Figure C1.3 and Table C1.6 available on line).
However, this overall picture masks large variations across levels of education (Figure C1.3). At non-tertiary levels (primary, secondary and post-secondary non-tertiary education), expenditure is dominated by spending on core education services. On average, OECD countries spend 96% of their total per-student expenditure (about USD 10 000) on core educational services at these levels. However, in Finland, France, Hungary, the Slovak Republic and the United Kingdom, ancillary services account for 10% or slightly more of the expenditure per student (Figure C1.3).
The share of total expenditure on educational institutions per student devoted to core services differs more widely at tertiary level, as R&D expenditure can account for a significant proportion of educational spending (Figure C1.3). On average across OECD countries, 68% of total expenditure on educational institutions at tertiary level goes to core services. Excluding R&D activities, expenditure per student across OECD countries averages about USD 11 700, ranging from about USD 2 000 in Colombia and Greece to USD 28 000 or more in Luxembourg and the United States (Figure C1.3 and Table C1.6 available on line).
OECD countries in which R&D is mostly conducted in tertiary educational institutions tend to report higher levels of expenditure per student than those where a large proportion of R&D is performed in other public institutions or in industry (Figure C1.3). On average across OECD countries, expenditure on R&D and ancillary services at the tertiary level represents 32% of all tertiary expenditure on educational institutions per student. In six of the OECD and partner countries for which data are available, expenditure on R&D and ancillary services in tertiary institutions is at least 40% of total expenditure on educational institutions per student, with Germany and Sweden recording the highest shares, at 50% or more (Figure C1.3 and Table C1.6 available on line).
The share of expenditure on ancillary services tends to be higher in tertiary education than at lower levels of education (Figure C1.3). On average, only 5% of expenditure on tertiary institutions goes towards ancillary services, and the amount is negligible (below USD 100 per student) in the Czech Republic, Denmark, Finland, Israel, Norway and Sweden. The United States spends the most in ancillary services per student at tertiary level among OECD countries, over USD 4 400 per student (Figure C1.3 and Table C1.6 available on line).
Cumulative expenditure over the expected duration of studies
Policy makers are interested in the relationship between the resources devoted to education and the outcomes of education systems (OECD, 2017[4]). In order to compare the cost of education across countries, it is important to consider not only the yearly expenditure per student, but also the cumulative expenditure for students over the total period they are expected to spend at an educational level. High expenditure per student, for example, might be offset by short programmes or weaker access to education at certain levels. On the other hand, a seemingly inexpensive education system per student can prove to be costly overall if enrolment is high and students spend more time in school.
Primary and secondary education are usually compulsory across the OECD, and the theoretical cumulative expenditure per student aged between 6 and 15 at these levels shows how much it costs to teach a student on average based on current compulsory education (Figure C1.1 and Table C1.7, available on line). On average across OECD countries, students aged between 6 and 15 add up to a total cumulative expenditure of around USD 102 200 per student. Theoretical cumulative expenditure on educational institutions per student varies considerably among countries. Austria, Iceland, Luxembourg and Norway spend over USD 150 000 per student across those two levels, while the figure is less than USD 50 000 in Colombia, Mexico and Turkey.
Expenditure per student on educational institutions relative to GDP per capita
Expenditure on educational institutions per student relative to GDP per capita is a measure of spending that takes into account the relative wealth of OECD countries. Since access to education in most OECD countries is universal (and usually compulsory) at lower levels of schooling, the amount spent per student as a share of GDP per capita can indicate whether the resources spent per student are proportionate to the country’s ability to pay. At higher levels of education, where student enrolment varies sharply among countries, the link is less clear. At tertiary level, for example, OECD countries may rank relatively high on this measure, even when a large proportion of their wealth is spent on educating a relatively small number of students.
In OECD countries, overall expenditure per student on educational institutions from primary to tertiary levels averages 26% of GDP per capita, which can be broken down into 23% at primary, secondary and post-secondary non-tertiary levels and 37% at the tertiary level. Countries with low levels of expenditure per student may still be investing relatively large amounts as a share of GDP per capita. For example, Portugal’s expenditure per student for most educational levels and its GDP per capita are both below the OECD average and it spends an above-average share of its GDP per capita per student at most educational levels (Table C1.4, available on line).
The relationship between GDP per capita and expenditure per student on educational institutions is difficult to interpret. There is a clear positive relationship between the two at non-tertiary educational levels (Figure C1.4). In other words, less wealthy countries tend to spend less per student than richer countries. Although the relationship is generally positive at these levels, there are variations even between countries with similar levels of GDP per capita, especially among countries where GDP per capita exceeds USD 30 000. Austria and the Netherlands, for example, have similar levels of GDP per capita (around USD 57 000; see Table X2.1 in Annex 2), but they allocate very different shares of their wealth to primary, secondary and post-secondary non-tertiary education. Austria spends 27% of GDP per capita on non-tertiary institutions (above the OECD average of 23%), while the Netherlands spends 22% (Table C1.4, available on line).
At tertiary level, there is more variation in spending and in the relationship between countries’ relative wealth and their level of tertiary expenditure. Canada, the United Kingdom and the United States spend 50% or more of GDP per capita on each student in tertiary institutions. The high share for the United Kingdom is mostly the result of its high expenditure on R&D, which accounts for about one-fifth of total expenditure per student at this level (Table C1.4, available on line).
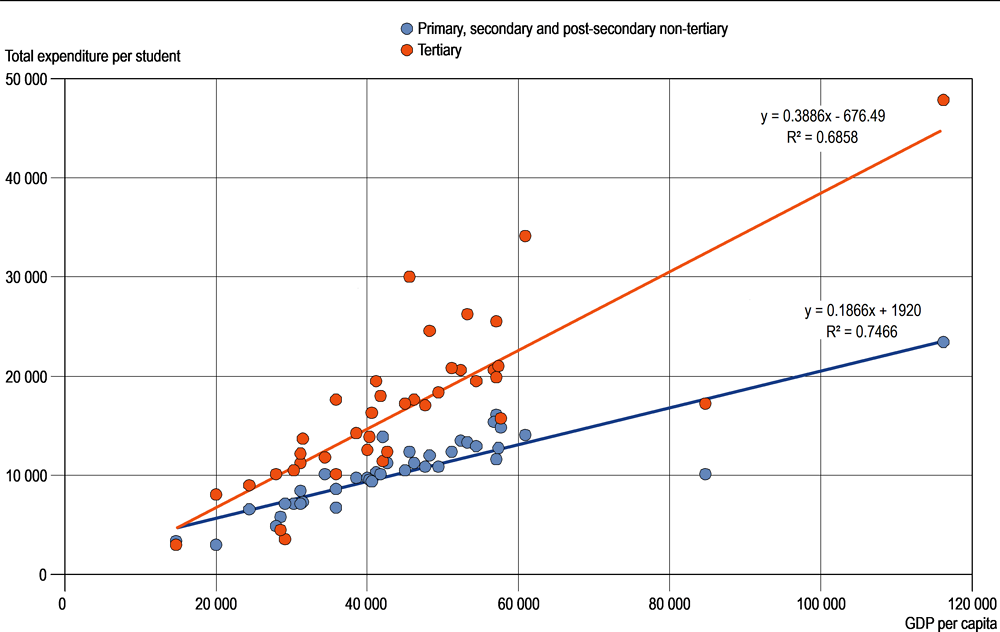
Source: OECD/UIS/Eurostat (2021), Table C1.1. and Annex 2 (Chapter C). See Source section for more information and Annex 3 for notes (https://www.oecd.org/education/education-at-a-glance/EAG2021_Annex3_ChapterC.pdf).
Total and public expenditure on educational institutions per student, by type of institution
The resources devoted to private educational institutions are similar to the ones devoted to public institutions. On average across OECD countries, total expenditure on primary to tertiary public institutions amounts to over USD 11 600 per student, compared to just under USD 11 600 in private ones. However. the differences are significant in countries such as Greece, Israel, the Netherlands, Turkey, the United Kingdom and the United States, where expenditure per student in private institutions is at least USD 5 000 higher than expenditure in public ones. In contrast, in countries such as Australia, Austria, Canada, the Czech Republic, Denmark, Iceland, Korea and Luxembourg, at least USD 4 000 more are invested per student in public institutions than in private ones (Table C1.2).
The way resources are allocated to public and private institutions varies widely across educational levels and largely reflects the mode of educational provision. Total expenditure in primary, secondary and post-secondary non-tertiary educational institutions is higher in private institutions than in public ones. On average, OECD countries spend USD 11 600 per student in private institutions, USD 1 000 more than in public ones. On the contrary, total expenditure per student on tertiary institutions is at least USD 4 000 higher in public institutions than in private ones.
Government funding on education generally supports public institutions; but in some cases, a significant part of the public budget may be spent on private educational institutions. On average across OECD countries, public expenditure per student on primary to tertiary public educational instructions (USD 10 700) is nearly twice the public expenditure per student on private institutions (USD 5 700). However, the difference varies at different levels of education. At non-tertiary level, average public expenditure per student on public institutions is USD 10 100, about 40% more than the expenditure on private institutions (USD 6 300), whereas at tertiary level it averages USD 13 900 on public institutions, more than three times the expenditure on private institutions (USD 4 700) (Table C1.2).
Change in expenditure per student on educational institutions between 2012 and 2018
Changes in expenditure on educational institutions largely reflect changes in the size of the school-age population and the expenditure allocated to teachers’ compensation, one of the main drivers of education expenditure. The size of the school-age population influences both enrolment levels and the amount of resources and organisational effort a country must invest in its education system. The larger this population, the greater the potential demand for education services. Changes in expenditure per student over the years may also vary between levels of education within countries, as both enrolment and expenditure may follow different trends at different levels of education.
Between 2012 and 2018, expenditure per student on primary to tertiary educational institutions grew at an average rate of 1.6% per year in OECD countries while the number of students remained stable (Table C1.3 and Figure C1.5). Over this period, the average annual growth in spending per student was positive in all countries with available data, with the exception of Finland, Greece, the Russian Federation and Slovenia. The decrease in expenditure per student observed in these countries (between 0.1% and 1.4%) is either the combined effect of a reduction on spending on educational institutions and a slight increase in the number of students or, as in the case in the Russian Federation and Slovenia, the result of lower expenditure than student growth over this period. In some countries within the European Union, such as the Czech Republic, Estonia, Hungary, Latvia, Poland and the Slovak Republic, the strong annual growth rates in expenditure per student (around or above 3%) can be explained by a significant increase in expenditure accompanied by a significant decrease in the growth of the number of students over the period under analysis. Outside the European Union, Chile, Iceland and Turkey have also reported increases in spending per student of around or above 2% per year in real terms since 2012 (Table C1.3).
At non-tertiary levels, the number of students remained fairly stable on average across OECD countries between 2012 and 2018. During the same period, expenditure on non-tertiary educational institutions increased by an annual average growth rate of 1.9%. As a result, expenditure per student at these levels increased by 1.8% per year on average between 2012 and 2018. Most OECD countries spent more per student in 2018 than they did in 2012, with the exception of Denmark, Finland, Greece, Luxembourg and Slovenia. Expenditure per student increased by more than 4% per year in Chile, Colombia, Hungary, Iceland and the Slovak Republic. This resulted from stable or slight annual reductions in student enrolments combined with significant annual increases (above 3%) in total spending on non-tertiary institutions between 2012 and 2018. In contrast, the increase in the number of students enrolled was accompanied by a reduction in spending on educational institutions per student in Finland, Luxembourg and Slovenia (Table C1.3).
Expenditure at tertiary level increased at a slightly lower rate than at lower levels of education, rising on average by 0.8% annually between 2012 and 2018. It also increased faster than the number of students enrolled over this period (annual average growth rate of 0.4%). As a result, OECD countries recorded an average increase in expenditure per student of 0.7% per year over this period. However, there are stark differences across countries. Among OECD and partner countries with available data, Chile, Colombia, Finland, France, Germany, Greece, Israel, Italy, Japan, Lithuania, the Netherlands and Turkey recorded a decrease in expenditure on tertiary education per student. In most of these countries, the decline was mainly the result of a rapid increase in the number of tertiary students. In contrast, expenditure per tertiary student increased by more than 4% in the Czech Republic, Estonia, Hungary, Poland and the Slovak Republic due to an increase in total expenditure and a reduction in the number of students (Table C1.3).
Ancillary services are services provided by educational institutions that are peripheral to their main educational mission. The main component of ancillary services is student welfare. In primary, secondary and post-secondary non-tertiary education, student welfare services include meals, school health services, and transportation to and from school. At the tertiary level, they include residence halls (dormitories), dining halls and health care.
Core educational services include all expenditure that is directly related to instruction in educational institutions, including teachers’ salaries, construction and maintenance of school buildings, teaching materials, books, and school administration.
Research and development includes research performed at universities and other tertiary educational institutions, regardless of whether the research is financed from general institutional funds or through separate grants or contracts from public or private sponsors.
The annual average growth rate is calculated using the compound annual growth rate which shows the geometric progression ratio that provides a constant rate of return over the time period under analysis.
Expenditure per student on educational institutions at a particular level of education is calculated by dividing total expenditure on educational institutions at that level by the corresponding full-time equivalent enrolment. Only educational institutions and programmes for which both enrolment and expenditure data are available are taken into account. Expenditure in national currencies is converted into equivalent USD by dividing the national currency figure by the purchasing power parity (PPP) index for GDP. The PPP conversion factor is used because the market exchange rate is affected by many factors (interest rates, trade policies, expectations of economic growth, etc.) that have little to do with current relative domestic purchasing power in different OECD countries (see Annex 2 for further details).
Data on subnational regions on how much is spent per student are adjusted using national PPPs. Future work on the cost of living at subnational level would be required to fully adjust the expenditure per student used in this section.
Expenditure per student on educational institutions relative to GDP per capita is calculated by dividing expenditure per student on educational institutions by GDP per capita. In cases where the educational expenditure data and the GDP data pertain to different reference periods, the expenditure data are adjusted to the same reference period as the GDP data, using inflation rates for the OECD country in question (see Annex 2).
Full-time equivalent student: The ranking of OECD countries by annual expenditure on educational services per student is affected by differences in how countries define full-time, part-time and full-time equivalent enrolment. Some OECD countries count every participant at the tertiary level as a full-time student, while others determine students’ intensity of participation by the credits that they obtain for the successful completion of specific course units during a specified reference period. OECD countries that can accurately account for part-time enrolment have higher apparent expenditure per full-time equivalent student on educational institutions than OECD countries that cannot differentiate between the different types of student attendance.
Vocational education and training expenditure: Expenditure on workplace training provided by private companies is only included when it is part of combined school- and work-based programmes, provided that the school-based component represents at least 10% of the study over the whole programme duration. Other types of employer-provided workplace training (e.g. entirely work-based training or employee training that takes place 95% at work) are excluded. Expenditure on VET programmes include the expenditure on training (e.g. salaries and other compensation of instructors and other personnel, as well as the cost of instructional materials and equipment). However, it excludes apprentices’ wages and other compensations to students or apprentices.
For more information please see the OECD Handbook for Internationally Comparative Education Statistics 2018 (OECD, 2018[5]) and Annex 3 for country-specific notes (https://www.oecd.org/education/education-at-a-glance/EAG2021_Annex3_ChapterC.pdf).
Data refer to the financial year 2018 (unless otherwise specified) and are based on the UNESCO, OECD and Eurostat (UOE) data collection on education statistics administered by the OECD in 2020 (for details see Annex 3 at: https://www.oecd.org/education/education-at-a-glance/EAG2021_Annex3_ChapterC.pdf). Data from Argentina, China, India, Indonesia, Saudi Arabia and South Africa are from the UNESCO Institute of Statistics (UIS).
The data on expenditure for 2012 to 2018 were updated based on a survey in 2020-21, and expenditure figures for 2012 to 2018 were adjusted to the methods and definitions used in the current UOE data collection.
Data on subnational regions are currently available for eight countries: Belgium, Canada, Colombia, Germany, Lithuania, Spain, Switzerland and the United States. Subnational estimates were provided by countries using national data sources. Subnational data are based on a special survey administrated by the OECD in 2021.
References
[3] Blöchliger, H., B. Égert and K. Bonesmo Fredriksen (2013), “Fiscal federalism and its impact on economic activity, public investment and the performance of educational systems”, OECD Economics Department Working Papers, No. 1051, OECD Publishing, Paris, https://dx.doi.org/10.1787/5k4695840w7b-en.
[1] Dougherty, S. and L. Phillips (2019), “The spending power of sub-national decision makers across five policy sectors”, OECD Working Papers on Fiscal Federalism, No. 25, OECD Publishing, Paris, https://dx.doi.org/10.1787/8955021f-en.
[2] Kim, J. and S. Dougherty (eds.) (2018), Fiscal Decentralisation and Inclusive Growth, OECD Fiscal Federalism Studies, OECD Publishing, Paris/Korea Institute of Public Finance, Seoul, https://dx.doi.org/10.1787/9789264302488-en.
[5] OECD (2018), OECD Handbook for Internationally Comparative Education Statistics 2018, OECD Publishing, Paris, https://doi.org/10.1787/9789264304444-en.
[4] OECD (2017), Education at a Glance 2017: OECD Indicators, OECD Publishing, Paris, https://dx.doi.org/10.1787/eag-2017-en.
Cut-off date for the data: 17 June 2021. Any updates on data can be found on line at: https://doi.org/10.1787/eag-data-en. More breakdowns can also be found at: http://stats.oecd.org, Education at a Glance Database.
Table C1.1. Total expenditure on educational institutions per full-time equivalent student (2018) |
|---|
In equivalent USD converted using PPPs for GDP, direct expenditure within educational institutions, by level of education |
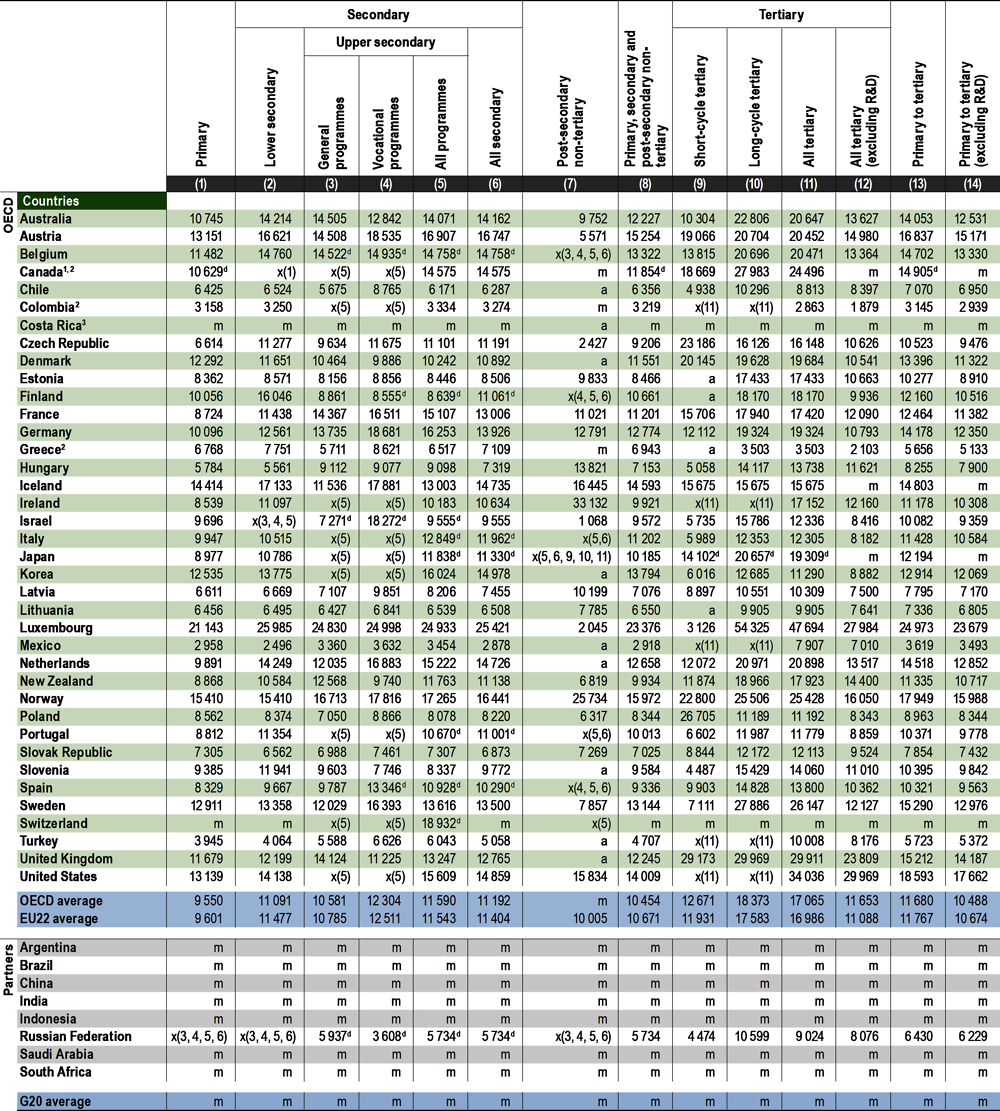 |
Note: See Definitions and Methodology sections for more information. Data and more breakdowns available at: http://stats.oecd.org, Education at a Glance Database. |
2. Post-secondary non-tertiary figures are treated as negligible. |
Source: OECD/UIS/Eurostat (2021). See Source section for more information and Annex 3 for notes (https://www.oecd.org/education/education-at-a-glance/EAG2021_Annex3_ChapterC.pdf). Please refer to the Reader's Guide for information concerning symbols for missing data and abbreviations. |
Table C1.2. Public and total expenditure on educational institutions per full-time equivalent student, by type of institution (2018) |
|---|
In equivalent USD converted using PPPs for GDP, direct expenditure within educational institutions (final source of funds), by level of education |
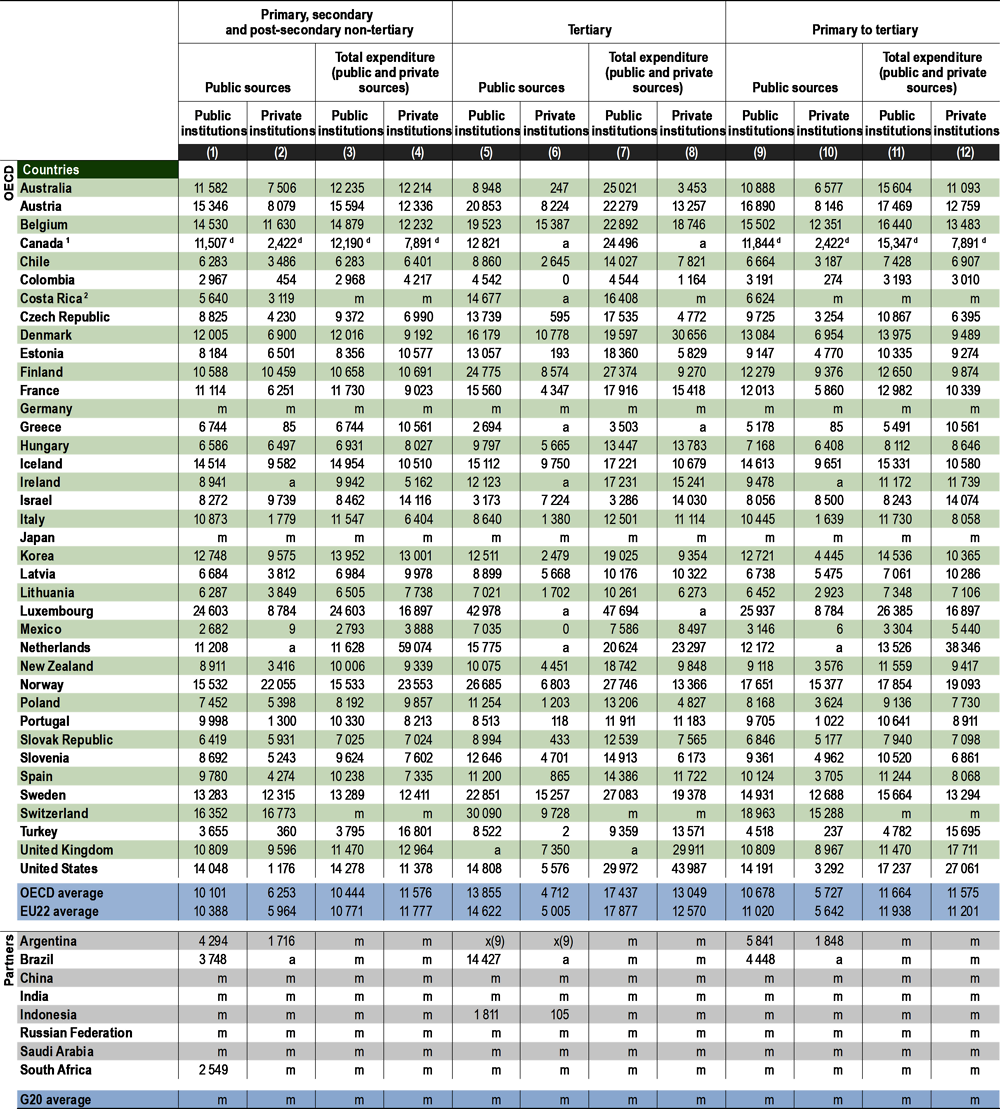 |
Note: See Definitions and Methodology sections for more information. Data and more breakdowns available at: http://stats.oecd.org, Education at a Glance Database. |
1. Primary, secondary and post-secondary non-tertiary education includes pre-primary programmes. |
Source: OECD/UIS/Eurostat (2021). See Source section for more information and Annex 3 for notes (https://www.oecd.org/education/education-at-a-glance/EAG2021_Annex3_ChapterC.pdf). Please refer to the Reader's Guide for information concerning symbols for missing data and abbreviations. |
Table C1.3. Average annual growth in total expenditure on educational institutions per full-time equivalent student (2012 to 2018) |
|---|
GDP deflator 2015=100, constant prices and constant PPPs, by level of education |
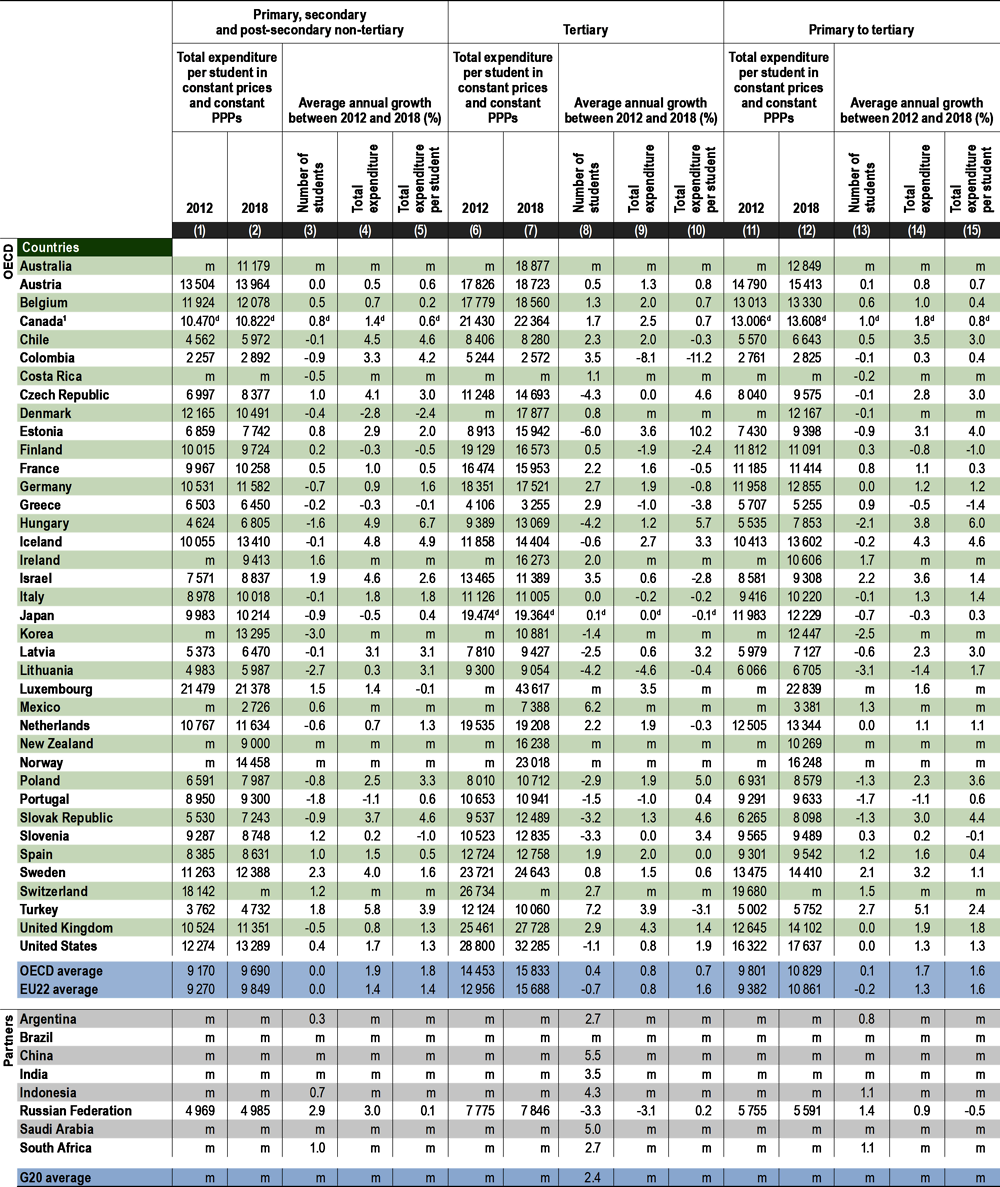 |
Note: See Definitions and Methodology sections for more information. Data and more breakdowns available at: http://stats.oecd.org, Education at a Glance Database. |
1. Primary, secondary and post-secondary non-tertiary education includes pre-primary programmes. |
Source: OECD/UIS/Eurostat (2021). See Source section for more information and Annex 3 for notes (https://www.oecd.org/education/education-at-a-glance/EAG2021_Annex3_ChapterC.pdf). Please refer to the Reader's Guide for information concerning symbols for missing data and abbreviations. |