.jpg?a4384ad645a7284c15259ce80248ac2e)
Indicator B6. What is the profile of internationally mobile students?
The largest flow of international students is from developing countries: 67% of all international students in the OECD area come from developing countres. Of this, 3% are from low-income countries (LICs), 26% are from lower middle-income countries (LMICs) and 38% are from upper middle-income countries (UMICs).
In Austria, Colombia, Greece, Indonesia, Korea, Poland and the Slovak Republic, more than 55% of internationally mobile students in 2019 came from neighbouring countries.
Women are less likely than men to enrol abroad in the field of engineering, manufacturing and construction (29% of international students are women) and more likely to study abroad in the fields of arts and humanities (the share of women is 62%) and health and welfare (63%).
Context
Studying abroad has become a key differentiating experience for young adults enrolled in tertiary education, and international student mobility has received increasing policy attention in recent years. Studying abroad is an opportunity to access high-quality education, acquire skills that may not be taught at home and get closer to labour markets that offer higher returns on education. Studying abroad is also seen as a way to improve employability in increasingly globalised labour markets. Other motivations include the desire to expand one’s knowledge of other societies and to improve language skills, particularly English.
For host countries, mobile students (whether international or foreign) may be an important source of income and have a disproportionate impact on their economic and innovation systems. They often pay higher tuition fees than domestic students (see Indicator C5) and, in some countries, incur higher registration fees. They also contribute to the local economy through their living expenses. In the longer run, highly educated mobile students are likely to integrate the domestic labour markets, contributing to innovation and economic performance. Attracting mobile students, especially if they stay permanently, is therefore a way to tap into a global pool of talent, compensate for weaker capacity at lower educational levels, support the development of innovation and production systems and, in many countries, to mitigate the impact of an ageing population on future skills supply.
For their countries of origin, mobile students might be viewed as lost talent (or “brain drain”). However, mobile students can contribute to knowledge absorption, technology upgrading and capacity building in their home country, provided they return home after their studies or maintain strong links with nationals at home. Mobile students gain tacit knowledge that is often shared through direct personal interactions and can enable their home country to integrate into global knowledge networks. Some research suggests that the number of students overseas is a good predictor of future scientist flows in the opposite direction, providing evidence of a significant movement of skilled labour across nations. In addition, student mobility appears to shape international scientific co-operation networks more deeply than either a common language or geographical or scientific proximity.
In 2020, higher educational institutions around the world closed down to control the spread of the COVID-19 pandemic, potentially affecting more than 3.9 million international and foreign students studying in OECD countries. The imposed lockdown affected the continuity of learning and the delivery of course material, as well as students’ perceptions about the value of their degree and their host country’s capacity to look out for their safety and well-being. These changes could have dire consequences on international student mobility in the coming years (OECD, 2021[1]).
Other findings
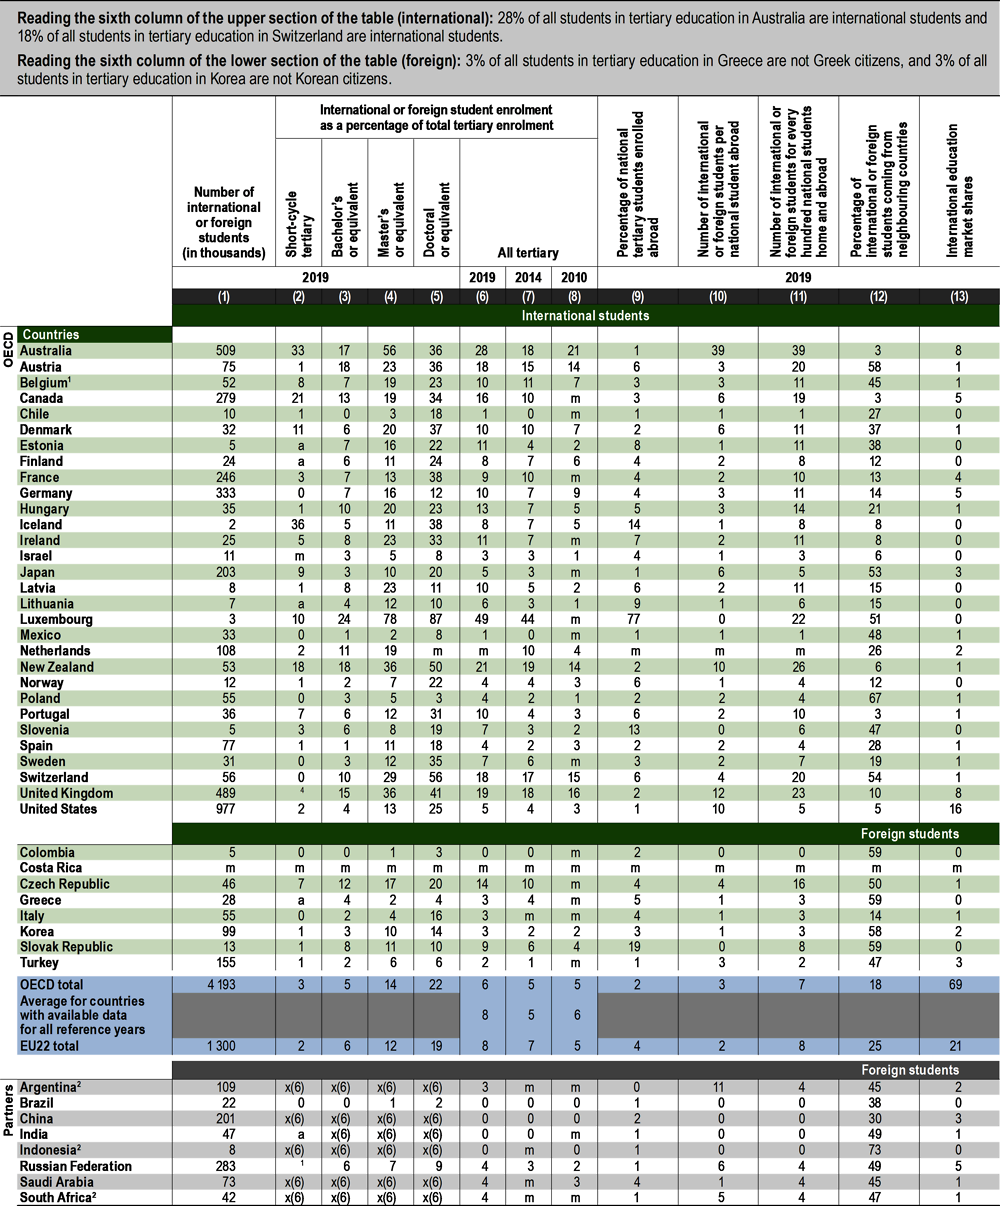
Most countries are net “importers” of students; that is, they have more students coming into the country to study than those leaving to study abroad. In total across OECD countries in 2019, there were three international students for each national student studying abroad, but this ratio equals or exceeds ten in Argentina, Australia, New Zealand, the United Kingdom and the United States.
International student mobility has been expanding quite consistently over the past 20 years. In 2019, 6.1 million tertiary students worldwide had crossed a border to study, more than twice the number in 2007. The number of international and foreign tertiary students grew on average by 5.5% per year between 1998 and 2019.
At doctoral or equivalent level, international students represent 22% of enrolled students. The countries with the highest shares are Luxembourg, New Zealand, Switzerland and the United Kingdom, which all have 40% or more of their doctoral students coming from abroad. In Luxembourg and Switzerland, there are more international students in doctoral programmes than national students (87% in Luxembourg and 56% in Switzerland).
Mobility patterns and international student flows
Many factors at the individual, institutional, national and global levels drive patterns of international student mobility. These include personal ambitions and aspirations for better employment prospects, a lack of high-quality higher educational institutions at home, the capacity of higher education institutions abroad to attract talent, and government policies to encourage cross-border mobility for education (Bhandari, Robles and Farrugia, 2020[2]). The needs of increasingly knowledge-based and innovation-driven economies have spurred demand for tertiary education worldwide, while rising wealth in emerging economies has prompted the children of the growing middle classes to seek educational opportunities abroad. At the same time, economic (e.g. costs of international flights), technological (e.g. the spread of the Internet and social media enabling contacts to be maintained across borders) and cultural factors (e.g. use of English as a common working and teaching language) have contributed to making international study substantially more affordable and easier to access than in the past.
The perceived quality of instruction abroad and the perceived value of host institutions are key criteria for international students when choosing where to study (Abbott and Silles, 2016[3]). Top destinations for internationally mobile students include a large number of top-ranked higher educational institutions. Students worldwide are increasingly aware of differences in quality among tertiary education systems, as university league tables and other international university rankings are widely disseminated. At the same time, the ability to attract international students has become a criterion for assessing the performance and quality of institutions. As governments seek to encourage the internationalisation of higher education, they have revised performance agreements with domestic institutions, for example by taking into account inflows of international students in university funding formulas. In Finland, for example, the internationalisation of higher education is one of the dimensions considered for the funding of tertiary institutions, along with quality and impact measures (Eurydice, 2020[4]). Similarly, in Estonia and Norway, the share of foreign or international students is an indicator used to determine the level of block grant funding allocated to tertiary institutions (OECD, 2019[5]).
Most countries have implemented reforms aiming to lower the barriers to migration of highly skilled individuals, beyond the purposes of education, and most countries operate funding programmes to support inward, outward or return mobility. While the conditions of migration differ (e.g. short-term versus long-term settlement), the most common target for these programmes are pre-doctoral students and early-stage researchers (both doctoral and postdoctoral). Although setting appropriate tuition fees remains one of the most debated topics in education policy, setting higher fees for international students is less politically controversial and often constitutes an important revenue stream for higher educational institutions. In some countries, international students in public universities pay twice as much for tuition as national students, attracted by the perceived quality of the education and potential labour-market prospects in their host country. In contrast, some countries may seek to promote international mobility within a region by reducing or eliminating fees. Students from the European Economic Area can study in any other country within this area, paying the same tuition fees as national students (see Indicator C5).
By level of studies
Students are more likely to travel abroad for more advanced education programmes. In all but a few countries, the share of international students enrolled in tertiary programmes increases gradually with education level. In total across OECD countries, international students account for 6% of total enrolment in tertiary programmes. International enrolment in bachelor’s or equivalent programmes remains relatively low (under 5% in nearly half of the countries for which data are available). However, a few countries have a more international profile at this level. In Australia, Austria, Canada, Luxembourg, New Zealand, Switzerland and the United Kingdom, 15% or more of students at bachelor’s level are international (Figure B6.2).
International enrolment increases significantly at master’s or equivalent level. In total across the OECD, 14% of students are international or foreign at this level. The proportion of incoming students at least doubles between bachelor’s and master’s levels in nearly two-thirds of OECD countries and in Brazil, Chile, Spain and Sweden the share is at least four times higher than at bachelor’s level. Greece is the only country where the inflow of foreign students at master’s level is slightly lower than at bachelor’s level (Figure B6.2).
At doctoral or equivalent level, international students represent 22% of enrolled students. The countries with the highest shares are Luxembourg, New Zealand, Switzerland and the United Kingdom, which all have 40% or more of their doctoral students coming from abroad. In Luxembourg and Switzerland, there are more international students in doctoral programmes than national students (87% in Luxembourg and 56% in Switzerland). While most countries have higher shares of international students at doctoral level than at master’s level, a number of countries show the opposite pattern: this is particularly striking in Australia, Germany, Latvia, Lithuania and Poland (Figure B6.2).
Most countries are net “importers” of students; that is, they have more students coming into the country to study than those leaving to study abroad. In total across OECD countries in 2019, there were three international students for each national student studying abroad, but this ratio equals or exceeds ten in Argentina, Australia, New Zealand, the United Kingdom and the United States. In contrast, a number of countries are net “exporters” of students; that is, more students travel abroad to study than those coming in to study. Colombia and Luxembourg are among the OECD countries with the lowest ratios of international or foreign students to national students abroad. Among partner countries, the People’s Republic of China (hereafter “China”) and India, who together are responsible for more than 30% of the pool of international students, are also net exporters of talent (Table B6.1).
International student mobility has been expanding quite consistently in the past 20 years. In 2019, 6.1 million tertiary students worldwide had crossed a border to study, more than twice the number in 2007. The number of international and foreign tertiary students grew on average by 5.5% per year between 1998 and 2019. Even though OECD countries welcome the great majority of international and foreign students, the number of foreign students enrolled in non-OECD countries has been rising faster: their numbers have grown by 7% per year on average, compared to 4.9% for international and foreign students in OECD countries. In 2019, foreign students enrolled in non-OECD countries represented about 31% of the global pool of internationally mobile students, compared to 23% in 1998 (Figure B6.3).
Despite strong increases in the total number of international and foreign students worldwide, their share among all tertiary students increased by 3 percentage points between 2014 and 2019 in total across OECD countries. While their share increased in most OECD countries over this period, there are striking differences across countries: the share of international or foreign students increased by 6 percentage points or more in Australia, Canada and Estonia between 2014 and 2019, while it declined by 1 percentage point in Belgium, France and Greece (Table B6.1).
By country of destination and origin
The pools and flows of mobile talent remain very concentrated worldwide, and mobility pathways are deeply rooted in historical patterns. Identifying the determinants of international student mobility is key to designing efficient policies to encourage the movement of skilled labour. Student migration is mainly driven by differentials in education capacity (a lack of educational facilities in the country of origin or the prestige of educational institutions in the country of destination). It is also driven by differences in the returns to or rewards for education and skills in the origin and destination countries (see Indicators A3 and A4). Economic factors include better economic performance in the host country, exchange rates, more affordable mobility (due to lower tuition fees or higher education subsidies, for instance) and higher quality education in the host country. In addition, the decision to study abroad may be determined by non-economic factors, such as political stability or cultural and religious similarities between the origin and destination countries (Guha, 1977[6]; UNESCO Office Bangkok and Regional Bureau for Education in Asia and the Pacific, 2013[7]; Weisser, 2016[8]).
English is the lingua franca of the globalised world, with one in four people using it worldwide (Sharifian, 2013[9]). Not surprisingly, English-speaking countries are the most attractive student destinations overall, with four countries receiving more than 35% of all internationally mobile students in OECD and partner countries. The United States is the top OECD destination country for international tertiary students. Of the 4.1 million internationally mobile students in OECD countries, 977 000 are enrolled in the United States. Among the English-speaking countries, after the United States, Australia accounts for 509 000 international students, the United Kingdom for 489 000 and Canada 279 000. As a destination country, the United States alone accounts for 16% of the global education market share, i.e. 16% of all international students in the world enrolled in the United States, while Australia and the United Kingdom each have 8% of the global market share (Table B6.1).
The largest flow of international students is from developing countries: 67% of all international students in the OECD area come from developing countries, of which 3% from LICs, 26% from LMICs and 38% from UMICs (see Definitions section). This share ranges from 20% or less in Belgium, Denmark, Greece and the Netherlands to over 90% in Korea, Turkey and, among partner countries, the Russian Federation and Saudi Arabia. The Russian Federation, Saudi Arabia and Turkey, together with Brazil, India and South Africa, are also among the countries with the highest share of students from LICs (more than 10%). In India, Latvia, Poland and South Africa, at least 50% of international or foreign students come from LMICs and Argentina, Chile, Colombia, Japan, Korea, Portugal and the Russian Federation have at least 50% of international or foreign students from UMICs (Figure B6.1).
International mobility patterns demonstrate the importance of proximity: Asian and Latin American countries have the highest shares of students from LICs and LMICs that are in the same region. In addition, in Austria, Colombia, Greece, Indonesia, Korea, Luxembourg and the Slovak Republic, more than 55% of international or mobile students in 2019 came from neighbouring countries (Table B6.1).
In terms of regions of origin, students from Asia form the largest group of international students enrolled in tertiary education programmes at all levels, totalling 58% of all mobile students across the OECD in 2019. In total, over 30% of mobile students in OECD countries come from China and India. More than two-thirds of Chinese and Indian students are concentrated in only five countries: Australia, Canada, Japan, the United Kingdom and the United States. Europe is the next largest region of origin, with European international students making up 21% of all mobile students enrolled in OECD countries. European students prefer to stay in Europe, accounting for over 40% of mobile students enrolled in the EU22 countries (Table B6.3, available on line).
Profile of internationally mobile students
By field of study
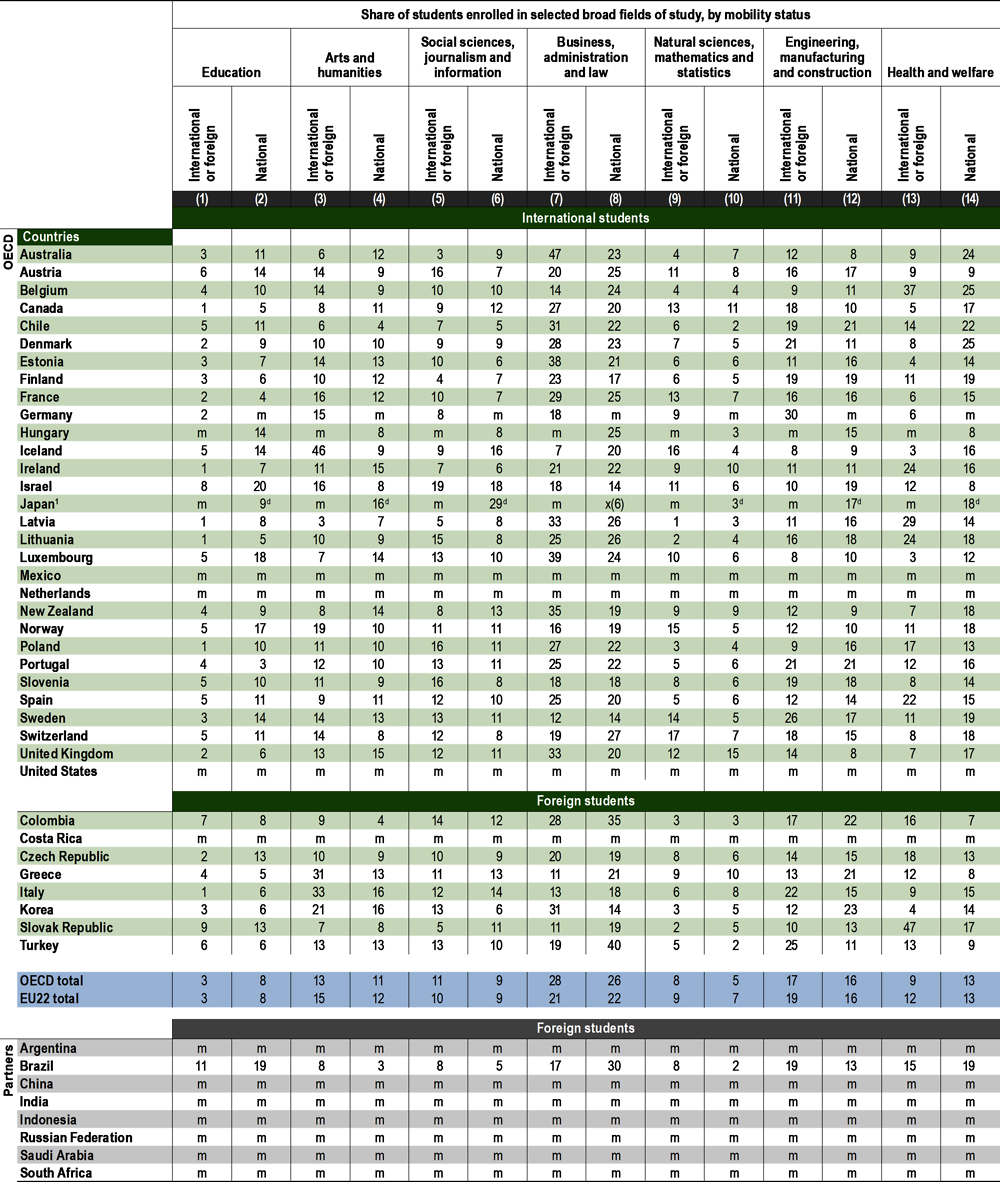
Fields of study are a key consideration for students choosing to pursue a tertiary degree abroad. Some countries devote more resources to research in certain fields and therefore benefit from strong international recognition, particularly at higher levels of tertiary education. In total across OECD countries, the distribution of fields among mobile students mirrors the distribution among national students, as in both cases the largest share entering the broad field of business, administration and law, followed by engineering, manufacturing and construction. However, there are also notable exceptions. The field of education attracts only 3% of mobile students, compared to 8% of national students and the field of health and welfare attracs 9% of mobile students compared to 13% of national students. In contrast, internationally mobile students are more likely to enrol in the broad field of natural sciences, mathematics and statistics than national students in total across the OECD (8% of mobile students and 5% of national students) (Table B6.2).
There are also striking differences between countries, highlighting potential specialisations and the attractiveness in some countries for a given field of study. Nearly half of foreign students in the Slovak Republic entered a health and welfare programme, almost three times more than the share of national students. In Denmark and Turkey, the share of international or foreign students entering engineering, manufacturing or construction is at least 10 percentage points higher than the share among national students (Table B6.2).
While women outnumber men among entrants and graduates from tertiary education, they are about as likely as men to enrol abroad in the field of social sciences, journalism and information. However, they are less likely to do so in the field of engineering, manufacturing and construction (29% of international students are women) and more likely in the fields of arts and humanities (share of women 62%) and health and welfare (63%) (Figure B6.4).
Among the fields that are most popular among internationally mobile female students, the share of women among mobile students in the field of health and welfare ranges from 51% in Japan and Lithuania to 74% in Iceland. Similarly, the share of women among internationally mobile students in the fields of arts and humanities ranges from less than 50% in Chile, Colombia, Turkey and, among partner countries, Brazil, to 75% in Lithuania. In contrast, engineering, manufacturing and construction is less popular among internationally mobile female students: their share in this field ranges from 10% in Latvia to 44% in Slovenia (Figure B6.4).
Foreign students are those who are not citizens of the country in which they are enrolled and where the data are collected. Although they are counted as internationally mobile, they may be long-term residents or even be born in the “host” country. While pragmatic and operational, this classification may be inappropriate for capturing student mobility because of differing national policies regarding the naturalisation of immigrants. For instance, Australia has a greater propensity than Switzerland to grant permanent residence to its immigrant populations. This implies that even when the proportion of foreign students in tertiary enrolment is similar for both countries, the proportion of international students in tertiary education will be smaller in Switzerland than in Australia. Therefore, for student mobility and bilateral comparisons, interpretations of data based on the concept of foreign students should be made with caution. In general, international students are a subset of foreign students.
International students are those who left their country of origin and moved to another country for the purpose of study. The country of origin of a tertiary student is defined according to the criterion of “country of upper secondary education”, “country of prior education” or “country of usual residence” (see below). Depending on country-specific immigration legislation, mobility arrangements (such as the free mobility of individuals within the European Union and the European Economic Area) and data availability, international students may be defined as students who are not permanent or usual residents of their country of study, or alternatively as students who obtained their prior education in a different country.
Mobile students are students who are either international or foreign.
National students are students who are not internationally mobile. Their number is computed as the difference between the total number of students in each destination country and the number of international or foreign students.
The country of prior education is the country in which students obtained their upper secondary qualification (upper secondary or post-secondary non-tertiary completion with access to tertiary education programmes) or the qualification required to enrol in their current level of education. Where countries are unable to operationalise this definition, it is recommended that they use the country of usual or permanent residence to determine the country of origin. Where this too is not possible and no other suitable measure exists, the country of citizenship may be used.
Permanent or usual residence in the reporting country is defined according to national legislation. In practice, this means holding a student visa or permit, or electing a foreign country of domicile in the year prior to entering the education system of the country reporting the data.
Developing countries include low- and middle-income countries, as defined by the World Bank. The World Bank assigns the world’s economies to four income groups – low-income countries, lower middle-income countries, upper middle-income countries and high-income countries. The classifications are updated each year on 1 July and are based on gross national income per capita in current USD of the previous year.
Country-specific operational definitions of international students are indicated in the tables as well as in Annex 3 (https://www.oecd.org/education/education-at-a-glance/EAG2021_Annex3_ChapterB.pdf).
Defining and identifying mobile students, as well as their types of learning mobility, are a key challenge for developing international education statistics, since current international and national statistical systems only report domestic educational activities undertaken within national boundaries (OECD, 2018[10]).
Data on international and foreign students are therefore obtained from enrolments in their countries of destination. This is the same method used for collecting data on total enrolments, i.e. records of regularly enrolled students in an education programme. Students enrolled in countries that did not report to the OECD or to the UNESCO Institute for Statistics are not included and, for their countries of origin, the total number of national students enrolled abroad may be underestimated.
The total number of students enrolled abroad refers to the count of international students, unless data are not available, in which case the count of foreign students is used instead. Enrolment numbers are computed using a snapshot method, i.e. counting enrolled students at a specific day or period of the year.
This methodology has some limits. OECD international statistics on education tend to overlook the impact of distance and e-learning, especially fast-developing massively online open courses, students who commute from one country to another on a daily basis, and short-term exchange programmes that take place within an academic year and are therefore under the radar. Other concerns arise from the classification of students enrolled in foreign campuses and European schools in host countries’ student cohorts.
Current data for international students can only help track student flows involving OECD and partner countries as receiving countries. It is not possible to assess extra-OECD flows and, in particular, the contributions of South-South exchanges to global brain circulation.
For more information, please see the OECD Handbook for Internationally Comparative Education Statistics 2018 (OECD, 2018[10]) and Annex 3 for country-specific notes (https://www.oecd.org/education/education-at-a-glance/EAG2021_Annex3_ChapterB.pdf).
Data refer to the 2018/19 academic year and are based on the UNESCO-UIS/OECD/Eurostat data collection on education statistics administered by the OECD in 2019 (for details, see Annex 3 at: https://www.oecd.org/education/education-at-a-glance/EAG2021_Annex3_ChapterB.pdf).
The UNESCO Institute of Statistics (UIS) provided data 1) for Argentina, China, India, Indonesia, Saudi Arabia and South Africa; 2) for all countries beyond the OECD and partner countries; and 3) for OECD countries for the period not covered by OECD statistics (2005 and 2010-18).
References
[3] Abbott, A. and M. Silles (2016), “Determinants of international student migration”, World Economy, Vol. 39/5, pp. 621-635, https://doi.org/10.1111/twec.12319.
[2] Bhandari, R., C. Robles and C. Farrugia (2020), International Higher Education: Shifting Mobilities, Policy Challenges, and New Initiatives, United Nations Educational, Scientific and Cultural Organization, Global Education Monitoring Report, https://www.gcedclearinghouse.org/sites/default/files/resources/190415eng_0.pdf (accessed on 7 June 2021).
[4] Eurydice (2020), Higher Education Funding, Eurydice, Brussels, https://eacea.ec.europa.eu/national-policies/eurydice/content/higher-education-funding-25_en (accessed on 8 June 2021).
[6] Guha, A. (1977), “Brain drain issue and indicators on brain-drain”, International Migration, Vol. 15/1, pp. 3-20, https://doi.org/10.1111/j.1468-2435.1977.tb00953.x.
[1] OECD (2021), The state of higher education: One year in to the COVID-19 pandemic, OECD Publishing Paris, https://doi.org/10.1787/83c41957-en.
[5] OECD (2019), Benchmarking Higher Education System Performance, Higher Education, OECD Publishing, Paris, https://dx.doi.org/10.1787/be5514d7-en.
[10] OECD (2018), OECD Handbook for Internationally Comparative Education Statistics 2018: Concepts, Standards, Definitions and Classifications, OECD Publishing, Paris, https://doi.org/10.1787/9789264304444-en.
[9] Sharifian, F. (2013), “Globalisation and developing metacultural competence in learning English as an international language”, Multilingual Education, Vol. 7/3, https://doi.org/10.1186/2191-5059-3-7.
[7] UNESCO Office Bangkok and Regional Bureau for Education in Asia and the Pacific (2013), The International Mobility of Students in Asia and the Pacific, United Nations Educational, Scientific and Cultural Organization, Paris and UNESCO Bangkok, https://unesdoc.unesco.org/ark:/48223/pf0000226219 (accessed on 7 June 2021).
[8] Weisser, R. (2016), “Internationally mobile students and their post-graduation migratory behaviour: An analysis of determinants of student mobility and retention rates in the EU”, OECD Social, Employment and Migration Working Papers, No. 186, OECD Publishing, Paris, https://dx.doi.org/10.1787/5jlwxbvmb5zt-en.
Cut-off date for the data: 17 June 2021. Any updates on data can be found on line at: https://doi.org/10.1787/eag-data-en. More breakdowns can also be found at: http://stats.oecd.org/, Education at a Glance Database.
Table B6.1. International and foreign student mobility in tertiary education (2010, 2014 and 2019) |
|---|
International or foreign student enrolment as a percentage of total tertiary enrolment |
 |
1. Data on short-cycle tertiary programmes are based on nationality and refer to the Flemish community only. |
Source: OECD/UIS/Eurostat (2021). See Source section for more information and Annex 3 for notes (https://www.oecd.org/education/education-at-a-glance/EAG2021_Annex3_ChapterB.pdf). Please refer to the Reader's Guide for information concerning symbols for missing data and abbreviations. |
Table B6.2. Distribution of tertiary students enrolled by broad fields of study, by mobility status (2019) |
|---|
All tertiary programmes |
 |
1. Data on information and communication technologies (not presented in this table and available at stats.oecd.org) are included in other fields. Data on Business, administration and law are included with Social sciences, journalism and information. |
Source: OECD/UIS/Eurostat (2021). See Source section for more information and Annex 3 for notes (https://www.oecd.org/education/education-at-a-glance/EAG2021_Annex3_ChapterB.pdf). Please refer to the Reader's Guide for information concerning symbols for missing data and abbreviations. |