
1. An overview of diversity, equity and inclusion in the Portuguese education system
This chapter provides an overview of the main elements of the Portuguese education system in relation to diversity, equity and inclusion. The chapter first depicts the structure of the education system and the organisation of the school offering, highlighting core features for equity and inclusion. It then proceeds to analyse trends in the performance of students in Portugal over the last decade, as well as the challenges faced and improvements made by the Portuguese education system. In conclusion, the chapter analyses the characteristics, outcomes and challenges of some diverse student groups relevant to the Portuguese context, namely students with an immigrant background, Roma students and students with special education needs.
Since the 1986 Education Act, the Portuguese education system has been organised in three subsequent levels:
1. Pre-primary education (educação pré-escolar) - level 02 of the International Standard Classification of Education (ISCED) - for children aged 3 to 6. It is offered in either public, private government-dependent or private independent schools. Private pre-primary schools often offer both early childhood care (children aged 0 to 3) and pre-primary education.
2. Basic education (ensino básico) - Compulsory education starts at the age of 6, when children enrol in basic education (ISCED 1-2). Basic compulsory education is organised in three study cycles, with varying lengths. The first cycle – elsewhere called primary education – comprises the first four years of ISCED 1 under the responsibility of a single teacher. The second cycle lasts for two years and is organised in curriculum areas under the responsibility of one teacher per subject/curriculum area (e.g. a natural sciences teacher can also teach mathematics). The third cycle of basic education is comparable to lower secondary education (ISCED 2) and lasts three years.
3. [Upper] Secondary education (ensino secundário) - After a common curriculum taught throughout the nine-year basic education, at the end of the third cycle, students (typically aged 15) transition to secondary education, corresponding to ISCED Level 3 (i.e. upper secondary education). It comprises three years of schooling, and students can choose between different education and training offerings, which mainly include four different general courses and 239 vocational courses.
In the context of curricular flexibility, two teachers can cooperate to teach a cross-curricular subject throughout compulsory schooling. Figure 1.1 provides an overview of the Portuguese education system up to ISCED 3, highlighting the different paths that can be undertaken from ISCED 2 (OECD, 2020[1]).
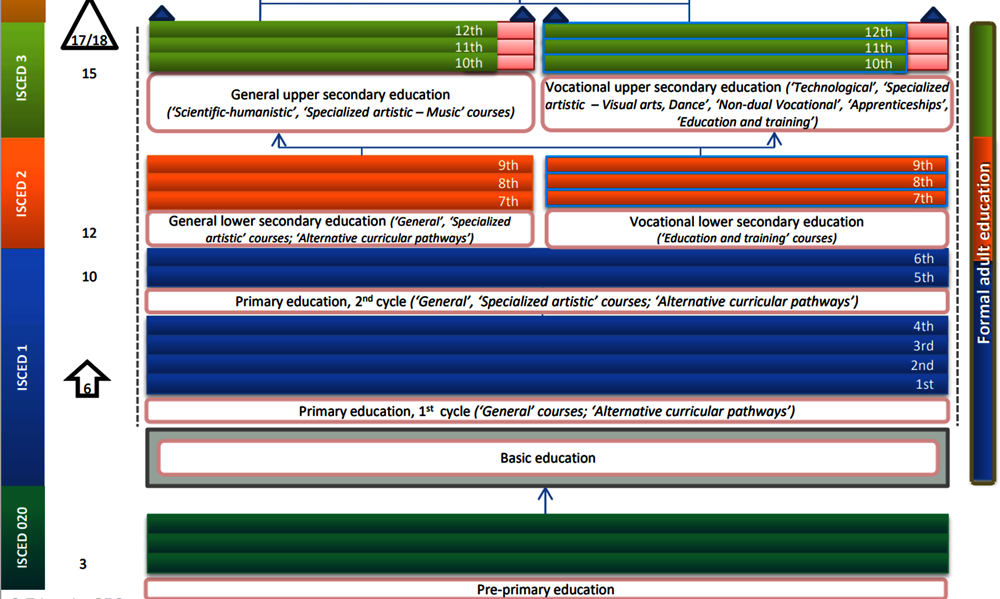
Note: For further information about the structure and the different paths between grades and programmes, please consult the OECD Education GPS (https://gpseducation.oecd.org/CountryProfile?primaryCountry=PRT).
Source: Adapted from OECD (2020[1]), “Portugal: Overview of the Education System”, OECD Education GPS, http://gpseducation.oecd.org/Content/MapOfEducationSystem/PRT/PRT_2011_EN.pdf (accessed on 01 September 2021).
Since the Law No. 25/2009, 27 August1, formal schooling in Portugal is compulsory for students between 6 and 18-years-old or until the completion of upper secondary education if students complete their studies before the age of 18. The law also guarantees universal pre-school education for children above five years of age. In 2018, at least 90% of the population aged between 4 and 17-years-old was enrolled in education (from pre-primary to upper secondary) in Portugal (see Table 1.1). In 2010, at least 90% of the population aged between 5 and 16-years-old was enrolled in education, meaning that Portugal managed to expand student participation to match the OECD average. The 2020 OECD Education at a Glance Report (OECD, 2020[2]) notes that in ten out of the 23 OECD countries with data available, the age range for enrolment was longer in 2018 than in 2010, and that Portugal recorded one of the largest increases along with Belgium, Korea and Norway. About 100% of the population aged from 6 to 14 years-old and 90% of the population from 15 to 19 years-old was enrolled in education in 2019. This rate significantly drops to 38% for the population from 20 to 24 years-old (OECD, 2021[3]).
As mentioned above, upper secondary education offers scientific and humanistic, artistic and vocational pathways. More than half of 15 year-old or older students enrol in scientific or humanities courses (59% in 2019/2020), selecting one of four curricular areas: Sciences and Technologies, Social and Economic Sciences, Languages and Humanities or Visual Arts2. While the sciences-humanities strand is geared towards further studies at the tertiary level, other pathways offer vocationally-oriented courses. Professional programmes (cursos profissionais), apprenticeship programmes (cursos de aprendizagem), specialised artistic courses (cursos artísticos especializados), and education and training courses (cursos de educação e formação, CEF) are traditionally geared towards integration in the labour market. They comprise part of the vocational education and training (VET) sector in Portugal, which enrols about 41% of students in secondary education.
Less than 1% of secondary students follow courses with special/specific syllabi in private schools (cursos com planos própios). Students enrolled in these courses follow a curriculum that combines sciences-humanities and vocational courses and they obtain a double certification. As a result of recent legislation on exams and certification, students enrolled in some VET courses can more easily prepare for and access higher education. Decree Law No. 11/2020, of 2 April, created special conditions for admission to higher education for students holding dual certification. It recognises the curricular specificities of these secondary qualification pathways, creating their own differentiated access regime, with specific selection and ranking criteria.
Furthermore, a small portion of students (8%) attend basic education under specific programmes other than the regular curricular pathway, suited to their profiles. These include basic level specialised artistic courses, CEF courses, education and training integrated programmes (programas integrados de educação e formação, PIEF), alternative curricular pathways (precursos curriculares alternativos) and pre-vocational courses, adapted to struggling students’ specific needs and interests.
Table 1.2 provides an overview of student distribution by type of educational offer. This table, as well as the other tables and figures in this report, focus exclusively on Portugal Mainland and do not include data from the insular territory of the Country, also known as Autonomous Regions of Portugal (Regiões Autónomas de Portugal), specifically the Azores (Região Autónoma dos Açores) and Madeira (Região Autónoma da Madeira).
In Portugal, basic and secondary education also provide a wide array of courses for adult qualification and potential early school leavers. Second-chance educational programmes for adults generally aim at providing individuals with relevant qualifications for the labour market. The certification of skills acquired outside of the formal education system fall under the umbrella of the Qualifica Programme. The Programme’s main objective is to improve the levels of education and training of adults, contributing to improving the qualification levels of the population and employability. The Programme involves a wide network of operators, including the Qualifica Centres (Centros Qualifica) that assume a central role as specialised centres in adult qualification (Ministry of Education, 2022[5]).
To complete general secondary education, students in Portugal must take national examinations. National examinations are standardised tests undertaken by every student during the relevant school year. The students take the examinations in the subjects corresponding to their strand of studies, typically completing two in 11th grade and another two in 12th grade (end of upper secondary). Examinations are a formal requirement for graduation from secondary education and the students’ results may be used to grant admission to tertiary education. Factors that are considered to place tertiary education student candidates are slot availability, student demand and student candidacy grade. Student placement is managed centrally by the government. The candidacy grade depends on the final graduation grade and scores in the final examinations. Final graduation grades in each subject are computed as the weighted average of the school grade and the grade at the national exam for that subject (with weights of 70% and 30%, respectively). The quantitative candidacy grade is then assigned a weight by the tertiary educational institution and the department to which the student applies. The candidacy grade must weigh a minimum of 50% in the admission decision. Each tertiary education institution can set the weight of the national examination scores within a band of 35% to 50% of the total score for admission (Liebowitz et al., 2018[6]).
In addition to upper secondary examinations, there are national examinations in Portuguese and mathematics at the end of basic education (9th grade). National low-stakes assessments in basic education (provas de aferição) are also carried out in the middle of each education cycle (2nd, 5th and 8th grades). In contrast to earlier student assessment methods that focused on measuring the individual performance of students and schools, these tests are mainly used for an overall assessment of the education system. They are also provided to teachers to inform them of the achievement of their students. Reports provided to families are qualitative in nature, describing students’ skills without reporting a score to students or families, though scores are computed and averaged at the school level. Central level authorities then analyse school-level scores to generate a report on the ability of each school to provide quality education (Liebowitz et al., 2018[6]).
The school offer in Portugal is guaranteed by both public and private providers. Public schools are grouped into clusters, although 2% remain ungrouped. Each cluster consists of multiple education levels and shares one leadership team. The school leader leads each team with coordinators and deputy principals assisting the administration of the school cluster. Cluster sizes vary, ranging from two to 28 schools, but usually consist of four to seven schools. In 2020 in Portugal, the public school network was made of 5 378 schools; 5 283 of them were grouped in 713 school clusters, the remaining 95 schools being non-clustered schools. Clusters were introduced in 2005 as part of measures to consolidate schools, with the rationale of increasing the efficiency and capacity for pedagogy, for transitions between education levels and communication between leadership and schools.
About 80% of students in Portugal attend public schools (Table 1.3). However, the rates are much higher for primary and secondary schools than pre-primary schools. For example, 91% of children aged 0 to 3 attend pre-primary schools, but fewer than half of these students attend a public school (OECD, 2020[2]). During the 2019/2020 school year, 87% of primary students and 78% of secondary students were enrolled in the public school system. In contrast, nearly 53% of 3 to 5-year-olds attended a public pre-primary school, which remains significantly higher than the OECD average of 33% (Ibid.). Table 1.3 provides an overview of the number of students enrolled in education from ISCED 0 to ISCED 3 during the 2019/2020 school year. In Table 1.2 each school is counted as many times as the education levels it teaches. Many preschools also provide early childhood education and care for children aged 0-3 as part of programmes run by the Ministry of Labour, Solidarity and Social Security. Primary and secondary education is mainly the remit of the Ministry of Education (MoE), although Portugal has started a decentralisation process giving more responsibilities to municipalities, in particular in primary education (see Chapter 2).
Guidelines for enrolment of students in public primary schools are based on several factors. In general, students’ enrolment in a school depends on their legal address, meaning that students most often go to the school that is the nearest to their home. In some cases, parents can ask to enrol their child in another school, upon one or several of the conditions listed below. In an individual school, there can be a shortage of places available relative to the number of potential students. When this occurs, places are given based on the following criteria (in order of priority):
being identified with special education needs that can be met at that school
the student’s legal address, as confirmed by tax documents to prevent fraud
Using social support as a criterion for school placement was introduced in 2018. This measure is meant to increase socio-economic diversity in schools and provide more opportunities for students from a low socio-economic background (Liebowitz et al., 2018[6]).
In contrast, since private schools have autonomy in many areas, enrolment guidelines in private schools are not regulated or consistent. They are autonomous in setting their enrolment criteria, recruiting their staff and establishing more general quality standards for teachers and students. They may also independently determine their own selection criteria as long as anti-discriminatory laws are not violated. Private schools may be self-financed through tuition fees paid by students’ families, while others rely on government financing. The private government-funded schools are usually meant to increase the availability of places in rural areas where public schools may be lacking, welcome more students with special education needs or provide focused creative subjects. All private schools, both non-profit and for-profit, are regulated by laws and must follow national education orientations and curriculum documents. Furthermore, the Ministry of Labour, Solidarity and Social Security works with the MoE to oversee non-profit organisations that run early childhood education and care. Autonomous enrolment and selection criteria are particularly relevant in early childhood education and care, as over half of students aged 3-5 attend private schools (OECD, 2020[2]).
One of the challenges facing education systems in many countries, as in Portugal, is students disengaging and consequently dropping out of the education system, meaning that they leave school without an upper secondary qualification. These young people tend to face severe difficulties entering – and remaining in – the labour market. Leaving school early is a problem for both individuals and society. Graduating with excessive delays is another source of concern, raising the issue of a later entry into the labour market and hence delaying the time when they are typically able to start contributing financially to society (OECD, 2020[7]).
Early school leaving
Over the last few years, Portugal has made significant improvements with regard to early school leaving. Following the positive trend in the last ten years, the rate of early leavers3 from education and training keeps decreasing. It stood at 8.9% in 2021 (8.4% in Portugal Mainland), lower than in 2019 (10.6%) and slightly below the European Union (EU) average of 9.9% (DGEEC, 2021[8]). Nonetheless, rates vary significantly across regions (Figure 1.2). In 2019, the Algarve had the highest rate of early school leavers (19.9%) in the continental territory of Portugal and was the only region where the rate of early school leavers is higher than in 2016 (16.9%). Alentejo comes second with 12.7% of early leavers the same year, followed by the Metropolitan Area of Lisbon (10.4%), the North (9.5%) and the Centre (7.9%).

Note: Early leaver from education and training, previously named early school leaver, refers to a person aged 18 to 24 who has completed at most lower secondary education and is not involved in further education or training; the indicator ”early leavers from education and training” is expressed as a percentage of the people aged 18 to 24 with such criteria out of the total population aged 18 to 24.
Source: National Institute of Statistics (INE) (2021[9]), Taxa de abandono precoce de educação e formação [Early leaving in education and training]https://www.ine.pt/xportal/xmain?xpid=INE&xpgid=ine_indicadores&userLoadSave=Load&userTableOrder=10850&tipoSeleccao=0&contexto=pq&selTab=tab1&submitLoad=true (accessed on 02 November 2021).
Portugal has also shown advancements in other areas related to the progression of students in schools. The student grade repetition and dropout rate4, which indicates the percentage of students who, at the end of a given school year, did not progress to the next school level, decreased considerably over the past two decades, both in primary and secondary education (See Figure 1.3). Between 2005 and 2020, this rate decreased by more than five times in basic education and by 3.8% in secondary. In 2020, the grade repetition and dropout rate reached 2.2% in basic education and 8.4% in secondary. In other words, 97.8% of students enrolled in basic education and 91.6% of students enrolled in secondary education continued to the next grade.
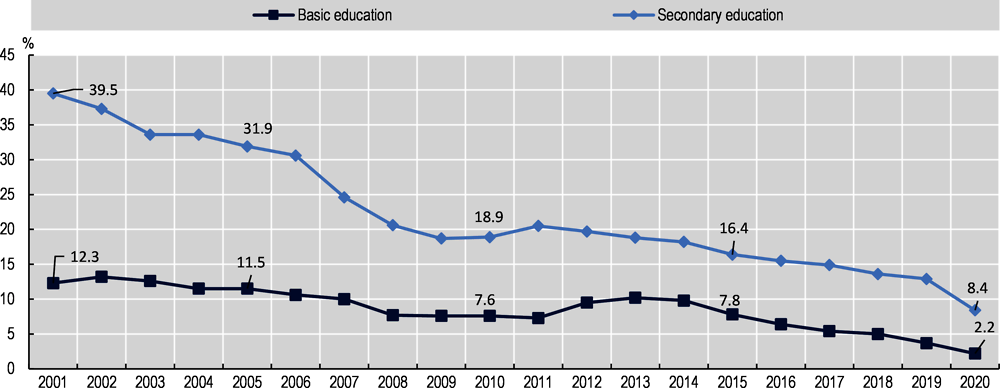
Source: DGEEC (2020[10]), Transition/attainment rates and retention/dropout rates – Mainland, https://www.dgeec.mec.pt/np4/96/ (accessed on 18 August 2021).
Nonetheless, there are significant regional variations also in this area. The Directorate-General for Education and Science Statistics (Direção-Geral de Estatísticas da Educação e Ciência, DGEEC) (2020[11]) estimates that at the end of the 2019/2020 school year, the grade repetition and dropout rate in basic education was 2.2%, with the highest value at the end of the 3rd cycle (3%) compared to the 2nd cycle (2.4%) and to the 1st cycle (1.4%). For all cycles, rates were the highest in Alentejo (3.3%), followed by the Algarve (3.2%), Lisbon Metropolitan Area (3.1%), the Centre (1.7%) and the North (1.2%). The same pattern as in basic education is found in secondary, where the grade repetition and dropout rate reached 8% in sciences-humanities courses and 8.9% in professional courses in 2019/2020. The highest rate was in Lisbon (11.1% and 11.4%), followed by the Algarve (9.9% and 13.5%) and Alentejo (8.2% and 7.8%). For all cycles, rates were the highest in Alentejo (3.3%), followed by the Algarve (3.2%), Lisbon Metropolitan Area (3.1%), the Centre (1.7%) and the North (1.2%). The same pattern as in basic education is found in secondary, where the grade repetition and dropout rate reached 8% in sciences-humanities courses and 8.9% technologic and professional paths in 2019/2020. The highest rate was in Lisbon Metropolitan Area (11.1% and 11.4%), followed by the Algarve (9.9% and 13.5%) and Alentejo (8.2% and 7.8%).
Furthermore, substantial differences exist between public and private schools. During the 2018/2019 school year, grade repetition and dropout rates varied between 0.5% and 1% across the different regions in private basic schools (with the exception of the Centre, at 1.8%) and between 2.6% and 5.9% in public basic schools. In private secondary schools, they varied between 6.7% and 10.3% in private schools, while in public secondary schools they ranged between 11.8% and 18%.
Grade repetition
Available studies also show improvements in the area of grade repetition. For example, grade repetition rates decreased in all grades of basic education between 2014 and 2018 (Verdasca and al., 2019[12]). On average, in primary schools that implemented a Strategic Action Plan (Plano de Ação Estratégica - PEA) as part of the National Programme for the Promotion of School Success (Programa Nacional de Promoção do Sucesso Escolar, PNPSE, see Chapter 2), the grade repetition rate overall decreased by 29% between 2014 and 2018 (Verdasca and al., 2019[12]). Nonetheless, grade repetition is a major concern in Portugal. During the 2017/2018 school year, a significant number of students from the second grade (7%) of primary education repeated a grade. Slightly fewer students did so in fifth grade (6%), while only 2% repeated fourth grade (European Commission, 2019[13]). The rate of students who repeat a grade significantly increases when taking into account primary and secondary education. The OECD Programme for International Student Assessment (PISA) 2018 shows that 26.6% of students in Portugal reported having repeated a grade at least once in either primary or secondary education, which places the country considerably above the OECD average of 11% (Figure 1.4).
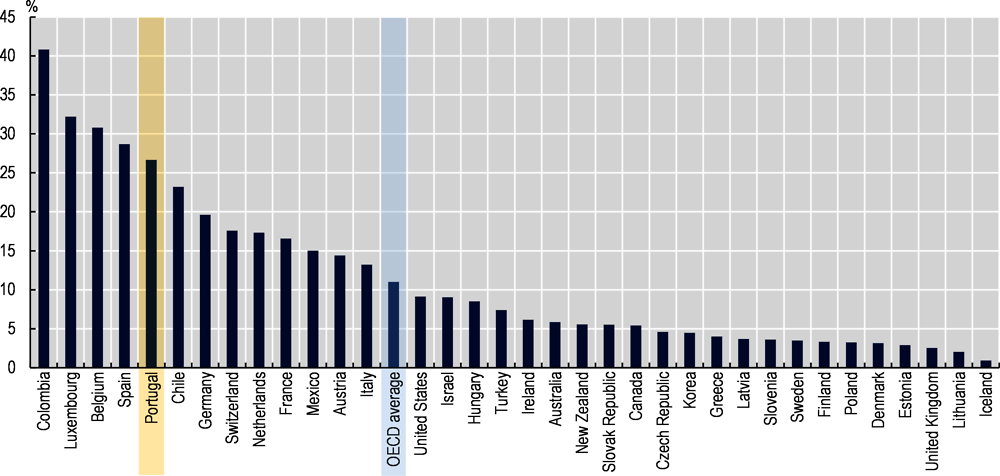
Note: Data for Japan and Norway is missing for this indicator.
Source: OECD (2020[14]), PISA 2018 Results (Volume V): Effective Policies, Successful Schools, Figure V.2.5, https://doi.org/10.1787/ca768d40-en.
In its most recent report, the National Council of Education (Conselho Nacional da Educação, CNE) noted that because of high grade repetition rates, a growing number of students are older than the expected school age at each level. Students tend to accumulate multiple repetitions (CNE, 2019[15]). Data from PISA 2018 also show that Portugal has one of the highest shares of students in a grade below the modal grade (31.8%) among OECD countries. There is limited evidence on the long-term impact of grade repetition, but students who have repeated a grade, besides tending to have lower academic outcomes, are more likely to have negative attitudes toward schools and leave school early (OECD, 2020[14]).
Student well-being
Student well-being refers to the psychological, cognitive, material, social and physical functioning and capabilities that students need to live a happy and fulfilling life (OECD, 2017[16]). Well-being is intimately linked to students’ individual abilities, such as social and emotional skills (see Box 1.1), and academic success. Key indicators of student well-being included in PISA 2018 are students’ sense of belonging, life satisfaction, self-efficacy and growth mindset. Overall, Portugal tends to score above the OECD average for most measures of well-being in PISA 2018. However, there is variation between student groups, in particular between girls and boys and advantaged and disadvantaged students.
Importance of social and emotional skills
To promote student well-being, developing social and emotional skills is key. They can be defined as “a subset of an individual’s abilities, attributes and characteristics important for individual success and social functioning” (OECD, 2021, p. 9[17]). Social and emotional skills are essential for many reasons, including cognitive development, academic outcomes, mental health, well-being and labour market preparedness. In addition, they shape behaviours and attitudes that influence life-long outcomes. As a result, various countries, such as Portugal, have increasingly focused on developing these skills by formally integrating them into the curriculum or informally promoting them in the classroom.
Sintra’s initiatives to promote social and emotional skills
The municipality of Sintra has promoted social and emotional skills through local community-based activities. One such measure, School Theatre Exhibitions, is regularly organised to encourage skills such as cooperation, creativity, emotional control, tolerance, trust and stress resistance. Sintra also offers primary and lower secondary students the opportunity to participate in Orchestra Projects that support cooperation, collaborative learning, responsibility, achievement motivation, self-efficacy and persistence. In addition to strengthening the holistic development of students, the Orchestra Projects also promote relationships between schools and the community that can support social inclusion through culture and arts.
The Survey
The OECD recently published results from the Survey on Social and Emotional Skills (SSES). The most extensive international survey ever conducted on the topic asked students, parents, teachers and school leaders about students’ social and emotional skills. Data was gathered from 10-year-old and 15-year-old students in 2019 from ten different cities, including Sintra, Portugal.
The 17 indicators used to measure social and emotional skills fall under the five categories of open-mindedness, task performance, engaging with others, collaboration and emotional regulation. In particular, the survey aimed to look at how social and emotional skills might vary dependent on factors including gender, socio-economic status and age. The survey also evaluated the relationships between social and emotional skills and academic and well-being outcomes. Unfortunately, the response rate for Sintra did not meet the technical requirement of the study to make reliable comparisons to other cities. However, the results can still shed some light on areas of interest.
Among other elements, the results showed that students from higher socio-economic backgrounds had better social and emotional skills than students from lower socio-economic backgrounds in Sintra. While the results do not explain the relationship's cause, it is worth noting that every student has diverse and individual needs and experiences. The study also finds a strong relationship between students’ psychological well-being and social and emotional skills, holding gender and socio-economic status constant. While psychological well-being and life satisfaction decreased from age 10 to age 15, the drop is more prominent for girls than boys. Furthermore, life satisfaction was lower for 10-year-old students with an immigrant background than other 10-year-olds in Sintra.
The survey also examined social relations by asking students about bullying. When compared to girls, boys reported experiencing more bullying than girls, a nine-percentage point difference for 10-year-olds. This supports earlier studies that show boys are more likely to have physical conflicts with other students. However, reports of bullying decreased significantly from 10 to 15-year-old students. Additionally, the gender gap in bullying disappeared for 15-year-olds.
More broadly, the survey results show variations in social and emotional skills according to students’ backgrounds and personal characteristics. This information can help target students who may need additional support. Thus, continued data collection using the SSES indicators can help guide future educational policies in Sintra and Portugal.
Source: OECD (2021[17]), Beyond Academic Learning: First Results from the Survey of Social and Emotional Skills, https://dx.doi.org/10.1787/92a11084-en.
PISA 2018 asked students whether they agree - on a scale from “strongly disagree” to “strongly agree” - with different statements about their school. In Portugal, students reported over the OECD average for most of these statements (see Figure 1.5). In particular, Portugal was above the OECD average with respect to the percentage of students who agreed that they make friends easily at school (76% vs. 75% on average across the OECD), that they feel like they belong at school (80% vs. 71%); and other students seem to like them (89% vs. 81%). Portugal was also above the OECD average in terms of students who disagreed with the statements related to feeling like outsiders (87% vs. 80%) and feeling lonely at school (90% vs. 84%). The country was slightly below the OECD average in terms of students who disagreed with the following: “I feel awkward and out of place in my school” (79% vs. 80%). However, there was a positive difference in the reported sense of belonging between students from advantaged and disadvantaged socio-economic backgrounds. This means that students from advantaged socio-economic backgrounds felt a higher sense of belonging than students from disadvantaged socio-economic backgrounds.

Source: Adapted from OECD (2019[18]), PISA 2018 Results (Volume III): What School Life Means for Students’ Lives, https://dx.doi.org/10.1787/acd78851-en.
Another relevant measure of students’ well-being is life satisfaction, which is widely used as a summary indicator of well-being in many countries (OECD, 2019[18]). In PISA 2018, Portugal was in line with the OECD average in terms of life satisfaction reported by 15-year-old students. However, when looking at life satisfaction reported by Portuguese students with different personal characteristics, there were a significant differences between advantaged and disadvantaged students and between girls and boys. Advantaged students and boys were more likely to report being satisfied with life compared to, respectively, disadvantaged students and girls. The difference in reported life satisfaction between students with an immigrant background and native students in Portugal was not significant.
Self-efficacy is also another important indicator of student well-being as it refers to the extent to which individual students believe in their own capability to carry out specific activities and tasks, particularly when they are under pressure or face challenges (OECD, 2019[18]). In PISA 2018, students were asked whether they agreed or disagreed with different statements, and in Portugal, the percentage of 15-year-olds reporting to have self-efficacy was higher than the OECD average for almost all statements. In particular, in Portugal, 91% of students included in PISA 2018 agreed with the statement, “I usually manage one way or another” compared to 89% of students on average across OECD countries; 92% of Portuguese students agreed with the statement, “I feel proud that I have accomplished things” compared to an OECD average of 86%. In Portugal, 86% of students also agreed with the statement, “When I’m in a difficult situation, I can usually find my way out of it” compared to an OECD average of 84%; 73% of students in Portugal felt they could handle many things at a time compared to 70% of students on average across OECD countries. Only 67% of students in Portugal agreed that their belief in themselves got them through hard times compared to 71% on average across OECD countries. However, in Portugal, girls were less likely than boys to report self-efficacy and advantaged students were more likely than disadvantaged students (Ibid.).
Having a growth mindset is also another important indicator of well-being as it refers to the beliefs that ability and intelligence can develop over time (Dweck, 2016[19]). A growth mindset enables students to develop positive self-beliefs and expectations that they can accomplish their objectives (Dweck, 2016[19]; OECD, 2019[18]). In PISA 2018, the percentage of students in Portugal having a growth mindset was above the OECD average. However, within the country, there were differences between girls and boys and advantaged and disadvantaged students in terms of the percentage of students with a growth mindset (OECD, 2019[18]). Girls and advantaged students were more likely to report having a growth mindset than respectively boys and disadvantaged students.
Student performance
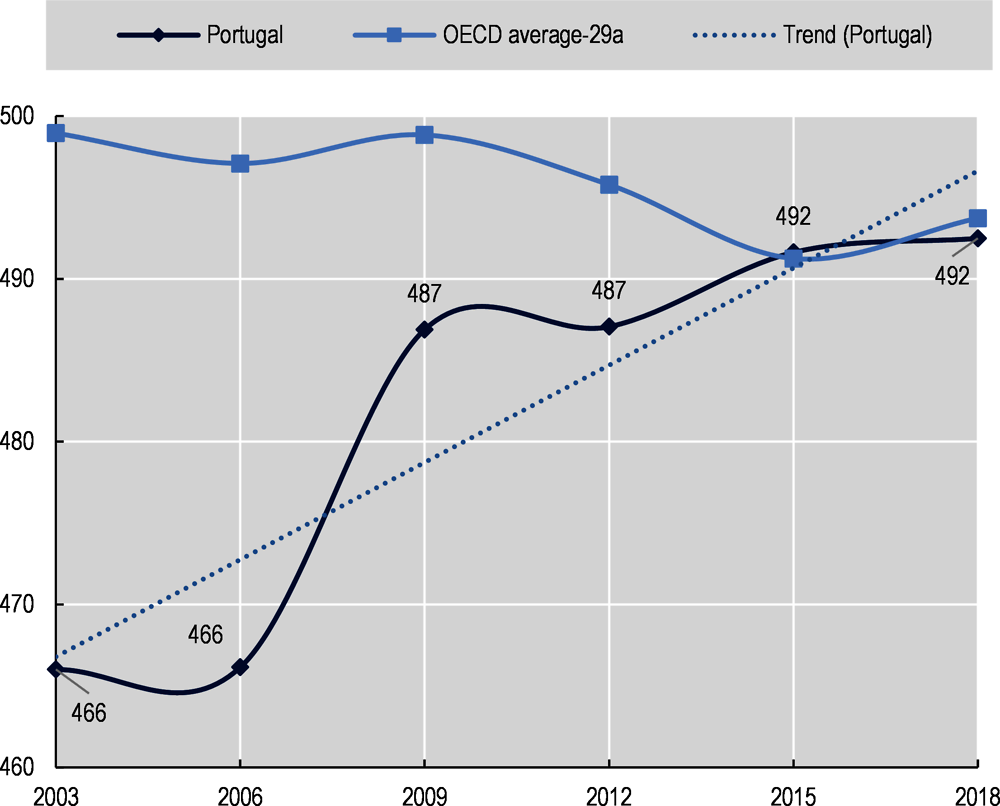
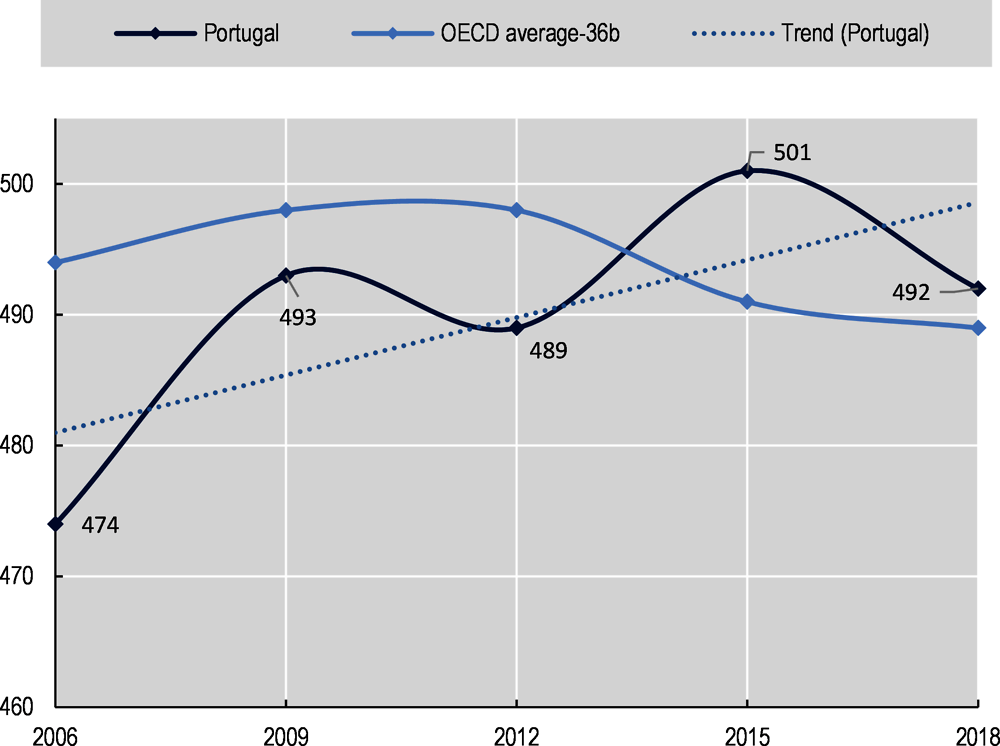
Portugal has shown good academic outcomes in international comparisons, which have been improving over the years. Data from PISA 2018 show that 15-year-old students in Portugal performed around or above the OECD average in 2018, and, assessing over a longer period of time, Portugal appears as one of the few countries with a positive trajectory of improvement in all subjects, reading, mathematics and science. Among the 79 countries and economies that participated in PISA 2018, only seven had similar improvements, and no other OECD member countries. Portugal and Estonia are the only participating countries that have shown a continuous improvement in students’ reading proficiency (OECD, 2019[20]). However, the performance slightly decreased in science in PISA 2018 compared to PISA 2015, and returned close to the level observed in 2009 and 2012. As Figure 1.6 shows, in reading, the main subject of PISA 2018, students in Portugal scored only slightly below the OECD-23 average (OECD, 2019[20]). Girls performed better than boys with a statistically significant difference of 24 points (compared to an OECD average of 30 points higher for girls). On average, 15-year-olds scored 492 points in mathematics compared to an average of 489 points in OECD countries. In mathematics, boys performed better than girls with a statistically significant difference of nine points, while the OECD average was a five point differential for boys (OECD, 2019[20]). The Portuguese average performance in science of 15-year-olds was 492 points, nine points lower than PISA 2015, but still three points higher than the OECD average (see Figure 1.8).
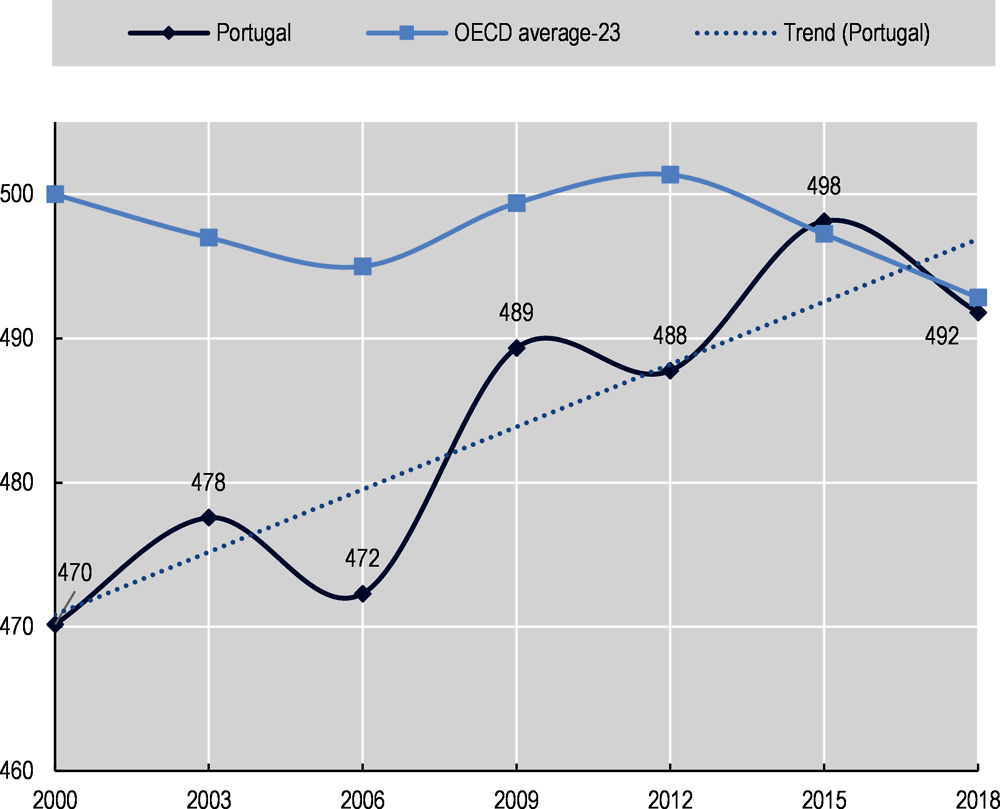
Notes: PISA 2018 Data for Portugal did not meet the PISA technical standards but were accepted as largely comparable.
OECD average-23: Arithmetic mean across all OECD Member countries, excluding Austria, Chile, Colombia, Estonia, Israel, Lithuania, Luxembourg, the Netherlands, the Slovak Republic, Slovenia, Spain, Turkey, the United Kingdom and the United States.
The dark blue line indicates the average mean performance in Portugal and the light blue line the average mean performance across OECD countries with valid data in all PISA assessments. The dotted line represents a trend line for Portugal (linear).
Source: OECD (2019[20]), PISA 2018 Results (Volume I): What Students Know and Can Do, Table I.B1.10, https://doi.org/10.1787/5f07c754-en
Notes: PISA 2018 Data for Portugal did not meet the PISA technical standards but were accepted as largely comparable.
The dark blue line indicates the average mean performance in Portugal and the light blue line the average mean performance across OECD countries with valid data in all PISA assessments. The dotted line represents a trend line for Portugal (linear).
OECD average-29a: Arithmetic mean across all OECD Member countries, excluding Austria, Chile, Colombia, Estonia, Israel, Lithuania, Slovenia and the United Kingdom.
Source: OECD (2019[20]), PISA 2018 Results (Volume I): What Students Know and Can Do, Tables I.B1.11, https://doi.org/10.1787/5f07c754-en.
Notes: PISA 2018 Data for Portugal did not meet the PISA technical standards but were accepted as largely comparable.
The dark blue line indicates the average mean performance in Portugal and the light blue line the average mean performance across OECD countries with valid data in all PISA assessments. The dotted line represents a trend line for Portugal (linear).
OECD average-36b: Arithmetic mean across all OECD Member countries (and Colombia), excluding Austria.
Source: OECD (2019[20]), PISA 2018 Results (Volume I): What Students Know and Can Do, Tables I.B1.12, https://doi.org/10.1787/5f07c754-en.
Furthermore, when comparing reading scores between PISA 2006 and PISA 2018 in Portugal, the share of low-achieving students (scoring below Level 2) did not significantly change and the share of top-performing students (scoring at Level 5 or 6) increased. During the same period, the share of low-achieving students decreased and the share of top-performing students increased in science, while in mathematics neither changed significantly (OECD, 2019[20]).
Diversity, equity and inclusion in education in Portugal
While there have been considerable improvements in academic performance and early school leaving on average across the student population, students’ backgrounds and personal characteristics still have a significant impact on their educational outcomes in Portugal. Dimensions such as socio-economic background and immigrant background are strong predictors of student performance.
This section of the chapter discusses more in detail the composition and outcomes of diverse student groups in Portugal. While there are many dimensions of diversity that can have an impact on student outcomes in Portugal, this section highlights in particular students with an immigrant background, students with special education needs (SEN) and students from Roma communities as these groups are at the core of the analysis of the review. It also considers the effects of socio-economic status and geographical location and how different dimensions can interact to create specific challenges to individual students or student groups (see Annex A).
Students with an immigrant background
Immigration in Portugal started in the 1970s, mainly with the arrival of people from Portuguese-speaking African countries. It intensified during the 1990s, when an increasing number of people from Brazil, Eastern Europe and, to a lesser extent, Asia, started to migrate to Portugal, turning the country into an important destination for migrant workers involved in formal and informal networks. As a result, today there are people with an immigrant background from many different origins (de Almeida et al., 2021[21]). While the number of people with an immigrant background significantly decreased between 2004 and 2014,5 there has been a steady increase in the share of the foreign population residing in Portugal (população estrangeira residente em Portugal) since 2015.
Prevalence and distribution of immigrants/foreigners across Portugal
According to the Foreigners and Borders Service (Serviço de Estrangeiros e Fronteiras, SEF),6 there were 388 731 foreigners7 living in Portugal in 2015 (3.8% of the total population), 421 711 in 2017 (4.1%), 590 348 in 2019 (5.7%) and 662 095 in 2020 (6.4%) (Oliveira, 2021[22]). According to the Portuguese High Commissioner for Migration (Alto Comissariado para as Migrações, ACM), the foreign population is not evenly distributed across the country (see Table 1.4). Concentrations are higher in locations with more job opportunities and already established social networks, mainly resulting from the first waves of immigration (Oliveira, 2021[22]). The rate of foreign people is the highest in the district of Lisbon, where 43.1% of all foreign people lived in 2020. The districts of Faro and Setúbal follow Lisbon with respectively 15.6% and 9.2% of the total foreign population. Furthermore, the share of the foreign population has been increasing in nearly all the Portuguese districts between 2019 and 2020, except for Bragança (-3.0%), and in all of them in 2018-2019. The highest increases have been in Castelo Branco (+36.4% between 2018 and 2019 and +14.1% in 2019-2020), Porto (+29.9% in 2018-2019 and +18.6% in 2019-2020), Braga (+29.4% and +15.8%), Setúbal (+29.3% and +17.2%) and Viana do Castelo (+ 29.2% and +28.8%).
The PISA study collects information on students with an immigrant background based on the place of birth of both the student and their parents. However, PISA does not have information on the nationality status of students, meaning that the population described in the previous paragraph and through this review and defined as “foreigners” does not fully overlap with that of students with immigrant background analysed by OECD data. For instance, students born from first-generation immigrants may have Portuguese nationality, thus being counted as nationals in the Portuguese data and as having immigrant background in PISA. Nevertheless, the descriptive analyses on foreign individuals in the country can provide some contextual information about the student population.
According to PISA 2018, on average across OECD countries, 13% of students had an immigrant background, compared to 10% in 2009. In Portugal, about 7% of students had an immigrant background, up from 5% in 2009, with a slightly greater increase in the number of second-generation students (+1%) than first-generation students (+0.5%) (OECD, 2019[24]). Portugal is considered to be among new destination countries with large populations of low educated immigrants. Evidence shows that children with an immigrant background who grow up in these destination countries tend to have poorer academic and well-being outcomes than their native-born peers (Ibid.).
While there was a significant decrease in the number of foreign students between 2010 and 20158, the opposite trend emerged in 2016 (Figure 1.9). The rise in the foreign population living in Portugal (+2.3% in 2016, +6.0% in 2017, +13.9% in 201, +22.9% in 2019 and +12.2% on 2020) translated into an increase of foreign students in Portuguese schools. ACM estimates that during the 2018/2019 school year, there were 52 641 students with a foreign nationality (referred to as foreign students) in the country, which represents an increase of 18.5% from the previous school year. Still according to ACM, during the 2019/2020 school year, there were 68 018 foreign students, representing an increase of 29.2% from the previous school year.

Source: Oliveira, C. R. (2021[22]), Indicadores de integração de imigrantes: relatório estatístico annual 2021 [Immigrant integration indicators: 2021 annual statistics report], ACM, Lisbon, Figure 5.8., p.96, https://www.om.acm.gov.pt/documents/58428/383402/Relat%C3%B3rio+Estat%C3%ADstico+Anual+2021.pdf/e4dd5643-f282-4cc8-8be1-92aa499bb92f (accessed on 18 January 2022).
The majority of foreign students are enrolled in basic education (79.8% during the 2019/2020 school year), of which most are in the first cycle (34.9% against 17.7% in the second cycle and 27.2% in the third cycle). About 20.2% of these students (13 716 people) are enrolled in secondary education (Oliveira, 2021[22]).
There are many different nationalities in Portuguese public schools (in particular, 179 during the 2019/2020 school year, compared to 170 during the 2018/2019 school year). In the 2019/2020 school year, nearly half of the total foreign student population was from Latin America (49.1%), representing a significant increase from previous years (36.7% in 2017/2018 and 45% in 2018/2019). They were followed by students from Portuguese-speaking African countries (Paises Africanos de Língua Oficial Portuguesa, PALOP) (23.2%), the EU (10.8%), Eastern Europe (5.7%) and Asia (8.1%).
Among these groups, the most represented students are overwhelmingly students from Brazil (43.1% of the total foreign student population in 20118/2019 and 46.8% in 2019/2020), followed by students from Angola (8.4% and 9.2%), Cape Verde (9 7.2% and 6.1%), Guinea-Bissau (4.9% and 4.4%) and Ukraine (4.5% and 3.7%). Romanian students account for 2.8%, 2.8% of students came from Sao Tome and Principe and 2.2% from China in 2020. In spite of these variations, the ten most represented nationalities have remained almost the same in past years, and small changes occurred between the 2018/2019 and 2019/2020 school years. While the share of most student groups remained the same or decreased between the 2018/2019 and 2019/2020 school years, it significantly increased, as noted, for Brazilian students and slightly for students from Angola (from 8.4% to 9.2%), Venezuela (from 1.5% to 1.9%), Nepal (from 1.5% to 1.8%) and India (from 1.4% to 1.6%). In addition, in the academic year 2018/2019, French students (805, raising to 1 088 in 2019/2020), Nepalese students (802, raising to 1 192 in 2019/2020) and Venezuelan students (803, raising to 1 263 in 2019/2020) became more numerous than Spanish students (794, raising to 868 in 2019/2020) and English students (757, raising to 930 in 2019/2020) (Figure 1.10), see more Annex 1.A).
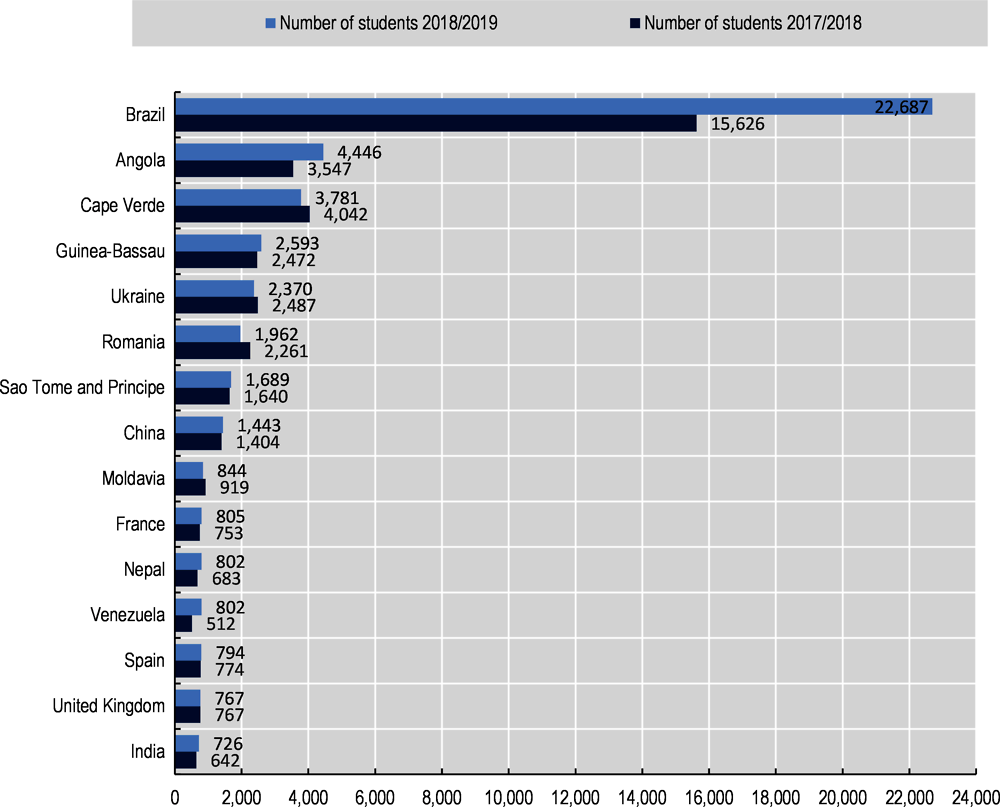
Sources: Adapted from Oliveira, C. R. (2021[22]), Indicadores de integração de imigrantes: relatório estatístico annual 2021 [Immigrant integration indicators: 2021 annual statistics report], ACM, Lisbon, Figure 5.13., p.102, https://www.om.acm.gov.pt/documents/58428/383402/Relat%C3%B3rio+Estat%C3%ADstico+Anual+2021.pdf/e4dd5643-f282-4cc8-8be1-92aa499bb92f (accessed on 18 January 2022); and Oliveira, C. R. (2020[23]), Indicadores de integração de imigrantes: relatório estatístico annual 2020 [Immigrant integration indicators: 2020 annual statistics report], ACM, Lisbon, Figure 5.13, p.116, https://www.om.acm.gov.pt/documents/58428/383402/Relat%C3%B3rio+Estat%C3%ADstico+Anual+2020++Indicadores+de+Integra%C3%A7%C3%A3o+de+Imigrantes/472e60e5-bfff-40ee-b104-5e364f4d6a63, (accessed on 02 September 2021).
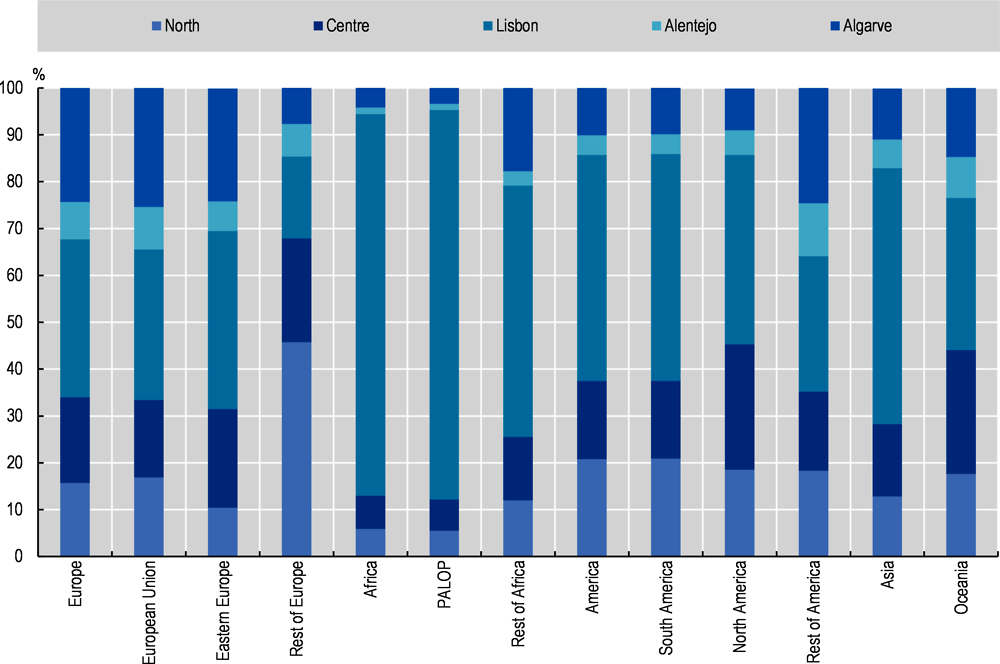
Furthermore, there is an unequal distribution of foreign students across Portugal Mainland (Figure 1.11). The Algarve and the Metropolitan Lisbon Area have respectively 13.2% and 11.5% of students who are foreign students, far ahead of the Centre (4.9%), Alentejo (4.4%), and the North (3.3%). Similarly, student nationalities are unevenly distributed across the different regions (see Figure 1.12). A large majority of students from Africa attend school in the region of Lisbon, while students from Europe are more evenly distributed between Lisbon, the Algarve and the Centre. For nearly all nationality groups, the smallest share goes to Alentejo.
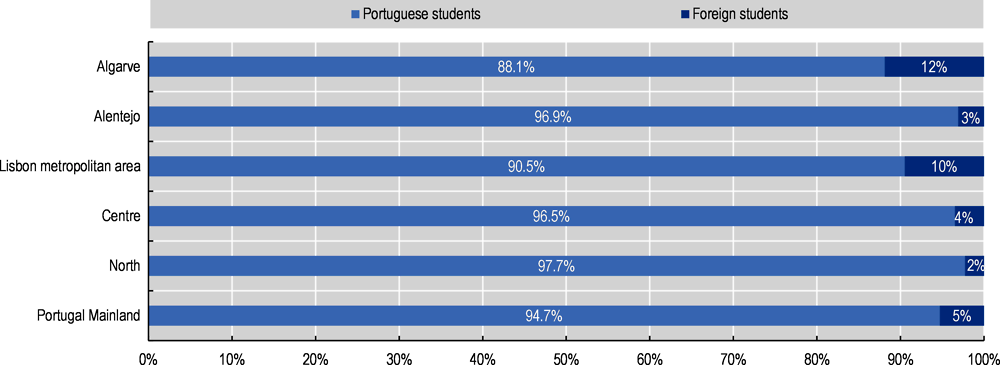
Source: Adapted from Oliveira, C. R. (2021[22]), Indicadores de integração de imigrantes: relatório estatístico annual 2021 [Immigrant integration indicators: 2021 annual statistics report, ACM, Lisbon, Figure 5.12., p.99, https://www.om.acm.gov.pt/documents/58428/383402/Relat%C3%B3rio+Estat%C3%ADstico+Anual+2021.pdf/e4dd5643-f282-4cc8-8be1-92aa499bb92f (accessed on 18 January 2022).
Notes: For the 2019/2020 school year, the United Kingdom is still included in the group of European Union countries since it left the European Union only in December 2020.
PALOP stands for “Portuguese-speaking African Countries”.
Source: Adaptation from Oliveira, C. (2021[22]), Indicadores de integração de imigrantes: relatório estatístico annual 2021 [Immigrant integration indicators: 2021 annual statistics report], ACM, Lisbon, Table 5.1, p.100, https://www.om.acm.gov.pt/documents/58428/383402/Relat%C3%B3rio+Estat%C3%ADstico+Anual+2021.pdf/e4dd5643-f282-4cc8-8be1-92aa499bb92f (accessed on 18 January 2022).
Academic outcomes of students with an immigrant background
In terms of student performance, the average difference in reading performance in PISA 2018 between students with an immigrant background and students without an immigrant background in Portugal was 32 score points in favour of non-immigrant students. After accounting for students' and schools' socio-economic profiles, the difference shrank to 26 score points. Second-generation students with an immigrant background scored higher (483) than first-generation students (436), which was a trend observed in most countries. Portugal is also among the countries/economies with a share of academically resilient students with an immigrant background, not significantly different from the OECD average with respectively 17.1% and 16.8% (Cerna, Brussino. and Mezzanotte, 2021[25]). Furthermore, on average across OECD countries, 17% of immigrant students scored in the top quarter of reading performance in 2018. Similarly, in Portugal, 17% of immigrant students performed at this level (OECD, 2019[24]).
In a recent study conducted in the Metropolitan Area of Lisbon, de Almeida et al. (2021[21]) found that there are significant differences in the performance of students with an immigrant background depending on their immigrant background and place of birth. In particular, most first and second-generation immigrant students perform worse than their non-immigrant peers, and students from Brazil and PALOP countries show the highest differences in school results compared to native-born students.
Oliveira (2021[22]), using DGEEC data, also found that the rate of transition/conclusion of primary and secondary students was consistently lower for foreign students between the 2011/2012 and the 2019/2020 school years. This rate increased from 79.0% in the 2011/2012 school year to 87.8% in 2018/2019 and 92.3% in 2019/2020 in basic education and it increased to 73.7% in secondary education, suggesting steady improvements, in particular in recent years. There are, nonetheless, significant differences between students from different nationalities (see Annex 1.B). Furthermore, Eurydice (European Commission/EACEA/Eurydice, 2019[26]) estimates that, in 2017, slightly more students with an immigrant background (13.9%) than their native-born peers (12.5%) were early leavers from education.
Isolation of students with an immigrant background
Using an isolation index of immigrant students in schools, PISA 2018 analysed the segregation of students in schools (OECD, 2019[24]). It did so by measuring the probability that native-born and students with an immigrant background would interact, along an index ranging from 0 to 1. An index value of 1 indicates a fully segregated school where it is unlikely for students without an immigrant background to be enrolled. Instead, a value of 0 indicates no segregation of students based on immigrant background. Portugal scored 0.48 on the index, above the OECD average of 0.45. This shows that, on average, a student with an immigrant background in Portugal is more likely to be segregated from students without such a background in comparison to in most other OECD countries (see Figure 1.13). Portugal is one of the participating countries that has a relatively large proportion of immigrant students and in which segregation of these students across schools is quite prevalent, along with Denmark, Estonia, Finland and the United Kingdom (OECD, 2019[24]).

Notes: Countries where less than 5% of students had an immigrant background are not represented in the Figure.
The isolation index measures whether immigrant students are concentrated in some schools. The index is related to the likelihood of a representative immigrant student to be enrolled in schools that enrol not immigrant student. It ranges from 0 to 1, with 0 corresponding to no segregation and 1 to full segregation.
Countries and economies are ranked in descending order in the index of isolation.
Source: OECD (2019[24]), PISA 2018 Results (Volume II): Where All Students Can Succeed, Figure II.9.8, https://doi.org/10.1787/b5fd1b8f-en.
Attitudes and sense of belonging
PISA 2018 also measured students’ attitudes towards immigrants, developing an index of attitudes based on a set of statements that respondents could address on a scale from strongly disagree to strongly agree9. A positive value in this index indicates that students have more positive attitudes towards immigrants than the average student across OECD countries. Portugal is among the group of countries that reported the most positive attitudes towards immigrants. It has the highest index (0.5) among participating countries, along with Canada and Korea. However, it is also the country with the highest difference between different groups in the index of students’ attitudes towards immigrants, meaning that girls, socio-economically disadvantaged students and students with an immigrant background have more positive attitudes towards immigrants than boys, socio-economically advantaged students and native-born students (OECD, 2020[27]). This suggests that there exist large differences in attitudes towards immigrants and that the population is very heterogeneous, even though the overall results are positive compared to the OECD average.
Similarly, Eurydice (European Commission/EACEA/Eurydice, 2019[26]) reports that, in primary schools, while there is no significant difference in terms of sense of belonging between students who do not speak the language of instruction at home and their peers, the former experience significantly more bullying than the latter. Portugal is thus among the countries where the difference between these two groups of students is the highest.
Students from Roma communities
Prevalence and distribution of Roma communities across Portugal
Roma communities form the largest ethnic minority group in the European continent. They represent between 10 and 12 million people, with an estimated population share in the EU that ranges from 10.3% in Bulgaria, 9.1% in the Slovak Republic, 8.3% in Romania, 7% in Hungary, 2.5% in Greece, 2% in the Czech Republic, 1.6% in Spain to less than 1% in most other countries including Portugal (European Commission, 2018[28]). Unfortunately, due to the lack of systematic data collection, it is not possible to give an exact account of the number of Roma people in Portugal. This is mainly due to the fact that, as in many European countries, the legislation forbids data collection on personal characteristics such as ethnicity (Rutigliano, 2020[29]). However, the most recent estimates from 2015/2016 indicate that there are around 37 000 Roma people in Portugal, representing approximately 0.4% of the population.10 Some researchers estimate that the Roma population could be between 40 000 and 50 000 people, or even higher (Liégeois, 2015[30]). During the country visit, the OECD review team heard from Roma associations that these numbers might be higher, most likely between 75 000 and 100 000 Roma people in the country.
A 2014 report by the Portuguese Observatory of Roma Communities (Observatório das Comunidades Ciganas, ObCig), based on a survey that identified nearly 24 210 Roma people (separated in 822 communities) among all Roma living across the country, noted that Roma communities might nonetheless be relatively evenly distributed across regions, with a slight majority of them living in the North (24.8%), followed by the Centre (23.2%), the region of Lisbon (22.8%) and Alentejo (20.2%), but the Algarve (9.1%) being the exception. However, Roma communities are rather unevenly distributed within regions (Mendes, Magano and Candeias, 2014[31]).11 Most of them might live in major districts, with the highest concentrations in Lisbon, Porto, Faro, Aveiro, Beja and Braga.
Roma communities in Portugal face significant challenges. In most European countries, Roma people have a higher chance of living in poverty, suffering from hunger, living in a precarious household, and being under-educated and unemployed – a situation that has not substantially changed since 2011 (Rutigliano, 2020[29]). The situation is no exception in Portugal. For example, in the European Union Agency for Fundamental Rights (FRA) 2016 Minority Survey, when asked about their ability to “make ends meet”, 74% of Portuguese Roma respondents said that they did so with great difficulty. Only 4% responded that it was fairly easy, and the rest stated that they made ends meet with difficulty or some difficulty (FRA, 2018[32]). The study also identified that 38% of Portuguese Roma respondents lived in a household with a current low work intensity12 compared to 12% of the general population. Moreover, in 2016 in Portugal, 14% of Roma people lived in households without tap water inside the dwelling, compared to 3% among the general population, and 17% lived in households without a toilet, bathroom or shower, compared to 1% in the general population. However, among participating countries, Portugal has the second-highest rate (96%) of Roma aged 16 or over who indicated coverage by national basic health insurance and/or additional insurance, closely following Spain (98%). In addition, about 70% of respondents assessed their general health as good or very good, compared to 74% of the general population (ibid.).
There is limited data available to assess the situation of Roma people in education specifically. At the national level, in 2017, DGEEC published the first School Profile of Roma Communities (Perfil Escolar das Comunidades Ciganas) for the 2016/2017 school year, which was repeated for the school year 2018/2019.13 This Profile contains a series of statistical tables on Roma students enrolled in education in Portuguese public schools. It is the result of a survey conducted by DGEEC, in collaboration with the Directorate-General for Education (Direção-Geral da Educação, DGE), through a questionnaire distributed to schools across the country. For the 2018/2019 school year, 70.2% of Portuguese public schools participated in the survey (compared to 47.2% for the 2016/2017 school year). About 70% of respondents reported having Roma students in their school.
According to the School Profile, there were approximately 25 140 Roma students enrolled in Portuguese public schools who responded to the survey during the 2018/2019 school year. A large majority of Roma students are enrolled in basic education (87.2%), but only a small share are in secondary education (2.6%). Furthermore, the School Profile shows that a majority of enrolled Roma students are in the North (40.3%), followed by the Metropolitan Area of Lisbon (21.1%), the Centre (18.9%), Alentejo (15.0%) and the Algarve (4.7%) (Table 1.5). Braga, Porto and Lisbon have the highest numbers of Roma students enrolled in public schools (Figure 1.14). The share of Roma students among the general pre-school, basic and secondary education student population is the highest in Alentejo (4.0%), followed by the North (2.3%). Roma students represent 1.8% of the total student population in the Centre and the Algarve and 1.5% in the Metropolitan Area of Lisbon (Table 1.6).
In terms of Roma student participation, FRA (2018[32]) identified that, in Portugal, in 2016, 42% of Roma children participated in early childhood education and care (31% of Roma boys and 51% of Roma girls), while 90% of compulsory school age Roma children participated in education (with no gender variation). However, about 90% of Roma were early school leavers, with slightly more Roma women (91%) than Roma men (89%) being early leavers, compared to 14% among the general population. This suggests that educational attainment is considerably low among the Roma population. This number is the second-highest after Greece (92%) among the European countries surveyed. While consistent data are missing regarding secondary education, Figure 1.14 suggests that very few Roma young people participate in education at this level.
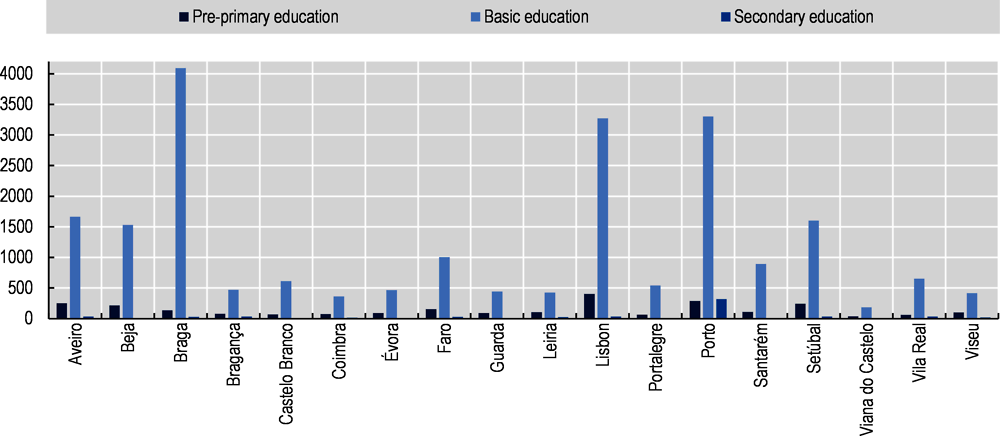
Source: DGEEC (2020[33]), School Profile of Roma Communities, https://www.dgeec.mec.pt/np4/97/ (accessed on 25 August 2021).
According to the DGEEC School Profile of Roma Communities 2018/2019, retention and dropout rates are high among Roma students compared to the general population (Figure 1.15). The overall retention/dropout rate reaches 25% among Roma students compared to 8.2% among the general population, the highest rate being in the 2nd cycle, followed by the 3rd cycle and secondary education. Most Roma dropout during the 2nd cycle and secondary education, while most repeat grades in the 2nd and 3rd cycles.
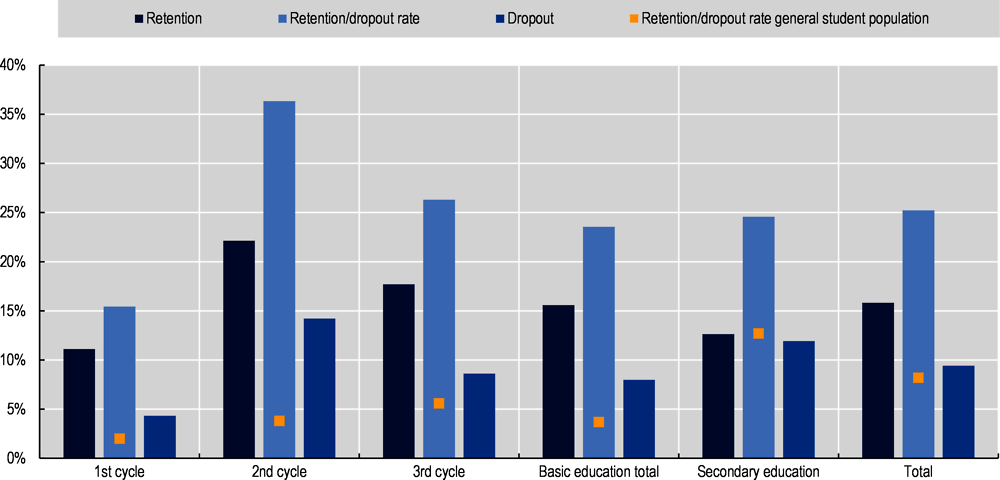
Source: Adapted from DGEEC (2020[33]), School Profile of Roma Communities, https://www.dgeec.mec.pt/np4/97/ (accessed on 25 August 2021).
Discrimination
Available data also show that Roma communities face significant discrimination issues in Portugal. The FRA Survey (2018[32]) found that in Portugal in 2016, 71% of Roma respondents reported feeling discriminated against based on their Roma background in at least one of the domains covered in the five years preceding the study. About 47% of them felt discriminated against in the 12 months preceding the study. Portugal is the country covered by the study where most Roma responded feeling discriminated against based on their ethnic origin, well above the total average in participating countries (see Figure 1.16). According to the data collected, discrimination is the strongest when looking for work and housing and the lowest in education, though still significant. About 13% of Roma respondents reported being discriminated against in the last five years while affiliated with the school (as parents or students) because they were Roma. Segregation remains an issue for Roma students, too. FRA estimates that 19% of Roma students between the ages of 6 and 15 attended classes in which “most” of their classmates were Roma.

Notes: *Out of all Roma respondents at risk of discrimination on the grounds of Roma background in at least one of the domains of daily life asked about in the survey (‘Past 5 years’: n=7 745; ‘Past 12 months’: n=7 875); weighted results.
Domains of daily life asked about in the survey: looking for work, at work, education (self or as parent), health, housing, and other public or private services (public administration, restaurant or bar, public transport, shop).
Discrimination experiences in “access to health care” were asked about only for the past 12 months, which explains the different sample sizes (n) for the two reference periods.
Source: FRA (2018[32]), EU-MIDIS II 2016, Roma, https://fra.europa.eu/sites/default/files/fra_uploads/fra-2016-eu-minorities-survey-roma-selected-findings_en.pdf (accessed on 03 September 2021).
Students with special education needs (SEN)
In this report, the term “special education needs” (SEN) is used to refer to the broad array of needs of students who are affected by learning disabilities, physical impairments and/or who suffer from mental disorders. There are significant variations regarding the definitions and categories of SEN used across OECD countries (Brussino, 2020[34]). Following Decree Law No. 54/2018, 6 July, on inclusive education (see Chapter 2), Portugal abandoned the system of categorisation of students. As such, the term "special education needs" is no longer used. Instead, Portugal is using the expression “students in need of support measures”, which comprises three categories of measures and can apply to any student (Box 1.2). This report uses the term SEN to differentiate these students from other student groups.
Research evidence on the implications of labelling students’ learning experiences and outcomes is inconclusive. Some studies suggest that labelling is inevitable and serves some positive purposes. For example, it helps bring consistency to research and communication regarding SEN and is particularly useful in testing, evaluation, assessment and placement of students in special programmes (Ormrod, 2008[35]; Thomson, 2012[36]). Others have argued that labelling has negative consequences for stereotyping and grouping people rather than seeing them as individuals (Osterholm, Nash and Kritsonis, 2007[37]).
In a recent mapping of special provision approaches, the European Agency For Special Needs and Inclusive Education (2020) notes that school staff tend to face difficulties in addressing learners’ needs without labelling the learners. The report also highlights that various countries are changing their approaches to prevent unnecessary and potentially harmful labelling of learners as a prerequisite for official decisions on SEN (European Agency for Special Needs and Inclusive Education, 2020[38]).
For example, Thomson (2012[36]) investigated the relationships between main concepts associated with labelling gifted students and the impact on their self-esteem in the existing literature. The author concluded that, although special education professionals argue that labelling can be helpful because it provides a common language to describe and recognise a specific need, it can also be harmful when, as a result of that label, individuals are degraded, discriminated against, excluded from society or placed in classrooms without regard for their individuality. A more recent scoping review that examined the perceptions and outcomes of autism diagnostic disclosure to others found discrepancies in perspectives between others and people with autism. While “others” perceive disclosure as having positive effects on social acceptance and perceptions of disability for people with autism, particularly when explanatory information about autism was provided with the autism label, people with autism were reluctant to disclose diagnosis due to perceived negative outcomes and stigma (Thompson-Hodgetts and al., 2020[39]).
Portugal’s move away from categorisation
Decree Law No. 54/2018 of 6 July on Inclusive Education initiates a move away from the rationale that it is necessary to categorise to intervene. It requires identification processes and decisions for educational support to be defined and implemented at the school level according to national guidelines. Students are not categorised, or labelled, according to their personal characteristics (e.g. SEN, immigrant background, Roma background), but according to the type of educational support measure(s) they need.
Article 20 of the Decree Law states that the process to identify students in need of support measures must be done at the school level as early as possible through the collaboration of parents/guardians, teachers, relevant non-teaching staff and social services. Once a student has been identified as in need of additional measures, a request is made to the school leader who must approve the assessment made and mobilise the multidisciplinary team. The Decree Law requires each school cluster to have a multidisciplinary team whose purpose is to support inclusion. In particular, the team is responsible for the identification of students in need of support measures, the implementation and monitoring of these measures and, if necessary, the writing of technical-pedagogical reports on individual students.
New categories and implications for data collection
Therefore, the notion of “student in need of support measures” comes to replace the notion of “special education needs” and the associated categories, or any other category. Any student, from any background, can be a student in need of support measures. There are three broad categories of support measures, which are explained in greater details in Chapter 2: (1) universal measures; (2) selective measures; (3) additional measures. Each category contains a set of measures, ranging from tutoring, curriculum accommodation or enrichment to tutoring, pedagogical-psychological support and the redesigning of the pedagogical strategy, including significant curricular adjustments.
This new categorisation system takes into account the support students receive and not their personal characteristics. This logic has substantial implications regarding the data collection process. First, as mentioned, Portugal considers that labelling has a negative impact on students. Second, the law forbids Portugal from collecting data based on personal characteristics, except nationality and gender. Some data on students with SEN and from ethnic groups are available, but those are based on school leaders’ perception and not on questionnaires directly answered by students or their family. At the time of writing, DGEEC is collecting data on the number of students receiving support measures in each category set out above. The objective is to inform the system on the measures implemented in schools and the needs of schools across the country.
Participation
Each school year between 2010/2011 and 2017/2018, DGEEC sent a questionnaire to Portuguese schools to develop knowledge on students with SEN, the challenges they face and educational measures to respond to these challenges. The questionnaires also provide information on human resources dedicated to address students with SEN and reference school clusters in the area of early intervention.14
During the 2017/2018 school year, there were 87 039 students with SEN in Portuguese schools, including 3 559 in pre-school, 65 132 in basic education and 13 077 in secondary education (see Table 1.7). The number of students with SEN enrolled in mainstream schools has increased since the 2012/2013 school year, mainly in the 3rd cycle and secondary education (Figure 1.17). Overall, it increased by 7% between the 2016/2017 and 2017/2018 school years.
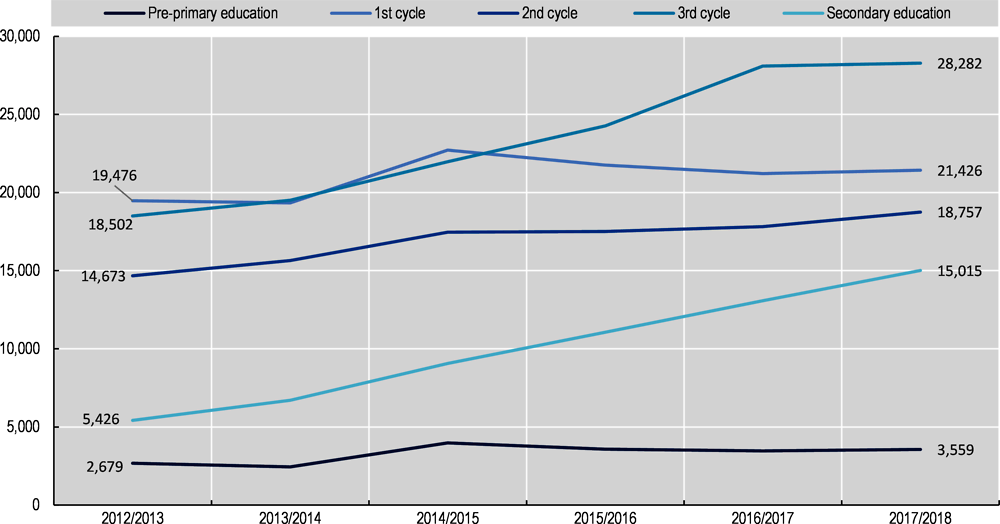
Source: Adapted from DGEEC (2018[40]), Special Education Needs 2017/2018, https://www.dgeec.mec.pt/np4/224/ (accessed on 01 September 2021).
Besides public and private (both state-dependent and independent) schools, students with SEN can also enrol in private special education schools, which are private institutions that depend on cooperatives or parent associations. Private for-profit separate schools are highly concentrated in Lisbon and on the coast, with very few available inland. As for mainstream schools, the school calendar for private special education schools is defined annually by the MoE. Special education schools close for holidays for 30 days. However, they have to ensure students remain engaged through the organisation of free activities in periods outside of school activities, during school holidays and at all times of academic interruption. Since the 2009/2010 school year, following the Decree Law No. 3/2008, students in need of additional support have increasingly enrolled in mainstream schools, and most publicly-funded private special education schools have been turned into Resource Centres for Inclusion (Centros de Recursos para a Inclusão, CRIs; see Chapters 3 and 4).
Portugal has a one-track approach for the enrolment of students with SEN in education settings. This means that mainstreaming is the most common approach and that there are only a few specialised structures for students with special education needs. In mainstream schools, programmes and activities are adapted to address the individual needs of students with SEN and various services are provided to support their learning and broader well-being (Brussino, 2020[34]). An exceptionally high rate of students with SEN attend mainstream schools, which kept increasing between 2012 and 2018 (Figure 1.18). The latest available data show that in 2018, 98.9% of students with SEN were enrolled in mainstream schools, while the remaining 1.1% of students were enrolled in private institutions (Campos Pinto and Faneca, 2020[41]). Most students with SEN attend public schools (86.4% in 2017/2018), though an increasing number of them enrol in mainstream private schools (12.5% in 2017/2018 against 4.3% in 2012/2013).
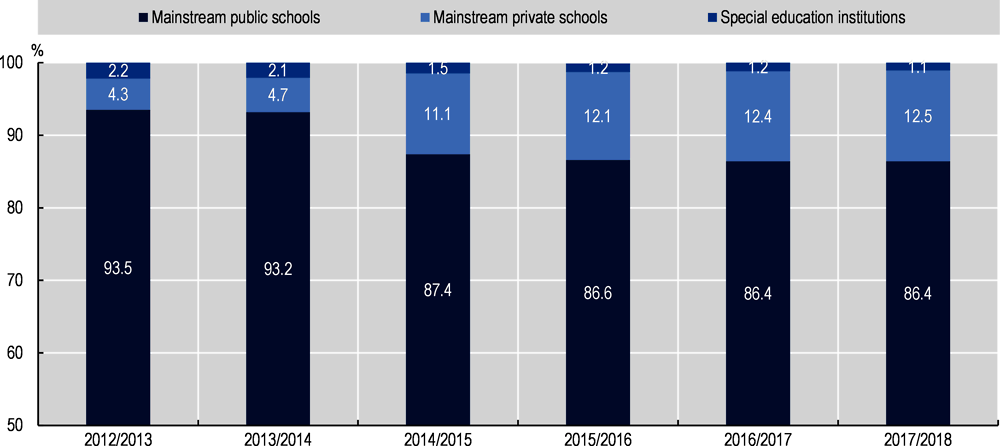
Source: DGEEC (2018[40]), Special Education Needs 2017/2018, https://www.dgeec.mec.pt/np4/224/ (accessed on 01 September 2021).
Early school leaving
The Disabilities and Human Rights Observatory (Observatório da Deficiência e Direitos Humanos, ODDH) highlights that students with SEN in Portugal tend to have poorer outcomes than students without SEN (Campos Pinto and Faneca, 2020[41]). The rate of students with SEN who are early school leavers is significantly higher than for students without SEN. In 2018, among the population aged 18 to 24, 21.9% of people with SEN were early school leavers compared to 12.4% among people without SEN. This rate was also slightly higher than the EU-27 average for both people with SEN (20.3%) and without SEN (9.9%). The gap between the SEN population and the general population increases considerably among the population aged 18 to 29 (Figure 1.19). The authors note a decrease in early school leavers among people with SEN since 2015, a decrease of 2.2% among the population aged 18 to 24 and of 3.9% among the population aged 18 to 29. In spite of existing challenges, Campos Pinto and Faneca (2020[41]) highlight progress in terms of access to university (+16.8% between the 2018/2019 and the 2019/2020 school years) as well as improvements in terms of accessibility.

Source: Campos Pinto and Faneca (2020[41]), Pessoas com Deficiência em Portugal - Indicadores de Direitos Humanos 2020 [People with Disability in Portugal – Human Rights Indicators 2020], http://oddh.iscsp.ulisboa.pt/index.php/pt/2013-04-24-18-50-23/publicacoes-dos-investigadores-oddh/item/483-relatorio-oddh-2020 (accessed on 01 September 2021).
Socio-economic background
Performance and attainment
In Portugal, the socio-economic background of students has an impact on their academic outcomes. According to PISA 2018, socio-economic status was a strong predictor of performance in reading, mathematics and science. In particular, advantaged students outperformed disadvantaged students in reading by 95 score points. The percentage of variance in reading performance explained by economic, social and cultural status (ESCS) is only slightly higher than the OECD average (13.5% against 12%). Moreover, many high-performing disadvantaged students held lower ambitions than would be expected given their academic achievement. Only three in four high-achieving disadvantaged students expect to complete tertiary education compared to almost all high-achieving advantaged students (OECD, 2019[24]).
Portugal does not collect data specifically on students’ socio-economic status. DGEEC collects data on students benefitting from the School Social Assistance (Ação Social Escolar, ASE). The ASE is a programme implemented in 1971 to prevent social exclusion and school dropout by giving students from more disadvantaged socio-economic backgrounds the opportunity to complete compulsory schooling successfully. Eligibility for financial aid is structured by income brackets. Students in bracket A, corresponding to students with families with the lowest income, receive the most support, including free meals and textbooks. Students in bracket B also receive significant support, although less than students in bracket A (e.g., they have to pay 50% of the price of school meals). Students in bracket C are students in families with the highest income and do not receive any support (Ministry of Education, 2022[5]).
National data supports the PISA assessment that socio-economic status has a strong impact on students’ outcomes. The National Council of Education notes, for example, that most students who benefitted from the ASE during the 2017/2018 school year were those following curricular alternative pathways in the 2nd and 3rd cycles, education and training courses in the 3rd cycle and VET classes in the secondary, which might indicate a relationship between disadvantaged socio-economic status and (1) learning difficulties and (2) social determinism (CNE, 2019[15]). Furthermore, fewer students receiving the ASE in brackets A and B finish the different levels of education within the expected amount of time, compared to their peers who do not benefit from ASE. For example, during the 2018/2019 school year, 56% of students who were not covered by ASE finished the 3rd cycle of basic education in three years and with positive results on the national examinations (compared to 47% on 2015/2016). There were only 21% among students in bracket A and 28% in bracket B who did so (DGEEC, 2021[42]) (see Table 1.8). This suggests that students from more disadvantaged socio-economic backgrounds might have significantly higher rates of grade repetition, lower scores in national examinations and are more likely to attend classes with younger peers.
Grade repetitions
Data from PISA 2018 (OECD, 2020[14]) show that students from a disadvantaged socio-economic background in Portugal were more than five times as likely to have repeated a grade, compared to students from an advantaged background, which is significantly higher than the OECD average. Even after accounting for reading performance, grade repetition was more likely for students from a disadvantaged background (see Figure 1.20). This could also suggest that factors outside academic performance affect decisions about which students are required to repeat a grade. In terms of school attendance, PISA also shows that 11.1% of disadvantaged students in Portugal (above the OECD average) against 3.7% of advantaged students briefly attend or do not attend pre-primary school (OECD, 2020[14]).
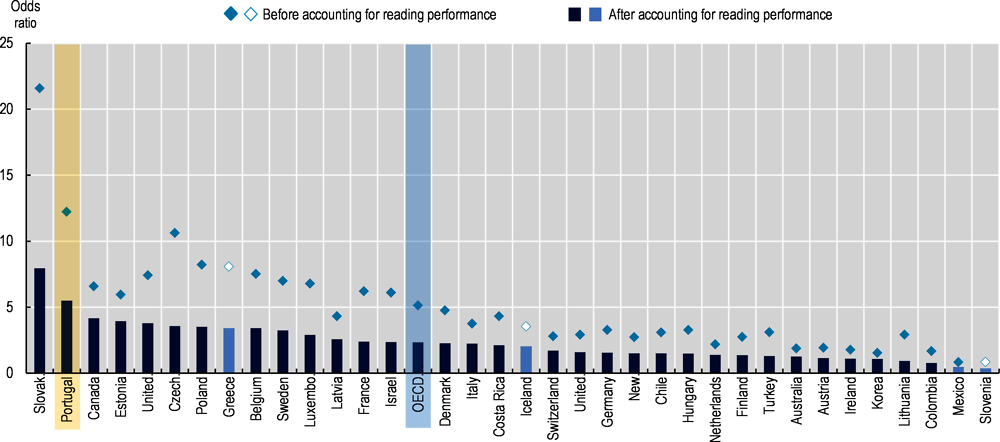
Notes: The socio-economic profile is measured by the PISA index of economic, social and cultural status (ESCS).
Statistically significant odds ratios are shown in darker tones.
Countries and economies are ranked in descending order of the increased likelihood of having repeated a grade amongst disadvantaged students, after accounting for reading performance.
Source: OECD (2020[14]), PISA 2018 Results (Volume V): Effective Policies, Successful Schools, Table V.B1.2.11, https://doi.org/10.1787/ca768d40-en.
Socio-economic segregation
Another challenge faced by Portugal is the isolation of students from disadvantaged socio-economic backgrounds. A 2018 DGEEC report on socio-economic asymmetries among 2nd cycle public schools during the 2015/16 school year highlighted significant inequalities between schools (Oliveira Baptista and Pereira, 2018[43]). The district with the most segregation was Lisbon, where some schools had an 8% share of ASE students, while in others, this share reached 78%. In Setúbal, the share of ASE students went from 17% in some schools up to 83% in others. This study also unveiled substantial disparities across districts. For example, while the district of Santarém had the same percentage of ASE students as the district of Lisbon, the average difference between public schools in terms of the share of ASE students was 8.1% in the former and 17% in the latter.
Looking at the isolation index of advantaged students, PISA 2018 shows that Portugal is above the OECD average regarding the isolation of advantaged students, while it is slightly below the OECD average regarding the isolation of disadvantaged students (OECD, 2019[24]). This suggests that socio-economically advantaged students were, on average, less likely to attend the same schools as average or disadvantaged students than disadvantaged students were likely to attend the same school as more advantaged students.
There are also patterns of socio-economic segregation between public and private schools. For example, PISA 2015 showed that among schools enrolling 15-year-old students, schools in the top quartile of socio-economic status are 13 percentage points less likely to be public schools than those in the bottom quartile of socio-economic status (Liebowitz et al., 2018[6]). Further, when examining census data of all Portuguese grade 6 students, Brás de Oliveira (2018[44]) found that 1.3% of students at private independent schools receive ASE, while 45.4% in government-dependent private schools and 53.6% in public schools receive ASE.
The Equity Indicator
Since 2020, DGEEC has developed a new indicator to measure and monitor equity in education across the country. The indicator aims to assess the ability of school clusters and municipalities to promote the school success of disadvantaged students, i.e., ASE students. School success is defined as the completion of each school cycle in the expected time and with positive scores in national examinations.15 A school or a municipality obtains a high positive value in the equity index if its disadvantaged students achieve higher success in school compared to the national average school success of students of the same socio-economic condition (controlling for ASE bracket, age and mother’s educational level). As well as a national report with main trends, DGEEC publishes annually updated data for each school cluster and municipality that are made publicly available and used by the School External Evaluation Programme run by the General Inspectorate (Inspeção-Geral da Educação e Ciência, IGEC).
The first systematised results on the equity indicator highlights regional variations (DGEEC, 2021[42]), with the Northern coastal districts of Viana do Castelo, Braga, Porto and Aveiro as well as Vila Real, and the districts of Viseu, Coimbra and Leira in the Centre showing the highest values of educational success for ASE students (i.e. the highest positive values in the equity indicators) in 2019. On the contrary, the districts of Lisbon and Setúbal in the metropolitan region of Lisbon, and those of Beja and Portalegre in Alentejo had the worst results on the equity index (lowest negative values). The districts of Lisbon and Setúbal showed a negative equity index at all cycles of education. This means that disadvantaged students within schools and municipalities in these districts are the least likely to complete each school cycle in the expected time and with high scores in the national examinations. When looking at the municipalities with the highest numbers of enrolled students, Lisbon, Sintra, Almada and Porto have the lowest equity index, with negative values at all cycles, except in the first cycle in Sintra (see Annex 1.C). In spite of these significant variations between districts and municipalities, according to the equity indicator, equity improved in nearly all districts between the 2017/2018 and 2018/2019 school years (DGEEC, 2021[42]).
References
[44] Bras de Oliveira, J. (2018), Effectiveness of Private Schools Versus Public Schools: A Comparative Analysis in Portugal, NOVA - School of Business and Economics.
[34] Brussino, O. (2020), “Mapping policy approaches and practices for the inclusion of students with special education needs”, OECD Education Working Papers No. 227, https://dx.doi.org/10.1787/600fbad5-en.
[41] Campos Pinto, P. and P. Faneca (2020), Pessoas com Deficiência em Portugal - Indicadores de Direitos Humanos 2020 [People with Disability in Portugal – Human Rights Indicators 2020], ODDH/ISCSP, Lisbon, http://oddh.iscsp.ulisboa.pt/index.php/pt/2013-04-24-18-50-23/publicacoes-dos-investigadores-oddh/item/483-relatorio-oddh-2020 (accessed on 25 August 2021).
[25] Cerna, L., O. Brussino. and M. Mezzanotte (2021), The Resilience of Students with an Immigrant Background: An Update with PISA 2018, OECD Publishing, https://doi.org/10.1787/19939019.
[15] CNE (2019), Estado da Educação 2018 [State of Education 2018], Conselho Nacional da Educação, https://www.cnedu.pt/content/edicoes/estado_da_educacao/Estado_da_Educacao2018_web_26nov2019.pdf (accessed on 14 December 2021).
[21] de Almeida, D. et al. (2021), “Academic performance and territorial patterns of students with an immigrant background in the Lisbon Metropolitan Area”, Universidade Nova de Lisboa, Lisbon, https://papers.ssrn.com/sol3/papers.cfm?abstract_id=3846487 (accessed on 2 February 2022).
[8] DGEEC (2021), Education and Training in Portugal, DGEEC, https://www.dgeec.mec.pt/np4/%7B$clientServletPath%7D/?newsId=1217&fileName=PresentationPPUE_EN.pdf (accessed on 14 November 2021).
[4] DGEEC (ed.) (2021), Education Statistics 2019/2020, DGEEC, https://www.dgeec.mec.pt/np4/96/%7B$clientServletPath%7D/?newsId=145&fileName=DGEEC_DSEE_2021_EE20192020.pdf (accessed on 19 August 2021).
[42] DGEEC (2021), Resultados Escolares - Indicador de Equidade, Ensino Básico e Secundário - 2019 [School Results – Equity Indicator, Basic and Secondary Education - 2019], DGEEC, https://www.dgeec.mec.pt/np4/490/%7B$clientServletPath%7D/?newsId=1233&fileName=Relatorio_IndicadorEquidade.pdf (accessed on 14 December 2021).
[11] DGEEC (2020), Perfil do Aluno 2018/2019 [Student Profile 2018/2019], DGEEC, https://www.dgeec.mec.pt/np4/97/%7B$clientServletPath%7D/?newsId=147&fileName=DGEEC_DSEE_2020_PERFIL_DO_ALUNO_1819.pdf (accessed on 14 December 2021).
[33] DGEEC (2020), Perfil Escolar das Comunidades Ciganas 2018/2019 [School Profile of Roma Communities 2018/2019], https://www.dgeec.mec.pt/np4/97/ (accessed on 25 August 2021).
[10] DGEEC (2020), Transition/attainment rates and retention/dropout rates – Continent, https://www.dgeec.mec.pt/np4/96/ (accessed on 18 August 2021).
[40] DGEEC (2018), Special Education Needs 2017/2018, https://www.dgeec.mec.pt/np4/224/ (accessed on 1 September 2021).
[19] Dweck, C. (2016), Mindset: The New Psychology of Success, Ballantine Books, New York.
[38] European Agency for Special Needs and Inclusive Education (2020), Changing Role of Specialist Provision in Supporting Inclusive Education: Mapping Specialist Provision Approaches in European Countries, https://www.european-agency.org/sites/default/files/CROSP_Synthesis_Report.pdf (accessed on 17 December 2021).
[13] European Commission (2019), Education and Training Monitoring 2019: Portugal, Publications Office of the European Union, https://doi.org/10.2766/219884.
[28] European Commission (2018), “Report on the evaluation of the EU Framework for National Roma Integration Strategies up to 2020”, Commission Staff Working Document No. 480.
[26] European Commission/EACEA/Eurydice (2019), Integrating Students from Migrant Backgrounds into Schools in Europe: National Policies and Measures, Publications Office of the European Union, https://doi.org/10.2797/819077.
[32] FRA (2018), Second European Union Minorities and Discrimination Survey: Roma - Selected Findings, Publication Office of the European Union, https://fra.europa.eu/sites/default/files/fra_uploads/fra-2016-eu-minorities-survey-roma-selected-findings_en.pdf (accessed on 14 December 2021).
[6] Liebowitz, D. et al. (2018), OECD Reviews of School Resources: Portugal 2018, OECD Publishing, https://doi.org/10.1787/9789264308411-en.
[30] Liégeois, J. (2015), “Les Roms au coeur de l’Europe [Roma communities at the heart of Europe]”, La Documentation Française, Vol. 6/1053, pp. 19-29, https://doi.org/78.41.129.19.
[31] Mendes, M., O. Magano and P. Candeias (2014), Estudo Nacional Sobre as Comunidades Ciganas [National Study on Roma Communities], ACM I.P., https://repositorio.iscte-iul.pt/bitstream/10071/15587/1/estudonacionalsobreascomunidadesciganas.pdf (accessed on 7 September 2021).
[5] Ministry of Education (2022), OECD Review for Inclusive Education: Country Background Report for Portugal, Ministry of Education, Lisbon.
[9] National Institute of Statistics (INE) (2021), Taxa de abandono precoce de educação e formação [Early leaving in education and training], https://www.ine.pt/xportal/xmain?xpid=INE&xpgid=ine_indicadores&userLoadSave=Load&userTableOrder=10850&tipoSeleccao=0&contexto=pq&selTab=tab1&submitLoad=true (accessed on 2 November 2021).
[17] OECD (2021), Beyond Academic Learning: First Results from the Survey of Social and Emotional Skills, OECD Publishing, Paris, https://dx.doi.org/10.1787/92a11084-en.
[3] OECD (2021), Education at a Glance 2021: OECD Indicators, OECD, https://dx.doi.org/10.1787/b35a14e5-en.
[2] OECD (2020), Education at a Glance 2020: OECD Indicators, OECD Publishing, https://doi.org/10.1787/69096873-en.
[27] OECD (2020), PISA 2018 (Volume VI): Are Students Ready to Thrive in an Interconnected World?, OECD Publishing, https://doi.org/10.1787/d5f68679-en.
[14] OECD (2020), PISA 2018 Results (Volume V): Effective Policies, Successful Schools, PISA, OECD Publishing, Paris, https://dx.doi.org/10.1787/ca768d40-en.
[1] OECD (2020), Portugal: Overview of the Education System, http://gpseducation.oecd.org/Content/MapOfEducationSystem/PRT/PRT_2011_EN.pdf (accessed on 2021).
[7] OECD (2020), “Who is expected to complete upper secondary education?”, in Education at a Glance 2020: OECD Indicators, OECD Publishing, Paris, https://dx.doi.org/10.1787/d558fe3f-en.
[20] OECD (2019), PISA 2018 Results (Volume I): What Students Know and Can Do, PISA, OECD Publishing, Paris, https://dx.doi.org/10.1787/5f07c754-en.
[24] OECD (2019), PISA 2018 Results (Volume II): Where All Students Can Succeed, OECD Publishing, https://doi.org/10.1787/b5fd1b8f-en.
[18] OECD (2019), PISA 2018 Results (Volume III): What School Life Means for Students’ Lives, PISA, OECD, https://dx.doi.org/10.1787/acd78851-en.
[16] OECD (2017), PISA 2015 Results (Volume III): Students’ Well-Being, PISA, OECD Publishing, Paris, https://dx.doi.org/10.1787/9789264273856-en.
[43] Oliveira Baptista, J. and P. Pereira (2018), Assimetrias de contexto socioeconómico entre escolas públicas - 2° cicle, 2015/16 [Socio-economic context asymmetries between public schools – 2nd cycle, 2015/16], DGEEC, Lisbon, https://www.dgeec.mec.pt/np4/407/%7B$clientServletPath%7D/?newsId=912&fileName=DGEEC_AssimetriasEntreEscolas_2_CEB.pdf (accessed on 2 September 2021).
[22] Oliveira, C. (2021), Indicadores de Integração de imigrantes: relatório estatístico anual 2021 [Immigrant Integration Indicators: Annual Statistical Report 2021], Alto Comissariado para as Migrações (ACM, IP), https://www.om.acm.gov.pt/documents/58428/383402/Relat%C3%B3rio+Estat%C3%ADstico+Anual+2021.pdf/e4dd5643-f282-4cc8-8be1-92aa499bb92f (accessed on 18 January 2022).
[23] Oliveira, C. (2020), Indicadores de integração de imigrantes: relatório estatístico annual 2020 [Immigrant integration indicators: 2020 annual statistics report], ACM, https://www.om.acm.gov.pt/documents/58428/383402/Relat%C3%B3rio+Estat%C3%ADstico+Anual+2020++Indicadores+de+Integra%C3%A7%C3%A3o+de+Imigrantes/472e60e5-bfff-40ee-b104-5e364f4d6a63 (accessed on 2 September 2021).
[35] Ormrod, J. (2008), Human Learning, Pearson.
[37] Osterholm, K., W. Nash and W. Kritsonis (2007), “Effects of labeling students ‘learning disabled’: emergent themes in the research literature 1970 through 2000”, Focus on Colleges, Universities, and Schools, pp. 3-9.
[29] Rutigliano, A. (2020), “Inclusion of Roma students in Europe: A literature review and examples of policy initiatives”, OECD Education Working Paper No. 228, https://dx.doi.org/10.1787/8ce7d6eb-en.
[39] Thompson-Hodgetts, S. and E. al. (2020), “Helpful or harmful? A scoping review of perceptions and outcomes of autism diagnostic disclosure to others”, Research in Autism Spectrum Disorders, Vol. 77, https://doi.org/10.1016/j.rasd.2020.101598.
[36] Thomson, M. (2012), “Labelling and self-esteem: Does labelling exceptional students impact their self-esteem?”, British Journal of Learning Support, Vol. 27/4, pp. 158-165, https://doi.org/10.1111/1467-9604.12004.
[12] Verdasca, J. and E. al. (2019), Relatório 2016-2018: Escolas e Comunidades tecendo Políticas Educativas com base em Evidências [Report 2016-2018: Schools and Communities creating Education Policies based on Evidence], DGE/PNPSE, Lisbon, https://pnpse.min-educ.pt/estudo2 (accessed on 5 September 2021).
Notes
← 1. See: https://dre.pt/pesquisa/-/search/488826/details/maximized (accessed on 25 August 2021).
← 2. For further information of the different strands, see the website of the Directorate-General for Education (Direção-Geral da Educação, DGE): http://www.dge.mec.pt/cursos-cientifico-humanisticos (accessed on 25 August 2021).
← 3. An early leaver from education and training, previously named early school leaver, refers to a person aged 18 to 24 who has completed at most lower secondary education and is not involved in further education or training; the indicator “early leavers from education and training” is expressed as a percentage of the people aged 18 to 24 who meet this criteria out of the total population aged 18 to 24.
← 4. In Portugal, the “grade repetition and dropout rate” (taxa de retenção e desistência) corresponds to the percentage of students who, at the end of a given school year, could not transit to the next school year.
← 5. De Almeida et al. (2021) explain that the significant decline in the number of foreigners living in Portugal was primarily due to two factors: the economic crisis and the acquisition of the Portuguese nationality by a high number of people with an immigrant background already residing in the country. During these years, Portugal had more emigration than immigration, with the revival of traditional destinations such as Switzerland, Luxembourg and Germany and the emergence of new ones such as the United Kingdom, Spain and Angola.
← 6. In Portugal, data on people with an immigrant background are mainly collected based on nationality. As such, a non-negligible share of people with an immigrant background, when they acquire the Portuguese nationality, are invisible in these statistics. In education, data mainly come from administrative data provided by public schools using a questionnaire sent by DGEEC. In this questionnaire, schools can give information on the country of birth of students and parents. In private schools, DGEEC sends a questionnaire with similar questions, but there is no information about parental birth country in these questionnaires.
← 7. Because data collected by Portugal are based on nationality, they use the notion of foreigners (estrangeiros) to describe non-Portuguese. To describe these individuals, the OECD Strength through Diversity project uses the term “people with an immigrant background”, which, however, encompasses broader characteristics than nationality. Therefore, in this report, “foreign students” refer to students enrolled in the Portuguese education system who do not have Portuguese nationality. The category “Students with an immigrant background” encompasses students who do not have Portuguese nationality as well as students who are Portuguese and immigrated to Portugal and/or have parents (2nd generation), or grand-parents (3rd generation) etc. who immigrated to Portugal.
← 8. According to Oliveira (2021[22]), this decrease was mainly due to a decrease of the overall foreign population and to a significant number of immigrants born in Portugal obtaining the nationality and disappearing from official statistics.
← 9. The PISA 2018 index of attitudes towards immigrants was derived from responses to the following statements: “Immigrant children should have the same opportunities for education that other children in the country have”; “Immigrants who live in a country for several years should have the opportunity to vote in elections”; “Immigrants should have the opportunity to continue their own customs and lifestyle”; and “Immigrants should have all the same rights that everyone else in the country has”. Responses were provided on a four-point scale: “strongly disagree”, “disagree”, “agree”, and “strongly agree”.
← 10. See: https://www.acm.gov.pt/documents/10181/52642/Publicac%CC%A7a%CC%83o+ENICC_EN_bx.pdf/c129278c-86bc-4647-88e7-f362a61c56f1 (accessed on 13 December 2021).
← 11. While this study gives an idea of the repartition of Roma communities in Portugal Mainland, results have to be interpreted with caution since slightly less than half of the Portuguese municipalities participated.
← 12. People living in households with very low work intensity are defined as people of all ages (0-59) living in households where the household members of working age (18-59) worked less than 20% of their total potential, based on the current activity status.
← 13. See: https://www.dgeec.mec.pt/np4/97/ (accessed on 25 August 2021).
← 14. See: https://www.dgeec.mec.pt/np4/224/ (accessed on 13 December 2021)
← 15. Portugal only has national examinations in 9th grade of basic education (Portuguese and mathematics) and in 11th and 12th grades of upper secondary education.