3. Four states in a comparative perspective
This chapter provides an overview of the economic and higher education characteristics of the four states participating in the review, as well as a scorecard comparing the labour market outcomes of their graduates in a national and international perspective. The chapter also summarises key policies identified in the four states that contribute to improving the alignment of higher education and the labour market. It also provides policy examples from OECD jurisdictions that offer insights on various approaches to aligning higher education and the labour market.
This chapter has two aims. First, it seeks to help policy makers and stakeholders in the four participating states compare their graduate labour market outcomes to other states and countries, and to highlight where they perform well in key areas of interest. Key outcomes are provided in a scorecard (Table 3.2) that brings together national and international comparative data on the labour market outcomes of graduates for the four participating states, the nation, and the best-performing OECD countries. Second, the chapter aims to synthesise key findings and policy options which are common to the four states in the project, augmenting this analysis with international examples. Four key areas are examined: strategic planning and co-ordination; education offerings, pathways and student supports; funding; and information.
3.1. Comparing the alignment of higher education and the labour market
Economy, population, and higher education context
Higher education graduates are, on average, rewarded for their qualifications in the labour market across the United States, as is also the case in general across OECD countries. However, a range of contextual factors influences the extent of labour market rewards for graduates in each of the four states, including their economic and social context and the resources available within their higher education systems.
Table 3.1 includes a series of indicators that shed light on each state’s context. While the indicators refer to 2018 – they do not capture the drastic economic impacts of the COVID-19 pandemic – they highlight basic features of the each state’s economy, population and higher education system.
Table 3.1 highlights important economic differences between the four states. In terms of GDP per capita, Washington tops the list (USD 68 007), while GDP per capita in Ohio and Virginia is below the US average of USD 57 052. The employment rate in all four states in 2018 was close to the national average (75.1%), with the highest rate observed in Virginia (77.8%). Annual median earnings of people aged 25-64 also vary across the states. In 2018, Ohio and Texas had earnings similar to the US average (USD 50 000), while Washington and Virginia had higher than average wage levels, particularly in Washington, where average earnings were USD 60 000, 20% higher than the national average.
While the states have been able to raise the rates of educational attainment among their adult populations over the past decade, clear differences emerge. The post-secondary attainment rate in Ohio and Texas lags behind the US average, both for the 25-34 year-old and 35-64 year-old cohorts. In Texas, the attainment rate is particularly low for associate’s degrees, and for bachelor’s degrees among the youngest age cohort (25-34), whereas the attainment rate of the 35-64 group is close to the US average for bachelor’s degrees. Conversely, the lower overall attainment rate in Ohio is driven by lower attainment at the bachelor’s degree level, as the state has similar rates to the US average for associate’s degree attainment. In Virginia and Washington, where post-secondary attainment rates are above the US average, about half of the young adult population (aged 25-34) had attained at least an associate’s degree in 2018.
Current enrolment and completion rates in the higher education system help to provide some indications of whether post-secondary educational attainment is likely to continue expanding in the near future, in light of the attainment goals set across all four states (see Section 3.3). In Texas and Washington, the share of 18-24 year-olds enrolled in some form of post-secondary education was below the national average in 2018, by almost four percentage points in Texas and almost five percentage points in Washington. Post-secondary enrolment rates for the same cohort are also below the national average in Ohio, but to a lesser extent (38.1% compared to the national average of 39.8%), and similar to the national average for Virginia (40.4%). Virginia has by far the highest completion rates within 150% of nominal programme duration in public institutions in the four states, reaching 72.8% in public four-year institutions, which is also the highest rate in the United States. In the other three states, completion rates are less favourable, with rates below the average for all public institutions in Ohio and Texas, and below average for public four-year institutions in Washington.
As shown in Table 3.1, the four states show diverse demographic profiles and migration patterns, which may boost or impede their efforts to increase the supply of skilled workforce. Texas is the second largest State in the United States, with a population of more than 28.7 million inhabitants; it also skews younger in age than the national average, with more than one-quarter of the population under 18 years old. On the other end of the spectrum, Virginia and Washington are less than one-third of the size of Texas, with 8.5 and 7.5 million inhabitants respectively, while Ohio has some 11.7 million inhabitants. Virginia, Washington and Ohio all show similar age profiles, with around 22% of their respective populations under the age of 18. Washington and Virginia also appear to have a greater ability to attract educated migrants to their states: in these states, 11.1% and 9.5% of 25-34 year-olds with a post-secondary education had migrated to the state within the past year, compared to a national average of 6.9%.
In the four states, and across the United States, the total educational revenue per full-time equivalent student, which includes state appropriations and tuition income, is similar in 2018 as it was in 2018 in nominal terms. As further discussed in Section 3.2, this reflects important reductions in state appropriations in the years following the 2008-09 recession, while the share of institutional revenue from tuition increased substantially over the same period, reflecting the wider national trend.
The level of financial resources for post-secondary education and the balance of funding sources varies considerably between the four states. These differences affect the states’ ability to expand provision and affordability for students. The total amount of available educational revenue per student is highest in Ohio, where it reached USD 15 473 in 2018, about USD 1 000 per student higher than the national average. However, the share of educational revenue from tuition is 58.9% in Ohio, well above the national average of 46.6%. Washington has the lowest overall educational revenue per student of the four states (USD 12 403), but its public institutions are less dependent on tuition, which make up 43.8% of their revenue. Public appropriations per student are the highest in Texas compared to the three other states, although the state recorded the steepest falloff in investment among the four states, with a decline of close to 20% in appropriations per student between 2008 and 2018. In Virginia, public appropriations are the lowest among the four states (USD 5 420 per student, compared to the national average of USD 7 853) and the share of institutional revenue coming from tuition had reached 63.4% by 2018, almost 17 percentage points above the national average.
Higher expenditure on tuition has in general been accompanied by growing levels of graduate debt and a greater share of students graduating with debt, although there are signs that graduate debt levels may have levelled off in recent years as states take more concerted actions to reduce the cost of college (TICAS, 2019[1]). Among the four states, the share of bachelor’s graduates with debt ranges from 48% in Washington to 60% in Ohio. Growing reliance on private financing has created concerns about the returns on investment in post-secondary education for learners, a risk that is particularly important for disadvantaged populations as discussed in the state chapters.
While the four states have placed a particular focus on raising higher education attainment, fields of study choices play an important role in meeting labour market needs. Table 3.1 shows that student choices vary significantly by state. Degrees and certificates in information and communications technology (ICT) represented 6.4% of all degrees and certificates conferred in 2018 in Washington, a share that is twice as large as that in Ohio, and notably above the US average of 4.4%. In Texas, Virginia and Washington, around 20% of students graduated in arts and humanities fields, above the national figure of 16.3%. Virginia had the highest share of degrees in education, at 6.5%, compared to 5.9% nationally and only 4.4% in Texas. While a wide range of factors shape student study choices, the four states use policies to increase awareness among students and graduates of labour market needs and to incentivise their participation in high-demand fields of study. This is further discussed in Section 3.2 and in state-specific chapters.
Scorecard on the labour market outcomes of graduates
This section uses an indicator scorecard to provide a synthetic view of the position of each of the four states within the national and (where data are available) OECD distribution on key labour market indicators. Box 3.1 provides an explanation of how the comparisons are carried out, along with some justification of the choices of indicators, while Table 3.2 presents the scorecard.
How to read the scorecard
The scorecard (Table 3.2) data for the US states and for the US average come from the 2018 wave of the American Community Survey, while information for the top-performing jurisdictions and the average for the OECD countries has been retrieved from the OECD.Stat data warehouse. Tests have been conducted to check consistency between US data and OECD data, and while the figures generated by both data sources for the US national average are close, some small variations exist due to differences in the indicators used (see Annex B for detailed definitions).
The data for the four US states are highlighted using different shades of brown to signal their position in the distribution of all US states (Washington DC is excluded). The dark brown indicates a position in the top 25%, while the white indicates a position in the bottom 25%. For earnings indicators by gender and race/ethnicity (#7 and #8), best performers are identified as countries where gaps were the smallest, hence when the value is closest to 100.
Choice of indicators
Many national and international indicators on the outcomes of graduates are readily available, including labour force participation, employment and earnings according to educational attainment, field of study, gender and race/ethnicity. While the scorecard focuses on employment rates and earnings, labour force participation rates are discussed alongside employment and earnings in each state chapter.
Employment and earnings are often used as proxies to assess the extent to which the supply of higher education graduates meets employer needs, both in quantity and quality. For example, the earnings of graduates by level and field of study provide some information about the extent to which employers need and value graduates with different types of qualifications. However, many factors other than employer demand affect graduates’ earnings. Selection effects are important to take into account: individuals with higher earning potential more often pursue higher education. However, as noted in the previous chapter, evidence suggests that the causal relationship between degree attainment and higher earnings is not due to selection (Zimmerman, 2014[2]; Ost, Pan and Webber, 2018[3]).
Important determinants of earnings exist other than individuals’ ability. For example, in fields such as education, critical shortages exist but teachers’ wages across most OECD countries, including in the United States, remain low compared to those of workers with similar levels of education (OECD, 2019[4]), in part due to the manner in which they are determined by the public education system.
Beyond indicators compiled using official data sources, alternative labour market indicators are emerging. These include career path indicators based on social network data (see, for example, Box 5.10 of (OECD, 2019[5])), indicators of employer demand using real-time job postings data provided by web-scraping services (Box 3.13), or results from employer surveys (see Section 3.3). As coverage of these alternative data sources expands and comparability improves, in the future they may become integrated into national and international evidence bases on labour market supply and demand.
Sources: OECD (2019[5]; 2019[4]); Ost, Pan and Webber (2018[3]); Zimmerman (2014[2]).
The scorecard (Table 3.2) shows that on average, completion of post-secondary education confers benefits to learners across the four states, both in terms of reducing the incidence of unemployment and increasing earnings relative to those without post-secondary education. In Ohio, Texas and Virginia, having only an upper secondary qualification results in an employment penalty of more than 16 percentage points compared to those with a bachelor’s degree; while in Washington, the gap is about 12 percentage points, according to 2018 data. Among the four states, employment rates for all levels of post-secondary education were highest in Ohio in 2018, reflecting the tight labour market in the state for post-secondary education graduates (see Chapter 4).
The median earnings data presented in the scorecard confirm the advantage for those with post-secondary education, compared to people with an upper secondary qualification only or who have completed “some college but no degree”. Importantly, individuals who have completed post-secondary credentials other than degrees, such as certificates, are categorised as having “some college but no degree” in the American Community Survey. The “some college, no degree” category thus includes both people who have taken some college courses but not completed a credential, and those who hold a post-secondary credential other than a degree. Among the four states, the financial value of achieving “some college but no degree” is highest in Texas and Washington, where the average wage premium over upper secondary education is USD 4 000 or greater. The lowest earnings premium for some college education without a degree is in Ohio, where earnings for full-time, full-year workers are essentially the same as for those with only upper secondary education. However, there is a substantial additional premium for obtaining an associate’s degree in Ohio (of USD 5 200). In Texas, the average earnings premium for an associate’s degree amounts to USD 10 000, the highest of the four states in review. The share of 25-34 year-olds with post-secondary education earning above the median salary of all earners (aged 25-64) is also above 85% in all four states, even if the values are slightly below the US average (88.5%).
Wage premia and private returns on post-secondary education in the United States tend to be relatively large compared to many other OECD countries (OECD, 2019[5]). The average gap in employment premium between upper secondary school and a bachelor’s degree in the OECD amounts to just under 5 percentage points (77.7% vs. 82.9%), notably lower than the same employment premium in all the four states. Similarly, the earnings gain from a bachelor’s degree in the United States and in all the four states is higher than the OECD average (32.5%), and reaches 73.3% in Texas.
At the same time, employment prospects and earnings in the four states vary by field of study and demographic characteristics. As in other OECD countries, business and some STEM fields show the most favourable outcomes. Employment rates surpass 90% for business and law graduates in Ohio and Washington, and ICT graduates in Virginia. Comparing earnings advantages across different fields of study with those from upper secondary only, STEM and ICT emerge as the fields with the clearest earnings advantage in the four states. Washington workers experience the largest gaps in return by field of study, where workers with a bachelor’s degree in ICT earn almost double the salary of those with a degree in liberal arts and humanities.
Other important differences in the outcomes of higher education graduates are also evident in the four states. For example, the gender gap in employment rates is larger than the national average (6.6 percentage points) in all states except Ohio, and reaches more than nine percentage points in Washington. The scorecard also shows sizeable differences in earnings across different subgroups of the population. The gender gap in median earnings for full-time full-year workers is particularly wide in Washington state, where the median salary for women is approximately 75% of the median salary for men; while it is smallest in Texas, where the median female earnings reaches about 86% of the median male earnings. Beyond gender, the scorecard shows the persistent disparities in median earnings between different racial and ethnic groups. Annual median earnings for Black/African American workers are at least USD 10 000 lower than those of White workers in all four states. The gap in median earnings between White and Hispanic workers in general tends to be narrower, but Hispanic workers still earn less on average in all states except Virginia, and the size of the disparity exceeds the national average in Texas and Washington (about USD 7 000 and USD 10 000 respectively).
The dispersion of graduate outcomes shown in the scorecard raise a variety of policy implications for states, from improving the attractiveness of occupations that currently have insufficient labour supply but high societal value, to ensuring that students are able to make well-informed decisions about education pathways, having some understanding of future employment prospects. States also face the challenge of improving equity of access and outcomes for different groups of the population, and continuing to grow the pipeline of available talent to meet current and future labour market needs. The remainder of this chapter discusses the different policy levers for improving the articulation between higher education and the labour market, and compares the policy actions that states are taking to improve strategic planning and co-ordination, enhance educational offerings, develop more effective information channels and use funding effectively.
3.2. Comparative policy overview
The labour market outcomes of higher education graduates, like the ability of employers to hire skilled workers, result from many contextual factors outside the remit of higher education authorities, such as demographic trends, migration patterns, macroeconomic conditions, employment law and labour market institutions, as well as economic policies and taxation. However, across the OECD and the United States, public officials aim to use the policy instruments at their disposal to help higher education graduates experience successful labour market outcomes and meet employers’ skills demand.
The socio-economic and demographic characteristics of Ohio, Texas, Virginia and Washington vary widely, as do the characteristics of their higher education systems and graduate outcomes. Consequently, each state faces distinct challenges that may be addressed through different policy approaches and tools. Chapters 4-7 of this report highlight the specificity of each state’s economic context and higher education system, provide a tailored assessment of the extent to which higher education is aligned with the state’s labour market needs, and offer policy recommendations for each state to help improve alignment.
At the same time, the state chapters show that certain broad challenges are common to all states. These range from the difficulty in supplying sufficient numbers of qualified workers to the state economy, persistent shortages in specific – and often similar – industries and occupations, and wide dispersion in the returns to higher education. While the mix of policies adopted by each state is distinctive, there are also common policy choices and challenges they share.
Across the four states participating in the review, policies in four areas have been identified as most consistently used to help better align higher education and the labour market. These areas are:
Strategic planning and co-ordination: The processes by which states develop a common understanding of policy problems and develop strategies to tackle them. States can use strategic planning and co-ordination mechanisms to orient the actions of higher education institutions and other stakeholders towards improving the alignment of higher education and the labour market. They can also use these mechanisms to improve co-operation among government agencies with responsibilities for education and the workforce policy.
Educational offerings, pathways and student supports: States can develop policies and programmes that ensure certain quality standards in higher education and incentivise institutions to enhance the labour market relevance of the programmes they offer. States can also create clear pathways for students between different types of programmes and institutions, and seek to ensure students receive sufficient guidance and support services to help them navigate and complete higher education successfully.
Funding: States can use public funding and the financial rules applying to higher education institutions to support the labour market relevance of their higher education system. This includes using public funding and regulation to make higher education more affordable for students, in turn helping to increase post-secondary participation and attainment. They can also direct public funding to stimulate the supply and quality of labour market relevant programmes. They can also design institutional funding and student financial assistance programmes in ways that incentivise the supply and take-up of programmes in areas of high labour market demand.
Information: Information about occupational demand and the skills employers require is a key input into higher education policy and institutional planning. For students, information on the expected returns of higher education programmes and the cost of attending these programmes can contribute to study choices that align with labour market needs. For employers, information about the skills that students develop through different higher education programmes can support better hiring and training decisions.
The following section reviews policies across the four states, and provides insights from international policy and practice. Each sub-section ends with potential success factors that states could consider alongside the state-specific recommendations provided in Chapters 4-7.
Strategic planning and co-ordination
What is the role of strategic planning and co-ordination?
As discussed in the previous chapter, state authorities are responsible for the governance of higher education. An organisational and governance structure exists in each state to co-ordinate and govern the higher education system, which is composed of public and private higher education institutions operating in their state. According to the powers conferred to them by law, state agencies responsible for higher education govern the higher education system through a range of policies in the four areas highlighted earlier: strategic planning and co-ordination; educational offerings, pathways and student supports; funding; and information.
Strategic planning refers to the stage of policy making through which public authorities set high-level priorities and goals concerning the higher education workforce. State-wide strategic planning processes can help establish a common understanding of problems, a shared vision of how to tackle these problems, and a framework within which actors inside of government and stakeholders outside of government co-ordinate with one another. While these processes are common across OECD countries, certain factors may contribute to their effectiveness as a policy tool to help align higher education and the labour market. These include:
the extent to which targets emphasise the labour market relevance of higher education as a priority;
the scope of the steering authority of higher education agencies and departments to direct actions of higher education institutions;
the capacity of higher education authorities to work across government actors with a responsibility for skills development and with broader stakeholder groups with a role in the alignment of education and the workforce.
The four states have established system-level goals for higher education with a strong focus on raising post-secondary attainment
In the four participating states, government agencies have placed a strong focus on increasing post-secondary educational attainment among the working age population. As in most US states (42 in 2019), quantitative targets for post-secondary attainment exist in all four states (Lumina Foundation, 2019[6]). As shown in Table 3.3, these targets vary in terms of the population targeted, the types of post-secondary credentials and the timeline to reach these targets.
The four states differ in the extent to which state-wide targets relate to the labour market outcomes of graduates. One of the goals of the Virginia Plan for Higher Education is to ensure that 75% of graduates earn a sustainable wage – defined as a wage at or above 200% of the federal poverty level – three years after graduation (SCHEV, 2019[9]). In Texas, no quantitative targets are set for labour market outcomes, but all public higher education institutions are required to develop and implement a process to identify “marketable skills” provided to students in each programme of study by 2020. In Washington and Ohio, the key state-wide targets focus on increasing post-secondary attainment but do not include targets related to graduate labour market outcomes.
In all four states, multi-year strategies are in place to achieve these targets that contain a series of directions or required actions to help meet them, as well as requirements to monitor progress. However, these strategies differ in scope. In Texas and Virginia, the 60x30TX plan (2015-30) and the Virginia Plan for Higher Education (2014-20) strictly focus on higher education. Washington’s Ten-Year Roadmap (2013-23) applies to the secondary and post-secondary level; whereas in Ohio, the state’s post-secondary attainment target is part of Ohio’s Workforce Transformation Strategy, created in 2018, which emphasises the need for a highly skilled workforce to meet the demands of Ohio businesses.
In all states, approaches exist to monitor progress towards the targets. These approaches help ensure that public authorities and stakeholders place continuous attention on key priorities, constitute an accountability mechanism to legislative bodies, and inform the wider public about the state’s progress in meeting its higher education policy objectives. The monitoring approaches used are relatively similar across states, including the publication of reports on an annual or biennial basis to the Legislature. Some states have also developed public-facing tools with data that enable further analysis. For example, the Washington Student Achievement Council (WSAC) monitors progress on the state’s Roadmap by publishing a Strategic Action Plan every two years providing progress updates and maintaining a Roadmap dashboard on its website, which offers information on a range of issues from graduate labour market outcomes to enrolment, completion, affordability and equity gaps. In Texas, monitoring of progress against higher education plans involves annual and final reporting. For instance, the final report for the 2000-15 Closing the Gap plan suggests a majority of targets were met (THECB, 2016[11]). The current 60x30TX higher education plan also provides an interactive online tool with updated information on its four targets alongside regular progress reports (see Chapter 5).
Thus, in all four states, selecting state-wide targets and monitoring outcomes are key mechanisms used to identify challenges that policy – alongside other initiatives – needs to remedy, and to justify the need for public investment. However, publicly funded policies and programmes supporting state-wide objectives do not appear to be systematically evaluated in any of the four states. Policy evaluations tend to occur on an ad hoc basis, often at the request of the state Legislature, and may be conducted by a legislative oversight or audit body. In Virginia, for example, the Joint Legislative Audit and Review Commission conducts programme evaluations and policy analyses on behalf of the Virginia General Assembly. In some cases, research institutes dedicated to specific policy areas may conduct policy evaluations, as with the Washington State Institute for Public Policy and the Ohio Education Research Center. The existence of dedicated bodies to conduct such evaluations may lead to more frequent and larger-scale evaluations. In some jurisdictions like Ontario, Canada, a dedicated government agency is in charge of conducting research and policy evaluation on higher education, providing a regular mechanism to assess the effectiveness of policies and promote their improvement or change (see Box 3.2).
Created in 2005, Higher Education Quality Council of Ontario (HEQCO) is an agency of the Government of Ontario with a mandate to evaluate the post-secondary sector and provide policy recommendations to the Ministry of Colleges and Universities to enhance the access, quality and accountability of Ontario’s colleges and universities.
HEQCO’s work is based on a Multi-Year Business Plan, with the latest plan spanning 2017-20. The plan identifies three long-term goals to which the activities of the Council aim to contribute:
By 2025, every Ontario student has an equal opportunity to attend and succeed in post-secondary education. Participation and graduation rates for under-represented groups will equal those of the most advantaged groups currently well represented within colleges and universities.
By 2025, every Ontario post-secondary institution annually identifies, evaluates and publicly reports on the skills and competencies its students acquired as a result of their post-secondary education.
By 2025, all Ontario post-secondary are financially sustainable and capable of delivering on their distinctive missions.
The Council’s recent research publications include for instance: Immigrant Labour Market Outcomes and Skills Differences in Canada; Gendered Returns to Cognitive Skills in Canada; and Government’s Role in Digital Learning: Review and Recommendations for the Ministry of Colleges and Universities.
HEQCO includes a team of about fifteen researchers and policy analysts and receives funding from the provincial government of about CAD 5 million annually. Each year, the Council prepares an annual report on its activities, which it submits to the Minister of Colleges and Universities for tabling in the Legislative Assembly of Ontario.
Source: Higher Education Quality Council of Ontario (2020[12]).
Based on the information available to the OECD team, it was not possible to determine the extent to which state agencies in charge of higher education requested or initiated policy or programme evaluations. This includes internal programme evaluations, which may be conducted by the state agency responsible for implementing the programme.
Despite a similar governance structure, the capacity of state government to steer the higher education system varies across the four states
The ability of governments to steer higher education depends on the legal framework that organises the relationships between public authorities and institutions. Across the OECD, the level of government influence on higher education varies considerably. As outlined in the previous chapter, the US higher education system is characterised by a high degree of institutional autonomy and generally less government steering than in many European or Asian countries. Important differences also exist between US states. As shown in Table 3.4, only 28 states have some type of state-wide entity governing higher education, which is the case in Ohio, Texas, Virginia and Washington.
Among the 28 US states with a single, state-wide entity governing higher education, 20 US states – including the four states in this review – have a single state-wide co-ordinating board; the eight other states have a governing board. States with a governing board generally have extensive authority over system-wide strategic planning, from setting admissions standards and credit transfer rules, to having a substantial degree of influence over academic programming and personnel decisions (Eckel and King, 2004[14]). State-wide co-ordinating boards play a less direct, but still significant, role in the state’s responsibilities for public higher education and, in some cases, oversight responsibilities for independent colleges (Fulton, 2019[15]). Both governing boards and co-ordinating boards typically provide budget recommendations to the state Legislature and articulate a strategic plan for the higher education system.
Within this similar governance framework, the ability of states to steer the actions of higher education institutions varies. Institutional plans are a tool used by governments to assess the extent to which institutional actions contribute to state-wide goals. These plans can include state-wide targets, institution-specific targets, involve requirements for regular updates, and may or not be tied to funding to reward institutions that meet their targets. Across the OECD, various jurisdictions have developed such mechanisms, such as Austria, Denmark, Ireland, the Netherlands or Ontario (Canada). In Ireland, as shown in Box 3.3, these plans served as a tool to develop a sustained and open dialogue between government and institutions.
Objective and approach
Performance compacts, defined through strategic dialogue between the Higher Education Authority (HEA) of Ireland and institutions, are a key instrument to help meet government policy goals in higher education policy, and improve both the accountability and autonomy of higher education institutions (HEIs). Compacts are designed within a broader System Performance Framework, which lays out key system goals and metrics since 2013. One of these key goals for 2020 relates to improving the labour market relevance of higher education. The System Performance Framework includes indicators for each system objective, with an emphasis on labour market-oriented indicators, including employee engagement and collaboration, student employment, and the alignment between the flow of graduates by field and level of study with national, regional and/or local needs.
The first cycle of performance compacts and strategic dialogue started in 2014 and was used to establish strategic engagement between HEIs and the HEA, facilitated by international peers. The first cycle included an aspect of performance funding which penalised insufficient performance and was applied to those with poor planning processes or who exhibited governance and/or financial issues. In the second cycle (2018-21), the government aims to increase the connection between compacts and national policy objectives and to step up the assessment of institutional performance. In this cycle, institutions set out more specific targets and objectives, based on the framework as well as their own strategies and strengths.
The current performance review process will provide a progress report on the institutions’ selected priorities and identify best practices that show how institutional strategic initiatives can address key national objectives. Institutions selected as having best practices, based on impact case studies they provide, were granted additional funding rewarding their performance. In 2019, EUR 5 million were allocated for this purpose.
Institutions are then categorised according to a “traffic light system” introduced to monitor progress, performance and compliance. This allows the HEA, together with the higher education institution, to take relevant action. Funding penalties in the range of 3-5% can be enacted in the case of poor performance, although these have not so far been implemented.
Lessons learnt
The compact and strategic dialogue process has enabled a better level of understanding and co-operation between HEIs and the HEA, and increased the higher education sector’s focus on meeting national strategies and objectives. The process has also become very useful in terms of identifying potential strategic initiatives implemented by individual HEIs that could be amplified as part of the development of new national strategies and policies.
Sources: Department of Education and Skills (2018[16]); HEA (2017[17]); HEA (2019[18]); Neavyn (2019[19]); OECD/European Union (2017[20]).
In both Virginia and Ohio, there is an annual planning process whereby each institution defines priorities and targets against which they are held accountable. These vary in scope and purpose. In Virginia, the Top Jobs Act requires institutions to develop six-year plans identifying specific institutional initiatives that contribute to state-wide goals, prioritise these initiatives and indicate funding needs for each initiative for the coming biennium. The Act requires institutions to submit these plans to the State Council of Higher Education for Virginia (SCHEV), which facilitates review by state policy makers. These plans are complemented by Institutional Performance Standards (IPS) establishing standard institutional targets for enrolment; total degree awards; degree awards in science, technology, engineering, mathematics and health-related fields (STEM-H); awards to under-represented groups; and two-year to four-year transfers. Institutions meeting these standards are eligible for additional funds, albeit the funds available remain small in scale.
Since 2014-15, the Ohio Department of Higher Education (ODHE) requires institutions to establish “Campus Completion Plans”, which must be updated every two years. In contrast to Virginia, no financial incentives are attached to these plans.
Texas and Washington do not use institutional plans. However, in Texas, the Texas Higher Education Coordinating Board (THECB) seeks information from institutions to monitor certain aspects of its 60x30TX plan, for instance by surveying public institutions regarding their design and implementation of a process to identify “marketable skills” across study programmes. In Washington, the co-ordination between the state agency (WSAC) and institutions differs across sectors –while no formal co-ordination mechanisms are in place between government and public four-year institutions, the State Board for Community and Technical Colleges, a Governor-appointed body, provides general oversight of the college system, allocates state operating and capital funds, and oversees policy development.
The four states differ in their capacity to join up policy efforts across education and workforce agencies, and in how they engage stakeholders in policy making
A whole-of-government approach is important to improve the alignment of higher education and the labour market, as different government agencies typically deal with primary and secondary education, post-secondary education, and workforce policies.
In some states, higher education plans and targets are developed as part of a broader state efforts to develop a strong skills pipeline, or to promote the alignment of education and the workforce. Washington’s Ten-Year Roadmap (2013-23) applies to the secondary and post-secondary levels and contains attainment targets for both. In Ohio, the state’s post-secondary attainment target is part of Ohio’s Workforce Transformation Strategy, created in 2018, which emphasises the need for a highly skilled workforce to meet the demands of Ohio businesses. This is in contrast to Texas and Virginia, where the 60x30TX plan (2015-30) and the Virginia Plan for Higher Education (2014-20) respectively strictly focus on higher education.
The way bodies responsible for higher education policy are structured also influences the opportunities and incentives for education and workforce agencies to work together. In Ohio, co-operation between the state agencies in charge of higher education and workforce policy is co-ordinated by the Governor’s Office for Workforce Transformation, which reports directly to the Lieutenant Governor. In Texas, the Tri-Agency Workforce Initiative sets shared goals for the three state agencies responsible for K-12, post-secondary education and the workforce development. A new set of objectives was announced in early 2020 by the Governor of Texas, increasing the focus of the three agencies on the labour market relevance of education (see Chapter 5). In Washington, the biennial production of a publicly available report describing current and projected gaps between the educational supply and labour market needs state-wide generates collaboration between the respective government agencies and facilitates the establishment of a common understanding of areas where improvement is needed to meet the needs of the state’s economy. In Virginia, the current Governor created the cabinet-level post of Chief Workforce Development Advisor to increase co-ordination between state agencies involved in education, training and labour market development.
Supporting the alignment of higher education and workforce needs may also require policy action across a broader range of areas than just education and the workforce. As outlined in the assessment framework of the project (see Chapter 1), various policies may have an effect on states’ ability to meet their objectives to raise post-secondary attainment and enhance the alignment of higher education with workforce needs. Policy action in areas ranging from childcare, transportation, housing or taxes can have an influence on individuals’ choices to pursue higher education, and of what type of higher education to pursue. For example, a lack of affordable childcare may motivate some students to favour flexible programmes over programmes that offer better labour market prospects. A lack of co-ordinated action across these policy areas may limit states’ success in meeting their higher education policy goals.
The alignment of higher education and the labour market requires close co-ordination with employers and other labour market stakeholders. As discussed in the state-specific chapters, higher education institutions in the four states often engage with employers in their local area to develop educational programmes, particularly in vocational and professional programmes than in general programmes. The extent to which state authorities engage with stakeholders when developing higher education policy is also critical to ensure labour market needs are identified and addressed. The regular involvement of a broad range of stakeholders can also increase the continuity of policy efforts, which can otherwise be subject to frequent changes as the state’s political landscape evolves.
In this area, the four states have an array of localised or specific partnerships between institutions and employers, often involving public agencies at different levels, as described in the state-specific chapters of this report. At the state level, board members of the State Council of Higher Education for Virginia (SCHEV), which include representatives of the business community, appear to play an active role in representing the employer perspective in higher education policy. In Ohio, the Governor’s Workforce Board brings together representatives of employers, education and training institutions and workforce development bodies to provide advice on workforce skills needs. In Washington, the development of the Washington Career Connect initiative is an example of policy development conducted through a multi-stakeholder engagement process, while the STEM Education Innovation Alliance, a multi-stakeholder partnership, advises the Governor and Legislature on policies related to STEM education on an ongoing basis (see Chapter 7). In Texas, the Tri-Agency initiative began with a stakeholder consultation process throughout the state, which resulted in a set of prime recommendations. The three state agencies reported to the Governor in early 2020, outlining actions taken to address both the initial goals of the initiatives, set by the Governor, as well as the prime recommendations made by stakeholders.
Some European countries have established bodies or mechanisms to develop and sustain strong relationships between government and stakeholders in the formulation and implementation of education and skills policies. As described in Box 3.4, Norway engages a wide range of stakeholders in a Skills Policy Council, while Germany has developed broad agreements between government and employers to significantly expand the availability of work-based learning.
Norway’s Skills Strategy, Committee on Skills Needs, and Skills Norway
Norway launched a National Skills Strategy for 2017-21 to improve the development and use of skills in the Norwegian workforce. As a result of this strategy, Norway established a number of co-ordinating bodies to improve the responsiveness of skills policies to the country’s labour market needs. A multi-stakeholder Skills Policy Council was created to oversee the Strategy’s implementation and provide input on new skills policies. The Council is headed by the Minister of Research and Higher Education, and involves a range of government members across different economic and social policy areas and the eight main social partners (including labour unions and employer associations), including a representative for regional authorities, and a representative from the voluntary sector and adult-learning associations.
The Committee on Skills Needs was established to provide the best possible assessment of Norway’s future skills needs, in order to improve the evidence base for national and regional planning and to guide individual educational choices. It gathers evidence on skills needs and skills availability in the labour market, including quantitative forecasts of supply for and demand of skills for the upcoming years. The Committee also plays a key role in co-ordinating Norwegian ministries and agencies involved in assessing and responding to skills needs, as well as in contributing to public dialogue. While the Committee was established by the government, it is not political and works independently from the government. Its secretariat is placed in Skills Norway.
Skills Norway is the directorate for lifelong learning under the purview of the Norwegian Ministry of Education and Research. It is responsible for co-ordinating priority areas highlighted in the National Skills Strategy and promoting international co-operation on skills policies. Skills Norway is currently the national representative for the European Agenda for Adult Learning. The directorate also encourages active citizenship and employability through work on recognition of prior learning, adult basic skills training, and training for adult refugees and immigrants.
Germany’s whole-of-government collaboration on skills
In 2004, the German government established the “Pact for Vocational Education and Training”. The Pact falls within Germany’s tradition of corporatist decision-making in the field of vocational education and training. After previous unfruitful attempts to establish a training levy, due to employer opposition, the Pact was designed as a new type of alliance between government and employer associations. It requires employers and government to work together to expand learning opportunities for youth in firm-based traineeships, which should eventually lead to regular apprenticeship training. However, the voluntary character of the Pact was heavily criticised by unions, which refrained from participating.
The Pact was replaced in 2014 by the national “Alliance for Initial and Further Education”, which differs mainly in that it involves unions as co-operation partners. The Alliance brings together a larger set of stakeholders to achieve consensual co-ordination. Stakeholders involved include the Federal Employment Agency, the Kultusminister Konferenz (the standing conference of the Ministers of Education and Cultural Affairs), and the federal ministries for labour affairs, business and education, as well as representatives of the Länder ministries for labour and social affairs. While the previous pacts were mainly voluntary, the Alliance passed binding decisions. For instance, the Alliance committed employers to increase the number of apprenticeship places by 30 000 on a yearly basis.
Sources: Eurydice (2019[21]); Ministry of Education and Research (2017[22]); OECD (2019[23]); Norwegian Committee on Skills Need
(n.d.[24]).
Potential success factors for strategic planning and co-ordination
In the four states participating in the review, higher education institutions have a large degree of autonomy. At the same time, state authorities have established clear targets and strategies to raise higher education attainment and meet the needs of their economies and labour markets. While specific targets or goals related to the labour market relevance of higher education or graduate outcomes are less frequent, the states’ strategies for higher education and the workforce recognise the importance of better aligning education and the labour market. These plans can be powerful tools to focus the actions of government and institutions.
Despite clear targets, significant co-ordination challenges exist, at various levels: between government and institutions; within government; and between government, institutions, employers and other stakeholders engaged in activities to align education and the workforce. Across the four states, stakeholders described this lack of co-ordination as an obstacle to policy effectiveness, by limiting the opportunity to scale up effective practices across the various regions and economic sectors of their state.
Thus, a balance must be found between the highly autonomous institutions and other actors with state-wide mechanisms that can facilitate the design, implementation and monitoring of larger-scale initiatives. Effective stakeholder engagement mechanisms can ensure that higher education policy is meeting the needs of business and society, create a sense of joint ownership of policy initiatives and strengthen trust in government (OECD, 2019[25]; Burns, Köster and Fuster, 2016[26]). Based on the analysis conducted in the four states and international examples, potential success factors to improve the effectiveness of their policies in the area of strategic planning and co-ordination of higher education include the following:
Processes to enable the connection between strategic policy that establishes key goals for higher education and the funding process to ensure capacity exists to effectively orient the actions of the higher education system towards meeting key policy goals. Approaches have been suggested for such processes, that should be carefully designed and would need a legislative basis to be sustainable (McGuinness, 2016[27]).
Processes to enable higher education agencies to regularly collaborate with agencies in charge of K-12 education and workforce development to co-ordinate with each other and with key stakeholders. Key stakeholders include higher education institutions, workforce boards, and other intermediary organisations such as non-profits, industry or professional associations that play a role in the alignment of education and workforce at the state, regional or local level. Alongside a mandate emphasising cross-agency collaboration, sufficient human and financial resources need to be available to agencies to support such collaboration.
Processes to incentivise collaboration between government agencies at the state and regional levels. For agencies working directly on education-workforce alignment, these mechanisms could include the creation of cross-agency objectives, activities and staffing positions (Federal Reserve Bank of Dallas; Center for Public Policy Priorities, 2016[28]). For example, states could consider cross-agency work to develop a single state-wide pathways framework that would make it easier for students to identify the education and training needed to pursue careers in sectors and occupations with growth potential. For agencies working on broader policy areas (e.g. housing, social supports, infrastructure), mechanisms could include regular cross-agency interactions at key points in the strategic policy process (e.g. before the adoption of a new strategic plan).
Mechanisms to ensure stakeholders can provide regular input into higher education policy and planning (OECD, 2015[29]). Approaches to promote stakeholder engagement in policy are diverse. They include, for example, multi-agency co-ordination and government-institution co-ordination to streamline consultation processes and maximise the use of stakeholder time and input; the use of financial incentives for small and medium enterprises to organise in consortia and more easily participate in consultative processes; and utilising sector partnerships as a channel to provide feedback on state-wide policy.
Educational offerings, pathways and student supports
How can policy affect educational offerings, pathways and student supports?
The delivery and content of educational programmes in all four states are primarily the responsibility of higher education institutions and their academic and teaching faculty, as institutions generally enjoy substantial autonomy in organisational, academic and staffing decisions. This is reflected in institutional initiatives to enhance curriculum design, exploit online learning, and offer guidance and co-curricular activities to students. Public policy can influence the programmes offered by higher education institutions and ensure certain quality standards; incentivise institutions to enhance the labour market relevance of programmes; create clear pathways for students between different types of programmes and institutions; and seek to ensure students receive guidance and support services to help them manoeuvre smoothly into and through the post-secondary education system (OECD, 2019[5]). By influencing the post-secondary educational offerings available, students’ ability to progress and transfer, and the level of support available to students at risk of not pursuing post-secondary education or of dropping out, these policies are all relevant in states’ efforts to strengthen the alignment between higher education and the labour market.
Programme offerings are shaped by a range of regulatory processes
Programme offerings are shaped by a range of regulatory processes, arising both from institution and programme accreditation, as discussed in the previous chapter, and from state regulatory processes.
State regulations are of two main types. States authorities often have a process to authorise new institutions, usually private or out-of-state, to operate in their state. They typically require new institutions to meet minimum standards of operation, which relate to the institution’s financial stability, institutional infrastructure, academic programmes, faculty and staff qualifications, student services, accreditation, and business practices. These mechanisms focus primarily on basic aspects of adequate provision, rather than on the labour market prospects, or outcomes, of graduates. Many states have also established programme approval processes, requiring public institutions to demonstrate that a proposed programme meets requirements regarding the programme’s focus, resources and need. The focus of programme approval is generally to ensure an effective use of public funds, in part through avoiding unnecessary programme duplication. Requirements sometimes include the demonstration of current or future labour market need.
Taken together, the processes of institution and programme accreditation and state authorisation and programme approval influence higher education offerings. However, they do not form a strategic and integrated steering process that orients the provision of higher education towards labour market outcomes. This is because they usually do not focus on labour market relevance – except in the case of programme approval – and are not co-ordinated.
Across the participating states, the Ohio Department of Higher Education (ODHE), Texas Higher Education Coordinating Board (THECB) and State Council of Higher Education for Virginia (SCHEV) all play a role in the approval of new programmes proposed by public higher education institutions. By contrast, the Washington Student Achievement Council (WSAC) does not have a role in approving programmes offered by public four-year institutions, although the State Board for Community and Technical Colleges does co-ordinate the approval of new programmes developed by two-year institutions (see Chapter 7).
Where the state has a programme approval process in place, it requires institutions to demonstrate that there is a current and projected labour market need for graduates of the proposed programme. However, none of the states participating in the review had a process in place to evaluate the continued labour market relevance of programmes once established. Whereas Ohio, Texas and Virginia have a process to regularly monitor “low-producing” programmes with low student enrolment, this process is not concerned with the labour market outcomes of graduates and no equivalent process exists to assess labour market relevance.
Across the four states, programme approval could be an important mechanism for state authorities to monitor the labour market relevance of new programmes. However, the way in which these processes are implemented, and their perceived effectiveness and usefulness, vary. In Virginia, for example, stakeholders have noted concerns about the length of time required by the state approval process, which SCHEV is currently reviewing with a view to streamlining it. In Texas, there are different programme approval processes in place depending on whether the new programme is offered by a two-year institution or a four-year institution. There is also a different, more comprehensive, programme approval process for doctoral degrees, bachelor’s degrees offered by two-year institutions, and select programmes with high operating costs.
The length of time and complexity of accreditation was viewed differently across the four states. In Texas and Virginia, stakeholders interviewed by the OECD review team voiced concerns about the delays involved in accreditation and a perceived lack of relevance of some accreditation criteria. In Washington and Ohio, stakeholders noted an evolution in their regional accreditor’s practices, with an increased focus on recognising the specific missions of institutions and of workplace success as an important metric. In all states however, institutional representatives reported responding to new labour market needs in various ways, such as creating new course concentrations (e.g. minors, micro-credentials) or expanding their offer of non-credit programmes.
In some OECD countries, regulatory processes have been used to orient institutions towards delivering labour market relevant programmes. Denmark in particular has developed a set of policies to support relevance, as outlined in Box 3.5.
Denmark has introduced comprehensive policy reforms since the early 2000s to improve the labour market relevance of higher education programmes. In the 2000s, government efforts focused on taking labour market relevance into account in quality assurance processes. This included the introduction of legislation in 2004 requiring universities to impose enrolment caps on programmes according to their labour market relevance. In 2006, the government made the inclusion of labour market relevance indicators in the accreditation processes mandatory, and included employment goals in universities’ “strategic contracts” signed between institutions and government in 2006. A legal requirement that all universities have employer panels to inform the design of programmes was further introduced in 2007.
In 2014, after Denmark went through a period of excess supply of graduates from certain programmes such as humanities and biology, intake caps were set by government based on employment rates of graduates assessed between 2 and 12 years after graduation. Institutions have, however, some autonomy on how to distribute their intake cap (up to 15%) across study programmes. This policy was accompanied by significant efforts to increase the transparency of higher education returns for prospective students, through the publication of information on earnings and unemployment as well as evaluations from alumni about their experience through a guidance tool. An evaluation of study caps concluded that the model had effectively re-oriented student choice towards high employment study fields. Between 2013 and 2016, programmes with good labour market outcomes saw applications and enrolments grow by approximately 11% and 7% respectively.
In 2017, the Danish government also implemented limits to second degree enrolment. It restricted the ability of graduates to pursue an additional fully-funded degree within six years after graduation to students pursuing fields with very low unemployment or experiencing a shortage in the labour market. In parallel, the government reformed its approach to strategic contracts with universities, shifting from numeric targets to the fostering of concrete actions for improvement aligned with institutional missions. It also introduced a portion of performance-based funding into the university funding model (7.5% of funding is allocated according to metrics such as time-to-completion, the employment rate of graduates, and educational quality).
Sources: European Training Foundation (2018[30]); Steen Roesdahl (2017[31]); Uddannelses- og Forskningsministeriet (Danish Ministry of Education and Research) (2018[32]; 2018[33]; 2019[34]).
States can use various tools to support the labour market responsiveness of higher education programmes
Higher education institutions in the United States are responsible for the development of educational programmes and the recruitment, professional development and promotion of academic faculty. Institutions, academic departments and individual faculty members thus have the largest influence on curriculum design and teaching practices. However, state authorities can use a range of policies to encourage institutions to develop programmes that are relevant to current and future labour market needs. This is done typically through block grant funding to institutions, which allows them to flexibly allocate funding in response to student and workforce demand, as well as targeted funding, notably for capital and staffing, to address need in high-demand fields. State authorities also support responsive offerings by providing a flexible framework of operation that allows them to develop innovative labour market-oriented education such as non-credit workforce and continuing education on a fee-per-service basis; innovative minors and course concentrations; or the provision of graduate certificates or digital badges.
Supply and take-up of programmes leading to high-demand occupations
The provision of labour market relevant higher education requires first an adequate supply of programmes at the levels and in the fields corresponding to occupations that are currently or projected to require a large supply of workers. It also requires that the full range of higher education programmes, whether or not they are connected to high-demand occupations, equips students with labour market relevant skills, in turn helping these graduates identify and succeed in a career that may or may not relate to their initial field of study. Labour market relevant skills involve a combination of discipline-specific (or job-specific) skills alongside a range of transversal skills, which are both cognitive and socio-emotional.
In the four states participating in this review, the supply of higher education programmes to meet labour market needs appears to be adequate, except in a small number of fields of study leading to high-demand occupations such as engineering, medicine and nursing, and ICT. Institutions across the four states reported two main types of challenges in expanding the supply of programmes in these fields: attracting faculty due to competitive salaries outside of academia and relatively high equipment and facility costs. This echoes recent research that shows that some of the highest-earning fields of study are also the most costly to deliver (Hemelt et al., 2018[35]). This creates a challenge for public authorities as they aim to support more students in enrolling in Science, Technology, Engineering, Mathematics and Health (STEM-H) programmes.
In response to faculty shortages in high-demand fields, both Virginia and Washington have recently passed legislation to increase faculty salaries. In Virginia, the Governor and General Assembly authorised in 2019 a 3% increase in general fund appropriations for college and university faculty recruitment and retention. However, this increase has been applied across all faculty and staff, rather than being targeted specifically to those fields where competition for staff is greatest. Given constraints on core institutional funding from limited increases in state appropriates and tuition moderation, the State Council of Higher Education for Virginia has invited lawmakers to consider a targeted salaries fund (SCHEV, 2018[36]). In Washington, the Workforce Education Investment Act 2019 commits over USD 40 million over two years to increase high-demand programme faculty salaries including (but not limited to) nursing educators, other health-related professions, information technology, computer science, and trades including welding.
In Virginia, the “Tech-Talent Pipeline” initiative includes state investments of up to USD 1.1 billion to increase the supply of graduates in computer science and closely related fields. For higher education institutions to be eligible for a grant from the state, each institution is required to enter into a memorandum of understanding that sets criteria for eligible degrees, degree production goals and graduation rates. Additionally, Virginia’s six-year plans with institutions are complemented by institutional performance standards that include targets for increasing degrees awarded in STEM-H fields. Institutions meeting the standards can be eligible for additional, though modest, funding.
Some OECD countries have taken steps to expand the offer of post-secondary programmes in fields of study leading to high-demand occupations and industries, often by aligning the curriculum with employer needs and incorporating a work-based learning component. While institutions are responsible for the development of these types of programmes, public funding and employer contributions often enables their expansion and quality. France and the United Kingdom offer examples of the expansion, and creation, of such post-secondary vocationally oriented programmes (Box 3.6).
The Brevet de Technicien Supérieur (BTS) and Diplôme Universitaire de Technologie (DUT)
In France, students enrolled in two-year programmes called BTS (Advanced Technician’s Certificate) and DUT (Technology University Diploma) accounted for about 14% of all students enrolled in higher education institutions in 2016/17. These programmes are attractive for both students and employers, and generally lead to quality outcomes in terms of further education and labour market opportunities. These selective short-cycle tertiary (ISCED Level 5) programmes are available in a range of study fields, combine theoretical and practical components, usually involve work-based learning as part of the curriculum, and can be completed through an apprenticeship in some cases.
DUT are delivered by University Institutes of Technology (IUT), which are part of public universities, and deliver a more general training than BTS, which are delivered in high schools. The majority of BTS holders enter the labour market after graduation, while almost all DUT holders pursue further education.
In 2018, about 61% of students enrolled in a short-cycle tertiary programme graduated within the theoretical duration of the programme, which is about 16 percentage points above the OECD average. The completion rate is higher in DUT, with over 75% of students enrolled from 2015 graduated within three years. Thirteen per cent of students who started a bachelor’s degree programme transfer to a short-cycle tertiary programme by the beginning of their second year of study.
However, the attractiveness of these short-cycle tertiary education programmes for students, universities and employers has had drawbacks. Their selectivity has increased, which hinders the participation of students from vocational and technical high school streams, as more students from the general stream of high school choose these programmes over bachelor’s degree programmes. In response, the French government revised and extended the apprenticeship and vocational education systems in 2018, and plans further reforms in the coming years.
Sources: Calmand and Lemistre (2019[37]); Eurydice (2019[38]); INSEE (2018[39]); Ministère de l’Enseignement Supérieur, de la Recherche et de l’Innovation (MESRI-SIES) (French Ministry of Higher Education, Research and Innovation) (2017[40]; 2018[41]; 2019[42]; 2019[43]; 2020[44]); Ministère de l’Éducation Nationale et de la Jeunesse (French Ministry of Education) (2019[45]); OECD (2019[4]).
Degree apprenticeships in the United Kingdom
The degree apprenticeship allows students to work part-time while studying towards a bachelor’s or master’s degree. Degree apprenticeships correspond to the highest-level apprenticeship in the United Kingdom. They represented around 3% of all apprenticeships in 2018/19. The employer and the institution providing training can make their own arrangements regarding the structure of the apprenticeship, which may take up to 6 years to complete and includes distance and blended learning options.
Government covers most tuition-related costs through an apprenticeship levy, which is paid by employers with revenue above GBP 3 million (0.5% of revenue). The amount available for employers in this category to finance apprentice training and assessment depends on the value of the levy, and a 10% top-up from the government on this amount. For smaller non-levy-paying businesses, the government finances 95% of the cost of their apprentices training, and 5% is supported by the employer. By 2020, through the levy, GBP 2.5 billion will be available to invest in degree apprenticeships.
While a job is not guaranteed upon completion, in 2018, approximately 80% of apprentices at levels 5 or higher were hired by their employer after graduation.
Sources: Department for Education (2018[46]; 2019[47]); Knowles (2020[48]); Kuczera and Field (2013[49]); National Collaborative Outreach Programme (2018[50]); Office for Students (2019[51]; 2019[52]; 2019[53]); UCAS (2019[54]; 2019[55]).
Fostering labour market relevance through work-based learning
While many higher education institutions are committed to improving the labour market relevance of their educational offerings, a frequently cited concern among stakeholders in all four states was a general lack of workplace readiness among recent graduates, in part due to weak transversal skills such as communication and teamwork. This mirrors a common sentiment among employers nation-wide and across a range of industries, as reflected in multiple employer surveys (IHE, 2019[56]; SHRM, 2019[57]; Adecco USA, 2019[58]; Manpower Group, 2018[59]). In a 2018 survey conducted on behalf of the Association of American Colleges and Universities (AACU), employers indicated that recent graduates had the skills necessary to succeed in an entry-level position, but few had the skills needed for advancement or promotion within the organisation (Hart Research Associates, 2018[60]).
These skills gaps likely result from a combination of factors, reflecting in part the complexity of the relationship between labour supply and demand. Aside from structural changes in the labour market, for example due to the long-term effects of technological change, an overall decline in employer-led on-the-job training, particularly for entry-level workers, may be a contributing factor in some widely reported skills gaps (Waddoups, 2016[61]; Capelli, 2015[62]). The implications for higher education are significant, as institutions of higher education increasingly represent the primary vehicle for the education and training of most American workers (Carnevale, Smith and Strohl, 2013[63]). To better prepare graduates for the world of work, stakeholders often called for pedagogical practices that equip graduates with labour market relevant skills and for more widely accessible work-based learning opportunities for students that offer relevant learning. Such forms of work-based learning would thus go beyond traditional student employment, in which about two-thirds of undergraduate students engage, but that is not often linked to learning (Carnevale and Smith, 2018[64]).
Stakeholders also expressed a desire for higher education institutions not only to integrate more transversal skills in technical fields, but also to integrate foundational digital skills in non-technical fields. In this regard, stakeholder feedback across the four states suggests that there is great variation in the extent to which higher education institutions, their academic departments and individual faculty members emphasise the labour market relevance of programmes. It was often identified as a greater concern and focus for action among faculty in fields of study that have clear connections to occupations, such as engineering, business, and health-related fields. In those fields, work-based learning in particular is common, often as requirement for programme accreditation. In more general fields of study, and despite the fact that employment and earnings for these graduates are generally lower compared to their peers in professional fields of study, work-based learning and other practices to enhance the labour market relevance of programmes appeared less widespread.
State authorities in Texas have encouraged higher education institutions to ensure programmes equip graduates with knowledge and skills relevant in the labour market. The Texas higher education plan, 60x30TX, requires public higher education institutions to identify and document “marketable skills” across all of their programmes. Texas also provides guidelines for several aspects of educational content at the sub-baccalaureate and baccalaureate levels, with the aim of ensuring a minimum level of knowledge, skills and competencies are developed through public higher education (see Chapter 5).
Fostering labour market relevant skills also implies that teaching faculty are well aware of skills requirements in the world of work, and are supported and incentivised to continuously update their own knowledge and skills. The hiring, training and performance management of academic faculty is the responsibility of higher education institutions, and an area where state action appeared to be limited across the four states. Institutional stakeholders met by the OECD team indicated that many faculty members express interest in regularly updating their knowledge and skills in line with labour market and industry demands, but pointed out the challenge of balancing teaching and research responsibilities with professional development. They also suggested that academic career structures often do not facilitate or incentivise a focus on building professional skills and knowledge. In this context, governments can play a role in requiring, incentivising or promoting a greater focus of faculty on the labour market relevance of their curriculum and teaching practices. Washington provides an example in this area: the State Board for Community and Technical Colleges requires faculty in the professional and technical stream to update their skills on a regular basis to maintain their status as certified faculty. In Texas, stakeholder-led programmes such as the Texas Regional STEM Degree Accelerator, an initiative that ran from 2015-18 in five regions to develop STEM degree programmes, supported faculty professional development as one of its actions (see Chapter 5). Other countries have invested in this area to foster a focus on professional development across the higher education system. Ireland, for instance, has developed a system to recognise the participation of academic faculty in professional development, and begun linking professional development to institutional performance, as shown in Box 3.7.
Ireland has placed a strong focus on enhancing the quality of teaching in higher education. Ireland’s National Strategy for Higher Education 2030 identifies teaching and learning as a core role of higher education institutions. To foster this role, the Higher Education Authority (HEA), which is the statutory funding authority and policy development body for higher education in Ireland, provided funding beginning in 2012 to launch the National Forum for the Enhancement of Teaching and Learning (the National Forum). The National Forum pursues activities in five areas: professional development; learning impact awards; scholarship in teaching and learning; building digital capacity; and partnership and collaboration.
An important activity of the National Forum has been to develop the Professional Development Framework (PDF). The PDF was established through a multi-year process of consultation, drafting and roll-out, including with various pilots. The PDF describes five domains of professional development activity:
the self (core area, relating to professional and personal values that the individual brings to their teaching);
professional identity, values and development;
professional communication and dialogue;
professional knowledge and skills;
personal and professional digital capacity.
The PDF also establishes elements of teaching performance and five associated values: inclusivity, authenticity, collaboration, scholarship and learner centeredness. The PDF aims to help instructors to set objectives and chart progress, thereby helping faculty to better determine their continuing learning needs and how they can integrate innovations in their practices. Following roll-out, the National Forum introduced an independent Expert Advisory Group to help HEIs develop their capacity to support the PDF, and also funded 22 pilot studies to explore how faculty members used the PDF. Pilot participants could develop a professional development portfolio to explore the framework domains and reflect on their practices. The evaluation of these pilots found strong support among participants with regards to short-term and, to a lesser extent, long-term impact.
Additionally, the National Forum has led the development of 15 open access 25-hour professional development programmes in teaching and learning. Subject expert teams collaborated in the design and development of these programmes, which cover an array of topics relating to reflective practice, teaching skills, specialist expertise, curriculum design and student-focused approaches. Those who complete the programmes are eligible for a National Forum digital badge.
Under the Higher Education Performance Framework 2018-20, the HEA identified implementation of the continuous PDF and the number of staff with continuous professional development digital badges by academic year as indicators of performance regarding staff capability. Another effort has focused on the development of learning awards for disciplines, building on the National Forum’s prizes for individual teachers.
Sources: Caroll et al. (2018[65]); Department of Education and Skills (2018[66]); Donnelly et al. (2018[67]); Hénard and Roseveare (2012[68]); Learning Avenue (2017[69]); National Forum for the Enhancement of Teaching and Learning in Higher Education (2019[70]).
All four states have work-study programmes that provide students with paid employment on- or off-campus to help them cover the costs of attending higher education. These programmes are modelled on the Federal Work-Study programme, a financial aid programme that is not traditionally envisioned as a skill development programme. However, some states are using work-study programmes to provide relevant work-based learning opportunities, particularly to low-income students who are traditionally targeted through the Work-Study programme. For instance, in Texas, legislation was passed in 2017 (through Senate Bill 1119) which requires annual reporting of data on the employment positions provided to students through the programme. Over time, this could help assess the extent to which the Texas Work Study programme helps provide relevant work-based learning to students. In addition, the Texas Legislature established a new internship programme in 2019 – the Texas Reinforcing Knowledge and Skills (TXWORKS) programme – to provide partly state-funded jobs that enable students to develop and strengthen marketable skills.
In Ohio, the General Assembly provided a total of almost USD 20 million from 2014-17 to support the expansion of co-operative education and other forms of work-based learning through the Ohio Means Internships and Co-ops (OMIC) programme. The available funds were allocated by the ODHE through requests for proposals, initially to individual higher education institutions and, from 2015, to consortia of institutions across the six JobsOhio regions. While in operation, the OMIC funded almost 6 500 internships and co-operatives across the state. The programme was discontinued in 2017, which the OECD team has recommended be re-evaluated (see Chapter 4).
In Virginia, the “Innovative Internship Fund and Program”, expanded in 2019 and administered by the state higher education agency, provides grants on a competitive basis to public higher education institutions to expand internship opportunities for undergraduate students through partnerships with business and public sector employers (VEDP, 2017[71]).
In Washington, Career Connect Washington (CCW) is a multi-stakeholder initiative established in 2019 that aims to significantly expand the scale of career-connected learning opportunities in the state through a system-wide approach. The initiative will received close to USD 40 million in the period 2019-21, which will support the creation of new career-connected learning opportunities, increased enrolment, supports for low-income students and those in under-served areas to participate, including for transportation, as well as start-up and capital funding (see Chapter 7). CCW has two key objectives to prepare youth for success in the labour market. By 2030, 100% of young Washingtonians under the age of 29 are expected to have completed career awareness or exploration activities (such as career fairs) or career preparation activities (such as work-based learning for credit), and 60% are expected to have completed high-quality paid work-based learning opportunities. Furthermore, by making apprentices eligible for the main state student aid programme, the Washington College Grant, Washington further promotes career-connected learning and improves access to alternative pathways such as apprenticeships.
Policies and practices promoting clear credential pathways, credit transfers and student supports can improve graduate completions and lead to better labour market outcomes
Clear and structured pathways serve to guide students efficiently into and through higher education, relying on a system of credits that can build on each other and transfer between institutions, to ensure a sufficient degree of “stackability” and mobility within the higher education system. An important mechanism to facilitate transferability are inter-institutional articulation agreements, either between individual higher education institutions, between institutions within a particular region, or state-wide. Efficient transfer processes are essential to improve students’ chances of completing a credential (Bailey et al., 2017[72]; Xu et al., 2017[73]). Improving transfer opportunities, particularly from two-year to four-year institutions, is a policy priority in all four states participating in the review.
Many states have developed a supporting infrastructure to help students and educators identify which courses can be counted towards a credential in public higher education institutions. Washington has created a set of collaborative bodies that bring the public and private sectors together, through the Joint Transfer Council and the Intercollege Relations Commission. In Ohio, the Ohio Articulation and Transfer Network co-ordinates the work of faculty in public higher education institutions in developing and applying standards for curriculum requirements, advising, credit recognition, and guaranteed transfer pathways. In a large state like Texas, regional partnerships and transfer collaboratives are common, which are based on articulation agreements between institutions within the partnership or collaborative that establish a set of pathways and transitions between secondary school districts and higher education institutions, and among higher education institutions (Bailey et al., 2017[72]). In Virginia, state authorities have used institutional planning and performance standards to incentivise greater take-up of two-year to four-year transfer opportunities, but left the development of transfer standards and pathways to institutions.
Public two-year institutions in Virginia and Washington have associate’s degree programmes – transfer associate’s degrees – that are specifically designed for transfer to a bachelor’s degree programme. These are typically part of state-wide articulation agreements that provide guaranteed transfer pathways to four-year institutions, and thus are tailored to students who have earned a transfer associate’s degree. In Virginia, transfer students who have earned an associate’s degree prior to transfer are more likely to complete a bachelor’s degree (SCHEV, 2016[74]). Though measuring transfer outcomes can be challenging, national data suggest that Washington’s transfer-out rate is relatively low, while bachelor’s completion rates for transfer students are comparatively high (Jenkins and Fink, 2016[75]). In Texas, approximately 35% of degree-seeking transfer students typically transfer out of community college to a four-year institution (Bailey et al., 2017[72]), which is not far from the national average. Because lower-income transfer students typically have poorer outcomes than high-income students, this is often an important group to target for policy intervention.
Virginia established a transfer grant programme in 2007, the Two-year College Transfer Grant, which can provide students who have earned a transfer associate’s degree with up to USD 3000 annually to be applied towards tuition at a public or private four-year institution. In addition, maintaining or increasing transfer-out rates is one of six institutional performance standards that the state has set for all public higher education institutions in Virginia. Legislation passed in 2018 requires four-year institutions to develop “transfer maps” to improve the legibility of transfer pathways for students (JLARC, 2019[76]), and a recently launched initiative in Virginia’s community college system aims to simplify the transfer process with clearer pathways and more systematic guidance to students (VCCS, 2019[77]).
Ohio has developed guaranteed transfer pathways, in which a set of courses at a public two-year college are guaranteed to transfer into specific majors a public four-year university. Discipline-specific guides specify the content and combination of courses that students need to take to be able to transfer efficiently to public four-year institutions. Similarly, in Texas, “fields of study curricula” have been developed as a framework for grouping courses that are guaranteed to transfer between any public Texas institution as part of the same field of study. Courses in career and technical education (CTE), at the sub-baccalaureate level, are typically treated separately, with their own set of guidelines and clustering of courses.
One of the challenges in ensuring clear pathways and efficient transfer processes is the potential to create confusion for students and faculty trying to navigate a complex system of credential pathways and individual transfer agreements, often based on a variety of approaches to clustering courses into broader fields of study. Thus, finding ways to streamline credential pathways within the higher education system is a challenge for all four states participating in the review. In addition, states may face challenges in enforcing guaranteed transfers. In Texas, the Legislature recently passed a bill requiring institutions to report on transfer credits that do not transfer, and why, to help monitor activity and compliance with the guaranteed transfer policy.
Structured, guided pathways through higher education are particularly important for first-generation and economically disadvantaged students who typically face additional barriers to completion and are at higher risk of incurring debt (Holzer and Baum, 2017[78]). Additional student support services, for example in the form of informational tools, guidance and counselling initiatives, can further improve the likelihood of completion, which is an important policy priority in all four states given state-wide goals to increase post-secondary attainment levels.
While the availability and quality of student support services vary across institutions, some state-level initiatives exist to encourage higher education institutions to increase their focus on non-financial student supports. Notably, the Texas Legislature recently passed House Bill 3808 requiring all public higher education institutions to designate a “liaison officer” who provides current or incoming students with information about available support services and other resources (Texas Legislature, 2019[79]). Washington is one of the leading states to implement the Guided Pathways model, a national initiative rooted in research that has identified critical factors supporting student success primarily at two-year institutions (Bailey, 2017[80]). By funding the expansion of Guided Pathways programmes to all community and technical colleges, Washington is taking a step towards a more systematic student support system. In Texas, Guided Pathways are also gaining traction across public two-year institutions at the initiative of individual institutions and with the guidance of the Texas Association of Community Colleges.
Across the OECD, several jurisdictions have taken steps to develop broad support systems that help students access and complete higher education, such as the Accelerated Study in Associate Programs implemented in several US states, which is described in Box 3.8. Some have focused on student supports to help students choose courses and programmes suited to their career goals.
ASAP was established in 2007 to address CUNY’s low completion rates and time to graduation for associate’s degree students; at the time, approximately 22% of students were graduating within three years, and about 32% within six years. ASAP’s main goal is to have at least 50% of enrolled students graduate within three years, by providing comprehensive interconnected financial, social and academic support. Participants benefit from financial aid (including fee waivers, transportation passes and free access to books) and are required to meet regularly with academic tutors, social advisors and employment specialists. The programme also encompasses a structured education pathway. This includes schedules designed to facilitate family or work obligations, capped classes, as well as mandatory attendance. The nine CUNY community colleges offering ASAP enrolled over 25 000 students in the 2019/20 academic year.
An external evaluation conducted by MDRC, using random assignment, compared the outcomes of 896 ASAP students to a comparable control group over a period of three years. The share of students graduating within three years was twice as high for ASAP students (about 40%, versus 22% for control group students). ASAP students also experienced positive outcomes in terms of transition to four-year colleges (about 25%, versus 17% for the control group), number of credits earned, and full-time enrolment rates. The evaluation shows that the ASAP model can generate positive impacts, particularly for educationally and economically disadvantaged populations (Scrivener et al., 2015[81]). A cost-benefit analysis commissioned by CUNY further highlighted that while offering ASAP requires additional expenditures, the higher completion rates and lower time to graduation result in a lower overall cost per degree than without the programme (Levin and Garcia, 2017[82]).
The ASAP model is being expanded and replicated to reach an increasing share of students. CUNY opened a programme similar to ASAP for students at the bachelor’s level, and launched a campus-wide extension of ASAP in the Bronx Community College (BCC) in 2019. BCC’s ASAP now enrols all 5 000 eligible students, representing 50% of BCC associate’s degree students. ASAP has also extended beyond CUNY – Ohio replicated CUNY’s model in three community colleges in 2015. An impact evaluation by MRDC highlighted that the programme significantly increased the graduation rate within three years (19% of students enrolled in the programme, against 8% for the control group), as well as the persistence (programme students have a higher enrolment and accumulate more credits) (Sommo et al., 2018[83]). Ohio plans to extend the programme to enrol most eligible students.
Sources: City of New York (2020[84]), Cormier et al. (2019[85]), CUNY (2020[86]; 2020[87]), Levin and Garcia (2017[82]), Scrivener et al. (2015[81]), Sommo et al. (2018[83]), Strumbos, Kolenovic and Tavres (2016[88]).
Potential success factors for effective policies related to educational offerings, pathways and student supports
Across the four states, there is widespread recognition that students need structured, guided pathways to move efficiently through the higher education system towards credential attainment. However, finding ways to streamline credential pathways and facilitate efficient transfers within the higher education system is a challenge for all four states. The level of guidance and student support varies across institutions.
Based on the analysis conducted in the four states and international examples, potential success factors to improve the effectiveness of their policies in the area of educational offerings, pathways and student supports could include:
Mechanisms to provide state authorities with an opportunity to identify programmes with poor labour market outcomes, the same way mechanisms currently exist for state-wide reviews of programme productivity or low-producing programmes. Outcomes data provided at the programme level could be utilised to identify programmes with persistently poor graduate outcomes, in turn helping institutions focus their attention where it is most needed.
Approaches to incentivise higher education institutions to encourage labour market relevant teaching and learning across all levels and fields of study. This can include supporting the recruitment of faculty in fields of study leading to high-demand occupations, the provision of high-quality work-based learning opportunities, and opportunities for faculty professional development.
Approaches to facilitate the availability of state-wide student supports that effectively target students most in need, either financially or academically, for assistance in accessing and completing higher education. There is evidence from evaluations of Accelerated Study in Associate Programs, which provide wrap-around academic and student support services to community college students, that this has doubled graduation rates in states like New York and Ohio (MDRC, 2016[89]). Some research suggests that effective student supports can reduce the public cost per degree, as the cost of intervention is offset by an increase in number of degrees produced (Scrivener et al., 2015[81]).
Mechanisms to streamline credential pathways and regional or state-wide transfer agreements between institutions. Information about pathways and transfers should be easy to understand and made available in one place for students and families to consult as they make educational and career choices. Examining transfer outcomes of community college students may be important to identify ways in which to increase transfer efficiency and boost associate’s and bachelor’s degree attainment.
Funding higher education institutions and students
How can public funding for higher education institutions and students influence the alignment between higher education systems and the labour market?
Governments can use public funding and the financial rules applying to higher education providers to support the workforce relevance of higher education systems in different ways:
They can use public funds and regulation to make higher education more affordable for students, making study more attractive to a larger proportion of the population, and thus helping to increase the supply of skilled workers. This can be achieved, for example, through subsidies to higher education institutions (allowing them to charge lower fees to students, or no fees at all), controls on cost of tuition or financial aid programmes for students in financial need.
They can also direct public funding to stimulate the supply and quality of specific programmes relevant to workforce needs that would not be provided at all, or might be provided only at a lower scale or quality in a purely market-driven system.
They can design institutional subsidies and student aid programmes to incentivise institutions and students to behave in ways that are likely to increase the supply of relevant skills. Performance-based allocation mechanisms can incentivise institutions to focus on producing more graduates or specific skills sets. Earmarked funding can require institutions to invest in capital and activities that support the development of workforce-relevant skills. Targeted student aid programmes can incentivise students to choose specific study options relevant for high-demand occupations.
Across all four states, the level of state budget appropriations to higher education institutions, the level of tuition and mandatory fees charged to students, and state student aid programmes emerge as central issues in policy discussions about college affordability and its impact on access, credential completion and the overall supply of workforce-relevant skills. At the same time, the design of public funding allocation mechanisms has been a major concern for lawmakers and policy makers seeking to promote the quality, relevance and efficiency of higher education systems in their states. Output and outcome-based allocation of institutional funding, as well as targeted funding programmes for institutions and students have been introduced – or are being considered – in the states covered by this review.
Decisions about public investment in higher education institutions and student aid over the last decade have contributed to making higher education less affordable
Public higher education institutions across the United States rely primarily on state appropriations and tuition revenue to cover the costs of their instructional activities. As shown in Figure 3.1, the average total amount of funding per full-time equivalent (FTE) student from state appropriations and tuition in public two-year and four-year institutions varies between the four states. For public two-year institutions, total per-student revenue in the financial year 2018 ranged from around 80% of the US average in Texas and Washington to 95% in Ohio. For public four-year institutions, the equivalent revenue figures vary from 85% of the nation-wide average in Ohio to just above the national average in Texas and Virginia.
Across the four states, public higher education institutions rely on different revenue sources to varying extents. Public two-year colleges in Texas, Ohio and Washington receive 70% or more of their educational revenue from public funds (state and local), while the proportion is only around 50% in Virginia. In the four-year sector, Texas also invests the most public funds per student, in dollar terms and as a proportion of institutions’ educational revenue. Whereas public funds account for 60% of institutions’ educational revenue in Texas, the equivalent proportion is around 45% in Washington and around one-third in Ohio and Virginia.
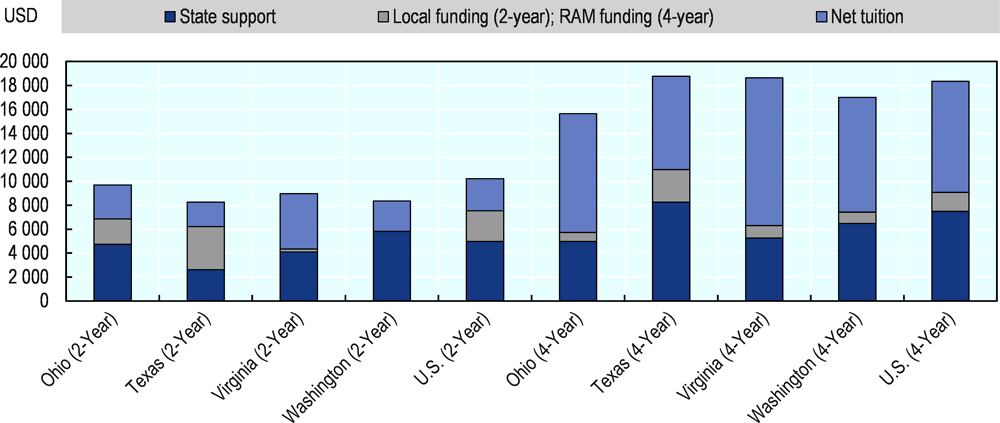
Notes: State support and local funding consist of state tax appropriations, local tax support, additional non-tax funds like lottery revenue that support higher education, and funds appropriated to other state entities for specific higher education expenditures or benefits (e.g., employee fringe benefits). Net tuition revenue is the total amount of tuition and fees minus state financial aid, institutional tuition waivers or discounts, and medical student tuition and fees. This includes revenue from in-state and out-of-state students as well as undergraduate and graduate students. While net tuition revenue reflects the share of instructional support received from students and their families, it does not consider many factors that contribute to a student’s net price and does not directly measure tuition rate increases.
Source: State Higher Education Executive Officers (SHEEO) (2019[90]), SHEF: FY 2018 State Higher Education Finance, Tables 4 and 6, https://sheeo.org/project/state-higher-education-finance/.
State educational appropriations per FTE student in public higher education institutions fell between 2008 and 2012 in all four review states, in the wake of the Great Recession and the concomitant budgetary retrenchment at state level. Over the four years from 2008, Washington saw a real-terms fall of 33% in state funding per FTE to public institutions (four-year and two-year combined), while the equivalent fall was 28% in Virginia, 25% in Ohio and 23% in Texas. From 2013-18, as a result of increasing state budgetary allocations, appropriations per student increased again, by about 30% in Washington, 20% in Ohio, 14% in Virginia and 7% in Texas, leading the levels shown in Figure 3.1.
The level of public funding per student that public higher education institutions receive in the four states is closely correlated with the level of tuition they charge students. As state appropriations declined sharply after 2008, tuition fees increased significantly. Between 2008 and 2013, the net tuition revenue per FTE student in public institutions increased in real terms by 56% in Washington, 31% in Virginia, 14% in Ohio and less than 2% in Texas, as institutions sought – to varying extents – to compensate for lost state funding. This compares with a nation-wide average increase of 26%. Between 2013 and 2018, as state funding began to rise again, net tuition revenue per FTE student in public institutions still increased in real terms by 17% in Virginia, 10% in Texas and 2% in Washington, while it actually fell by 2% in real terms in Ohio as a result of tuition moderation policy.
In 2017/18, as shown in Table 3.5, tuition and mandatory fees charged to in-state students in public four-year institutions were the lowest in Texas and Washington – the states with the highest state appropriations per student - and the highest in Ohio and Virginia. For public two-year colleges, fees for in-state students were highest, by some margin, in Virginia, followed in order by Washington, Ohio and Texas.
In the four-year sector, institutional governing boards have tuition-setting authority in Ohio, Virginia and Washington. This authority is shared in Texas between institutional governing boards and the Legislature (see Chapter 5). In the two-year sector, individual college governing boards set tuition in Ohio and Texas. In Washington and Virginia, the system-wide governing boards, respectively the State Board of Community and Technical Colleges (SBCTC) and the State Board for Community Colleges (SBCC) set tuition levels. Washington and Ohio have legislated to limit increases in tuition (for undergraduate residents in Washington, and applying to all students in Ohio). No tuition caps are currently in place in Virginia, although the General Assembly has previously made increases in state appropriations conditional on tuition moderation by institutions (WSIPP, 2019, p. 57[92]).
Discussions are taking place across the United States about establishing “free college” policies in the two-year sector. These include policies to eliminate fees in public two-year institutions or “promise programmes” aiming to bridge the gap between the student aid available and students’ costs to attend higher education (the Dallas Promise programme is an example of this). Among the four states in the review, the Governor of Virginia introduced the “Get Skilled, Get a Job, Give Back” Initiative, which would make tuition-free community college available to low- and middle-income students who pursue jobs in high-demand fields (Northam Administration, 2019[93]). Rather than a policy to eliminate or moderate fees in the Virginia Community College System (VCCS), this is effectively a proposal for an additional needs-based student support programme, complementing existing programmes, discussed below.
A majority of other OECD countries have either long-standing policies for free or very low tuition or, where substantial tuition has been introduced, as in England (United Kingdom) and Australia, comprehensive systems of income-contingent loans that effectively make studying free to students at the time of studying. As such, policy debates relating to affordability in much of the OECD take place in a very different context to those in the United States. One country that does share many similarities with the American system, but has gone further than the United States in providing public funding to its two-year colleges, is Canada (Box 3.9).
The Canadian higher education system is among the most similar to that in the United States among OECD countries, in terms of its predominantly binary structure of four-year (“universities”) and two-year institutions (“colleges”), and its funding model. Canada ranked fifth in the OECD in terms of tertiary education spending (including R&D) per student in 2016, a figure 21% lower than in the United States. Spending was equal to 2.3% of GDP that year, just behind the United States (2.5% of GDP). In Canada, provinces and territories (the equivalent of states) have exclusive jurisdiction over education and are responsible for direct transfers to higher education institutions, while the federal government provides a portion for research funding. In the majority of provinces and territories, student financial aid is funded through a mix of federal and provincial/territorial funding.
Most higher education spending in Canada comes from public sources (about 53%), compared to just over one-third (35%) in the United States (these figures include all categories of expenditure). However, there are considerable differences between provinces. Ontario (the most populous province in Canada) is more similar to the United States in its funding profile: in 2016/17, public sources accounted for about 37% of revenue to public higher education institutions. Tuition fees are significantly higher in Ontario than in any of the other large provinces (Quebec, British Columbia and Alberta).
An important difference in public funding in Canada relative to the United States is how much is spent per student on four-year versus two-year institutions. In 2016, state spending per student in the United States was approximately twice as high for public four-year degree-granting institutions as for public two-year degree-granting institutions (see above). In Canada, provincial/territorial spending per full-time equivalent student was about 12% lower for two-year institutions than for four-year institutions. In Alberta, Nova Scotia and New Brunswick, public spending per student is actually higher in two-year institutions. Canada is the world leader in attainment of two-year level diplomas, at a level almost double that in the United States, while returns to these credentials relative to high school graduates and bachelor’s graduates are stronger in Canada than in the United States.
Sources: HESA (2019[94]), Hicks and Jonker (2016[95]), Howard and Edge (2014[96]), NCES (2017[97]), OECD (2019[4]).
To compensate for the impact of (rising) tuition on the affordability of higher education for students, all four states in the review provide financial aid to students, complementing the Pell Grants provided by the federal government. The State Higher Education Executive Officers Association (SHEEO) collects comparable data from all states on state funds allocated to student financial aid. As shown in Figure 3.2, Washington has consistently invested more per student than the other states in student aid since the financial crisis. In 2018, the state spent USD 1 180 per FTE student on student aid programmes, compared to an average of US states of USD 750, around USD 710 in Virginia, USD 250 in Texas and just USD 220 in Ohio. In Texas, it should be noted that two of the programmes targeting financial need, the Texas Public Educational Grant (TPEG) and Financial Assistance Funded by Designated Tuition Set-Asides (resulting from House Bill 3015 that deregulated tuition in 2003), are categorised as “state financial aid” (THECB, 2018[98]) but are funded from institutional resources (see Chapter 5).
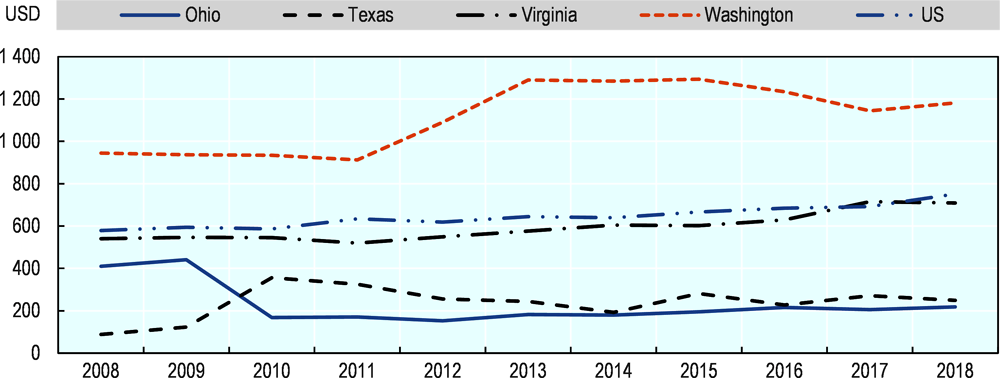
Note: Adjusted for inflation using Higher Education Cost Adjustment (HECA).
Source: SHEEO (2019[99]), Data Downloads, Tableau Visualization Data, https://sheeo.org/project/state-higher-education-finance/.
The majority of state funding for student financial aid is allocated through means-tested student support programmes. These programmes target degree-seeking, in-state students, who must first apply for federal Pell Grant funding through the Free Application for Federal Student Aid (FAFSA). Table 3.6 highlights main student aid programmes in the four states. Virginia and Texas restrict state financial aid to students attending public institutions, whereas Ohio and Washington include students in private institutions. While Ohio and Texas have set maximum amounts, which is high in the case of the TEXAS grant, the Virginia and Washington programmes cover up to the full tuition fee levels for in-state students. In Washington, recent changes were made to the Washington College Grant to transform the programme into a guarantee, whereby all eligible students are guaranteed to obtain funding, unlike in the previous programme, where some eligible students were unfunded due to the programme’s budget limitations.
While states have invested in student financial assistance to complement federal programmes, many students continue to face “unmet need” (see Box 3.10). This has prompted new initiatives to further reduce the cost of higher education, ranging from expanding financial aid programmes, as in Washington, or considering free tuition programmes, as described above.
Unmet financial need is calculated as follows:
cost of attendance (COA) – expected family contribution (EFC) = financial need;
financial need – financial aid received = unmet financial need.
The COA is calculated by institutions and typically includes:
tuition and fees;
the cost of “room and board” (or housing/living expenses for students who do not contract with the school for housing);
the cost of books, supplies, transportation, loan fees and miscellaneous expenses (including a reasonable amount for the documented cost of a personal computer);
an allowance for child care or other dependent care;
costs related to a disability; and/or
reasonable costs for eligible study-abroad programmes.
The EFC is calculated according to a formula set in law and that is reported on the Free Application for Federal Student Aid (FAFSA) form.
Several limitations of the concept have been identified:
A similar unmet need for different students can have different implications. For instance, an unmet need of USD 10 000 is different if a student is in a high-cost, selective institution with high expected earnings after graduation, or if a student attends a two-year institution with low costs and lower expected returns.
Concerns exist about the proper reporting of the EFC, and that the calculation may overstate families’ abilities to cover higher education costs, especially those with low income.
The COA, calculated by institutions, may underestimate the cost of living off-campus, which largely affects students at two-year institution institutions. Additionally, some stakeholders suggested costs such as childcare and transportation continue to be barriers, even though they are theoretically taken into account into the COA.
Sources: CLASP (2018[106]), NASFAA (n.d.[107]), U.S. Department of Education (n.d.[108]).
Other countries have explored different approaches to providing financial assistance to students, including through providing loans instead of the grants typical in state-level student support in the United States. As noted, the United Kingdom and Australia operate formal income-contingent loan (ICL) programmes, where students repay government-sponsored loans after graduation, once they reach a certain earnings threshold. The earnings threshold and arrangements for forgiveness after a specific period provide significant safeguards for students.
In Canada, several measures exist to keep federal student debt manageable, for which provincial equivalents generally exist. This includes charging no interest during and six months after studies, charging only the prime lending rate thereafter, providing tax credits on the interest portion of repayments and making low-income borrowers eligible to a repayment assistance plan, which covers the portion of their payments that is deemed unaffordable. In addition, student loan borrowers with a permanent disability can have their student loan repayments limited to what they can reasonably afford based on their family income, family size, and disability-related expenses.
Performance-based funding models are increasingly used to encourage completions, but have a lesser focus on labour market outcomes
In addition to the variation in overall level of state funding for higher education, the four states use different approaches to allocate state operating funding to higher education institutions. The main differences lie in the role of formula-based as opposed to historical allocation models and, where formulae do exist, the use of output or outcome measures, such as course completions, credentials awarded and employment outcomes, as opposed to input or process measures, such as student enrolment.
Across the United States, recent analysis shows that 47 of the 50 states have some form of performance-based formula in place for allocating at least a proportion of operating funding to two-year institutions; and 43 states use output measures in allocating funds to four-year institutions (Li, 2018[109]). While all four states in the review use some form of performance-based funding in the allocation of funds to two-year colleges, Texas, Virginia and Washington are among the seven states that do not currently have any output-based element in their university funding model. Virginian authorities are, however, currently considering a new output-based model (SCHEV, 2019[103]).
Ohio uses distinct performance-based funding formulae to allocate 100% of available state operating funds to its two-year and four-year institutions, as well as the vocationally focused Ohio Technical Centers (OTCs). By comparison, the other three states only use output measures in allocating a proportion of funds to two-year institutions and technical colleges, as outlined in Table 3.7.
The metrics used by the four states all include a focus on course and credential completion. In Ohio, progression and course completion metrics are given greater weight in the formula for two-year institutions than for four-year institutions, to allow for the fact many students in these institutions are not “degree-seeking”. The formula for all institution types gives greater weight (and thus funding) for each course or credential completed by students from “at-risk” groups, including those from low-income backgrounds, minority communities and – for community colleges - older learners. This weighting is designed to incentivise institutions to support student populations facing greater obstacles to progression and completion; evaluation shows that institutional focus on this has increased since the model’s introduction.
In the other states, the use of an output-based funding formula is restricted to a minority share of state funding to two-year institutions and technical colleges. In Texas, for instance, while 10.6% of state funding is allocated based on performance, state funding represents approximately one-third of community college funding (see Chapter 5). Texas is the only of the four states that includes a metric directly related to workforce needs, by including points for completion of credentials in “critical fields” of study, which include STEM or allied health programmes.
Both Ohio and Texas have introduced output-based funding allocation mechanisms for their vocationally oriented technical college sectors that explicitly reward colleges for the labour market outcomes achieved by their graduates. In Ohio, half of available state operating funds for OTCs is awarded based on the number of graduates successfully transitioning to employment, military service of further post-secondary study after graduation. In Texas, a “returned value” funding formula is used to determine the amount of state general revenues provided to the Texas State Technical College System (TSTCS) for instruction and administration expenditure. This uses the amount each graduate earns above the minimum wage during a fixed period after graduation to calculate an added value score for each graduate, which is then used to distribute funds between institutions. This is the most explicit attempt to link graduate employment outcomes to funding found in the four states under review.
There are risks attached to the use of performance-based funding models, including the risk that institutions seek out students with higher academic ability (a practice known as “cream-skimming”), which may result in limiting access for under-represented populations. States such as Ohio and Washington respond to this challenge by allocating points to at-risk or under-served students. None of the four states under review currently uses indicators of graduate labour market outcomes in their allocation formulae for two and four-year colleges, although the Ohio General Assembly has tasked the Ohio Department of Higher Education with exploring the feasibility of introducing such metrics (Ohio General Assembly, 2019[115]). Seven states in the United States do currently use labour market outcome metrics in their allocation formulae (TICAS, 2018[116]).
Box 3.11 provides examples from one of these states – Tennessee – as well as details of the funding allocation system used in Korea. Depending on the metrics used, linking funding to employment outcomes may create the risk that institutions seek to cut programmes that are socially important but do not lead to high earnings or focus on employment placement, irrespective of suitability of available jobs for the students in question. Ensuring that approaches are in place to mitigate these risks – including by understanding the type of employment graduates obtain – are thus important.
Performance funding in Tennessee
Tennessee was the first US state to introduce a performance-based formula for allocating funding to its public higher education institutions. The formula includes variables reflecting strategic objectives for higher education outlined in the state’s Master Plan. Between 80% and 90% of the overall state funding is delivered through the outcome-based formula.
Institutions that show above-average performance on the metrics for under-represented populations, such as Pell Grant recipients, adults over age 25, and academically under-prepared students (only for community colleges) can receive additional funding. An analysis of student-level outcomes between 2005 and 2013 illustrates significant changes in certificate completion, credit accumulation and, in some cases, degree completion in Tennessee – but causal links cannot be firmly established.
Sources: Dougherty et al. (2011[117]), Research for Action (2017[118]), Tennessee Higher Education Commission (2016[119]).
Competitive funding in Korea
Education is a national priority in Korea, with about 6% of GDP devoted to educational institutions (all levels and types of funding combined), a rate that is among the highest in OECD countries. This includes one of the highest shares of private funding in the OECD. Governance of the education system is shared between central and local authorities.
In tertiary education, government focuses on labour market relevance to address the high shares of tertiary graduates who are not employed, in education or training (NEET). Special funding is provided to the 50 universities with the best performance regarding graduate employment, the share of teachers with industry experience, and the share of students who took part in internships or fieldwork. In addition, scholarships are provided to encourage the take-up of sciences, engineering and the humanities. Tuition fees are high in Korea, and affordability is a key concern to maintain equity. In 2012, the government introduced income-contingent financial aid through the Half-Tuition Policy of the National Scholarship System. Between 2011 and 2013, the government increased its budget for scholarships by 480%. The Half-Tuition Policy allows all students to apply for and receive scholarships. It funds full scholarships for students from low-income families, and progressive subsidies for higher-income families. The policy ultimately aims to reduce total tuition fees paid by households by 50%.
Sources: Dejardins (2017[120]), OECD (2017[121]; 2017[122]; 2019[4]).
States have used targeted funding for institutions and students to incentivise institutional activities and student choices that align with workforce needs
The performance-based funding models discussed above reward institutions for the results they achieve, leaving institutions largely free to decide how they allocate resources and design activities internally to achieve these results. Targeted state funding for institutions, in contrast, earmarks specific funds for specific activities or types of activity. The four participating states have used different forms of targeted funding to support investments in activities and facilities that support workforce-relevant skills development.
Supply side: Targeted funding to increase institutional supply
Some states provide top-up funding for increasing the supply of labour market relevant programmes. In Virginia, public higher education institutions can obtain additional funding for initiatives they prioritise in every biennial update of their institutional six-year plans (SCHEV, 2018[123]). A dedicated committee, including representatives from the state Legislature, the executive branch and staff of the State Council of Higher Education for Virginia, reviews the proposed initiatives and has the ability to award a modest level of funding for the highest ranked proposals. However, the Virginia General Assembly has not always made funds available for this component of institutional funding in recent biennial budgets, which, combined with the low levels of funding involved in other years, has limited the initiative’s influence on institutional behaviour.
Ohio has used targeted funding programmes for institutions, with requests for proposals, for a number of workforce-related initiatives. The Regionally Aligned Priorities in Developing Skills (RAPIDS) programme, for example, provides targeted funding to regional consortia of public higher education institutions to invest in equipment to educate students in in-demand occupations. It requires those submitting bids to demonstrate how investments in specific items of equipment will allow students to acquire career-relevant skills that meet demonstrated need in specific industries, with a focus on the growth sectors of advanced manufacturing, robotics and cybersecurity (see Chapter 4). The Ohio Means Internships and Co-ops (OMIC) program, referenced earlier in the chapter, provided funding to enhance the capacity of campuses to build links with businesses offering internships and organise and follow up internship placements.
In Texas, targeted institutional funding is also available to enhance enrolment capacity in fields of study leading to shortage professions, though this comprises a small share of public funding. For instance, the Graduate Medical Education Expansion Grant (USD 78.6 million in 2019) provides funding to public medical schools to increase first-year residency positions, a commonly referenced barrier to the expansion of the medical workforce. The state also provides some targeted funding to institutions to provide support to students in in-demand fields. For instance, the Texas Science, Technology, Engineering, and Math (T-STEM) Challenge Scholarship Program provides funding to community and technical colleges, which allows them, in turn, to offer merit-based scholarships to high-achieving students in STEM and related fields. Participating colleges collaborate with local businesses and industry to identify local employment needs in STEM occupations and develop part-time employment opportunities for scholarship recipients.
In Washington, the Career Connect initiative outlined earlier in the chapter provides an example of an infusion of funding dedicated to expand career awareness and exploration activities, as well as work-based learning opportunities for secondary and post-secondary students under the age of 29. The funding provided includes competitive funding for organisations at the regional level to create new opportunities, funding provided to organisations that are currently delivering work-based learning, and funding to provide student supports, such as transportation, for individuals who face barriers to participating in work-based learning.
Demand side: Targeted funding to boost student awareness, choice and success
States also direct targeted funding to students to promote credential acquisition in high-demand skills fields. In Ohio, for example, the “Choose Ohio First” scholarship programme, initiated in 2008, provides scholarship funding for students studying Science, Technology, Engineering and Mathematics and Medical (STEMM) subjects in public and private universities in the state. Institutions request funding from the Ohio Department of Higher Education and are required to use allocated resources for financial assistance to students, which ranges from USD 1 500 to USD 7 995 per year. Historically, Choose Ohio First only provided funding for degree programmes, but the 2020/21 state budget extended the scope of the initiative to include funding for students in certificate programmes in STEM fields, medicine and dentistry. Ohio has also just introduced the TechCred programme to provide refunds to employers who pay for existing or prospective employees to acquire short-term certificates related to high-demand technology fields.
Virginia has also introduced a targeted student support initiative – the New Economy Workforce Credential Grant Program, branded as FastForward – to help Virginia residents gain long or short-term certificates in specified high-demand fields, provided by public two-year colleges. Students must pay one-third of the cost of the certificate programme, with state then contributing the second third if students complete the coursework for the programme and the final third on award of the certificate. The maximum award is USD 3 000 per student.
In Texas, a range of programmes channel funding directly to prospective students in fields of high labour market demand, from medicine, nursing and teaching to peace operations. The loan repayment for certain physicians is a long-standing programme and the largest of the programmes targeting occupations in shortage fields, with an investment of about USD 15 million for fiscal year 2020. Biennial surveys of physicians are conducted to determine how many continue to serve in a health shortage area. Results suggest an initially high rate of retention that steadily declines over time, from more than 90% retention in the first of the programme to about 70% during the fourth (and last) year of the programme. Retention decreases to around 40-50% three to four years after programme completion (THECB, 2018[98]). The THECB also indicated that a review of the Nursing Shortage Reduction Programme, in place since 2005, is underway.
Washington has similarly introduced several programmes to help students cover the cost of higher education programmes in fields leading to high-demand occupations, such as medicine and teaching. In addition, the state has recently placed a focus on leveraging funding from industry alongside public support. For instance, the Washington State Opportunity Scholarship, created in 2011, is funded through funds provided by industry and philanthropic organisations and matched dollar for dollar by the state. The programme supports students enrolling in aerospace, engineering, technology and health care, and focuses on low- and middle-income students. This initiative has served close to 20 000 students to date, with a large proportion of women, students of colour and first-generation college students, and positive employment and earnings outcomes for participants (see Chapter 7).
Evidence on state-specific programmes that aim to assist with loan repayment in fields facing labour market shortages is limited and evaluations are not conducted systematically. National evidence suggests that aid programmes designed to encourage entry into occupations, such as the Teacher Education Assistance for College and Higher Education (TEACH) grant programme, may not produce the results that were anticipated, due to complexity in their design and administration that leads to confusion, non-compliance and loss of eligibility among programme participants (GAO, 2015[124]). In addition, it is unclear whether programmes aimed at promoting STEM or other high-demand fields are successful in persuading students and potential students to change their choice of subject or major. For STEM subjects in particular, students’ ability to enrol in STEM programmes is highly dependent on the classes they took during high school as well as individual aptitude. Targeted scholarship funding alone cannot influence the profiles of prospective students, and must be part of a broader strategy to increase student interest in in-demand fields early in their educational experience.
Potential success factors for funding policies to support alignment between higher education and the labour market
Against a backdrop of significant cuts to state funding to institutions following the Great Recession, all four states are working to increase the number of affordable study options for students to gain post-secondary credentials, with a particular focus on the public two-year college sector. There is an increased emphasis on workforce-relevant certificate programmes, supported by targeted student funding schemes, which have the potential to be an effective way to bring under-served groups into higher education and equip them with valuable skills. In implementing strategy to increase post-secondary attainment, law and policy makers nevertheless will need to keep in mind the limits of certificate qualifications in terms of breadth of skills and long-term impact on earnings. At the same time, there are proposals in some states to further reduce the costs of attending a two-year college for low- and middle-income students in a bid to support more people to gain associate’s degrees and lower costs of transfer-based routes to gaining a bachelor qualification.
These recent or planned efforts to reduce the costs of attending a two-year college are occurring in a context where state funding per student for public higher education institutions is still well below its pre-crisis level in real terms in all four states and budgets for need-based student aid remain modest. There are no easy solutions to the challenge of increasing affordability while ensuring high levels of quality in provision. Nevertheless, potential success factors for using public funding of higher education institutions and students to support workforce alignment include the following:
Sustained commitment from law makers to ensuring the sufficiency of state appropriations for higher education institutions. Per-student funding in the two-year sector should be a special focus of attention, given the lower per-student expenditures from which these institutions start, and the key role these institutions plays in offering an entry route to higher education for under-represented populations and in meeting labour market needs in key economic sectors. Price is a factor in students’ decisions to enter higher education and affordability must be a concern for policy makers (Urban Institute, 2017[125]; Kelchen, 2017[126]; Dearden et al., 2011[127]). However, evidence shows a correlation between per-student funding and student completion (Carnevale and Strohl, 2013[128]; Goolsbee, Hubbard and Ganz, 2019[129]), and suggests that public investment in higher education institutions, allowing additional resources to be allocated to student advising and guidance, can be more effective for increasing enrolment and completion than imposing tuition cuts (Deming and Walters, 2017[130]).
Processes either to moderate student tuition across the board, while limiting negative impact on instructional quality, or to allocate additional resources to need-based student grant programmes. The latter is a more targeted and efficient way to increase post-secondary attainment than lowering tuition for all students.
Approaches to introduce carefully designed performance-related funding that use metrics intelligently to ensure institutions are also incentivised to support disadvantaged populations (Minaya and Scott-Clayton, 2017[131]). Such models should be designed in close co-operation with higher education institutions, in particular to protect institutions from financial shocks generated by sharp changes in enrolment and provide institutions with adequate resources for their core instructional mission.
Targeted funding to higher education institutions and other partners to expand the offer of opportunities for students to develop labour market relevant skills, ranging from increasing work-based learning options to incentivising students to pursue in-demand fields. Programmes to support students in choosing study fields should be designed in ways that make them easy to understand and access. They should also be developed in conjunction with broader policy efforts starting before higher education to enhance students’ academic preparedness and interest in pursuing fields of study that lead to occupations with good earnings prospects.
Information
How do data and information support alignment between higher education and labour market needs?
Providing targeted information to policy makers, educators, students, employers and other stakeholders is important to ensure transparent and accurate information about educational and occupational opportunities (OECD, 2004[132]; Musset and Mytna Kurekova, 2018[133]). Information about the skills requirements of the labour market, now and in the future, allows policy makers to ensure they have well-targeted policies in place and helps educational providers plan and adapt their educational offerings. At the same time, information about the labour market outcomes of past higher education graduates can provide an indication of the labour market demand for graduates from specific programmes or fields. Alongside information about the costs of attending higher education programmes, such information can help prospective and current students make informed choices about what to study (although it does not guarantee that they will make rational choices). As graduate labour market outcomes also depend on personal choices, economic and labour market conditions and wage levels in specific sectors, care is always needed in interpreting such data. In addition, information about the skills that students develop through different higher education programmes allows employers to make better decisions about hiring and training needs.
States are developing tools for policy makers to better understand skills supply and demand and support strategic forecasting in higher education
In the context of changing skills demand, state governments are developing approaches to monitor the state’s ability to meet the demand for skilled workers and inform strategic planning processes, often at both regional and state levels. Many states have developed interactive dashboard tools to observe and predict potential gaps in workforce supply and demand by occupation (Prince et al., 2015[134]; Wilson, 2014[135]). These tools can support policy making, but can also aid higher education institutions in the development of new programmes. While many higher education institutions engage directly with employers and conduct their own labour market analyses to inform programming and curriculum design, they also rely on public workforce data and labour market information, which underscores the importance of ensuring accurate and easily accessible information about the labour market and state-wide workforce needs.
All four states participating in this review have made higher education data publicly available through interactive data platforms or dashboards and have attempted to connect these data to information on workforce needs to provide an indication of potential gaps in skills supply and demand. Basic workforce supply-demand analyses may, for example, match records of credential production by field of study to occupational projections in order to indicate future gaps in supply and demand (Wilson, 2014[135]). In Texas, a labour gap analysis tool estimates current and anticipated labour gaps for major occupational groups and career clusters. Estimates of anticipated labour gaps are based on average projected annual job openings by occupation (demand side) and higher education data of annual graduates by programme of study (supply side). Ohio received support from the National Skills Coalition to create its workforce supply tool, which was developed as a “one-stop-shop” for information about workforce needs for educators, businesses, career counsellors and job seekers. Information is provided for the state as a whole and by region. In Virginia, the State Council of Higher Education for Virginia recently launched an initiative to identify data needs related to workforce supply and demand. In addition, the state’s employment agency is developing a methodology for linking the production of credentialed graduates from Virginia’s higher education institutions to projected employment demand, as well as injecting known in-migration patterns, by occupation.
In Washington, a workforce supply-demand analysis is conducted every two years as a joint agency initiative, using both national- and state-level data (WSAC, SBCTC and WTECB, 2018[136]; Hershbein and Hollenbeck, 2015[137]). To estimate future gaps, Washington considers that a proportion of completers will not enter the labour market and that some post-secondary completers are upskilling and not available for new jobs. Washington’s supply-demand analysis also permits the identification of “high-demand fields”, which are occupational groupings mapped to broader fields of study. Occupational groups are considered to be in high demand when the gap between the supply of graduates and projected annual openings is equal to or exceeds 15% of the total number of projected annual openings.
However, there are important limitations to using these tools to inform policy and programme planning. There is not always a one-to-one relationship between fields of study and occupations or jobs, particularly in fields such as the social sciences, humanities and liberal arts. While forecasting the number of nursing graduates required to meet state needs is closely tied to current and projected occupational demand, graduates of a large range of programmes – from business to social sciences– may enter a wide range of occupations (Coffey, Sentz and Saleh, 2019[138]). This kind of flexibility in the labour market is desirable, but makes it difficult to assess the adequacy of the supply of graduates in general fields of study compared to employer demand. In addition, these tools do not always consider migration of skilled workers into and out of different occupational groups, which affects the supply of labour.
Another limitation relates to the occupational information as the main source of data for skills demand, which does not necessarily capture a sufficient level of detail to understand variations in skills demanded by employers. This could include, for example, differences in skills demanded for different jobs within the same occupation, or changes in skills demanded in the same occupation across different geographic areas. The need for increased data granularity is discussed in the next section.
Thus, supply-demand models and gap analyses can provide an indication of where there is likely to be considerable misalignment between labour market demand and the supply of credentialed graduates. To inform policy, however, these models should be supplemented with other qualitative and quantitative information (Goldman et al., 2015[139]). Governments across OECD countries have taken different approaches to improve their ability to understand labour market needs. The Labour Market Information Council (LMIC) in Canada, created in 2017, exemplifies efforts of the federal and provincial governments to develop higher quality information on labour markets and evaluate the ways in which different groups can most effectively use labour market information in their decision making (see Box 3.12).
The LMIC is a non-profit organisation that conducts and communicates research on the Canadian labour market to better understand what kind of labour market information is most relevant to users. The LMIC has identified criteria for good quality labour market information, which include the availability of information at the local level, its granularity, frequency and timeliness. The LMIC platform includes a LMI Interactive Dashboard, which examines how seven different stakeholder groups (students, parents, employed, unemployed, persons with disabilities, recent immigrants and recent graduates) perceive the access, readability and impact of labour market information. It also includes a LMI employer dashboard, which provides information about how over 3 000 employers in Canada obtain, perceive and use labour market information in their recruitment processes.
The Council’s Board of Directors includes fifteen government officials, representing each province and territory, the federal government and the national statistical body (Statistics Canada), with the support of a National Stakeholder Advisory Panel, which includes non-government representatives, and a Labour Market Information Experts Panel, which provides methodological advice.
Sources: Labour Market Information Council (2019[140]), OECD (2018[141]).
Increased data granularity is needed to help policy makers and educators understand the skills demanded by employers
Many OECD countries and US states are exploring alternative approaches to understand the rapidly changing skills demand in their labour markets and complement supply-demand tools based on occupational projections. The use of unstructured data sources is of increasing interest to policy makers, higher education institutions and other actors with an interest in better understanding skills demand. Virginia and Washington both received support from the National Center for Higher Education Management Systems to develop a dashboard system based on graduate (supply side) data from the Integrated Post-secondary Data System (IPEDS) matched with real-time data from job advertisements (demand side) provided by Burning Glass Technologies (BGT).
Real-time labour market data may capture more granular information about the types of skills, certifications and qualifications that employers seek. (See Box 3.13 for a preliminary analysis of changing skills demand in the four states.) State higher education, workforce or economic development agencies may contract with commercial services such as BGT or Economic Modeling Specialists International (EMSI) to use their data for labour market and skills needs analyses, either systematically or on an ad hoc basis (Goldman et al., 2015[139]). Moreover, applying this kind of data to skills need analyses may also help educators to align curriculum more closely with the skills that employers are seeking, contributing to improved labour market outcomes for both graduates and employers (Dorrer, 2016[142]).
Employers increasingly use online platforms to disseminate job postings, particularly for jobs requiring a higher education qualification. The availability of millions of online job postings thus constitutes a new source of data that has the advantage of providing information in real-time and at a high level of detail. This type of data also involves limitations; for instance, when job postings imply information, such as a higher education requirement for a medical doctor, inferring the demand for higher education graduates directly from the data will yield biased results. Moreover, the job postings do not directly represent labour demand as they provide hiring information but no information on job separations. Despite its drawbacks, this type of data can offer valuable insights on employer demand when used alongside traditional, representative survey data.
The OECD has begun undertaking analysis using data provided by Burning Glass Technologies, which collects and categorises information daily from job postings taken from over 40 000 online sources using machine-learning techniques, after excluding duplicate postings that appear on multiple websites.
In an ongoing OECD analysis, the skills requirements for job postings with a higher education requirement are examined for Ohio, Texas, Virginia and Washington. The skills information provided in job postings is classified in four categories: cognitive skills; socio-emotional skills; technical, transferable skills; and technical, job-specific skills. The first three categories are considered transferable skills that are valued across a range of occupations, whereas technical, job-specific skills are particular to certain occupations. The analysis comprises three parts: i) a study of skill variation across occupations and states, with a particular focus on transferable skills; ii) an examination of the occupational and skills demand for graduates from more general fields of study; iii) an exploration of the qualifications and skills required for jobs in ICT occupations. The results will be published in Q2 2020.
Source: Brüning and Mangeol (forthcoming[143]).
In some jurisdictions, employer surveys are used to obtain employer input on the skills they need, and their perspectives on the skills of higher education graduates. In Washington and Texas, state-wide graduate outcomes surveys have been conducted on an ad hoc basis, for example for a particular sector (public two-year institutions) or for a particular purpose. However, systematic, state-wide graduate or employer surveys are not currently conducted in any of the four states. The General Assembly of Virginia recently granted funding for the development of a graduate outcomes survey that aims to collect information on whether or not graduates have secured employment related to their degree. The survey is currently designed to be a one-off activity and will be developed by the State Council of Higher Education for Virginia in collaboration with the Virginia Economic Development Partnership. This will obtain more detailed information on graduates’ post-graduation employment trajectories and their engagement in “civic life” (SCHEV, 2019[144]).
As outlined in Box 3.14, Australia and the United Kingdom have developed nation-wide employer and graduate surveys. These surveys can provide valuable insights into the planning of education and skills policies and programmes. For instance, a stakeholder consultation held in 2017 in the United Kingdom indicated that national, regional and local skills and economic development agencies leveraged the insights from the employer skills survey in their work. It also highlighted some limitations, such as the reliance on employer perceptions, the lack of common job tasks definitions, and challenges in obtaining information on items such as training costs (London Economics, 2017[145]).
Australia’s Employer Satisfaction Survey
Since 2016, the Australian government has funded an annual survey of higher education graduates and their employers. The Employer Satisfaction Survey (ESS) is the first national survey that directly links the experiences of graduates to the views of their direct supervisors. The ESS is conducted on a systematic basis by asking employed graduates who participated in the Graduate Outcomes Survey (GOS) four months after graduation to provide the contact details of their supervisor for follow-up. In 2019, the survey gathered responses of 4 500 employers.
The survey provides information about employer satisfaction with the graduate’s skills overall and broken down by specific skills. These include foundational skills (e.g. literacy, numeracy, communication, and the ability to investigate and integrate knowledge), adaptive skills (e.g. the ability to apply skills/knowledge and work independently), collaborative skills such as teamwork, technical skills, and employability skills, such as the ability to perform and innovate in the workplace. The survey permits an analysis of employer satisfaction by institution and field of study, and offers insights about graduate and employer perceptions of the importance of the graduate’s higher education qualification for their current job.
The United Kingdom’s Employer Skills Survey
The United Kingdom has a long tradition of surveying employers. The Employer Skills Survey has been conducted nation-wide every two years since 2011 and is designed to ensure a balanced representation of employers, in terms of size, sector, geography, training provided, and across the private, public and non-profit sectors. It is conducted at the establishment level, and covered 87 000 establishments in 2017. The questionnaire takes 20 minutes to fill and is administered by research firms contracted by the government, which collect the responses through telephone calls.
The survey covers a range of questions regarding recruitment and vacancies, qualifications and skills of employees (including mismatch between qualifications and skills and job requirements), skills gaps, employee training, and the prevalence of high-performing practices in the work place. The survey provides information on the incidence and density of particular challenges; for instance, it allows for the analysis of the proportion of establishments reporting at least one hard-to-fill vacancy (incidence) and for hard-to-fill vacancies as a proportion of all vacancies.
Sources: Australian Department of Education and Training (2018[146]); IFF Research - Department for Education (2018[147]; 2018[148]); QILT (2019[149]).
Accurate and user-friendly data on graduates’ return on investment is important to inform the educational choices of students and families
Providing accurate information on graduate outcomes including employment, earnings and debt levels
While several factors such as individual choice and local labour market conditions influence the outcomes of graduates in the labour market, graduate earnings and employment outcomes provide an important indication of how graduates are valued in the labour market through the skills they bring to the workplace. Along with information about the cost of study, options for financial aid and expected debt levels, information about labour market outcomes is important for students and families to assess the potential returns on investing in higher education.
To develop information about graduate outcomes, many states have invested heavily in building linked education and employment information systems, and platforms displaying the information they yield. Ohio, Texas, Virginia and Washington all have state-wide longitudinal data systems that link administrative data on earnings from Unemployment Insurance (UI) wage records with student-level data from higher education institutions. It is estimated that administrative earnings data generally capture about 80% of the workforce (Pena, 2018[150]). Wage records do not provide information on all graduates who move out of the state, those who are self-employed, or federal civilian and uniformed military service members. These remain important gaps in state post-secondary data systems. As discussed in Chapter 2 (Section 2.4), the federal State Wage Interchange System (SWIS) Data Sharing Agreement provides some access to wage data for graduates who live in other states, to a limited extent. In addition, the degree of coverage by institution type and level of disaggregation of the data varies across the states. The most recent survey of state post-secondary data systems conducted by SHEEO shows that many states provide coverage of both public and private not-for-profit higher education institutions in their post-secondary data systems (Whitfield, Armstrong and Weeden, 2019[151]). In Virginia, for example, earnings data are provided across all public and private not-for-profit institutions at the programme level; whereas in Washington, earnings data are made available by major or field of study only for graduates from public institutions. Similarly, in Texas, longitudinal graduate earnings data are available mainly for graduates of public institutions.
Obtaining accurate and informative data on the employment outcomes of graduates – for example, whether they are working in their field of study or in a job commensurate with their qualification level – is often more challenging (TICAS, 2018[116]). At the national level, graduate employment outcomes are surveyed through the National Association of Colleges and Employers (NACE) First-Destination survey, which is designed to obtain information about whether or not graduates have found full-time employment, are seeking continuing education or still looking for work six months after graduation. It does not attempt to measure over-qualification or underemployment. At the state level, Unemployment Insurance (UI) wage records used to obtain graduate earnings information typically indicate the industry in which an individual is employed, but do not provide information on their occupation or field of work. Thus, it is difficult to assess whether or not a graduate is employed in an occupation that matches his or her field of study. In order to obtain more detailed information on in-field job placements, higher education institutions typically use alumni surveys. However, these data can be unreliable due to low response rates.
Texas tracks graduate outcomes for both public and private institutions one year post-completion to monitor whether graduates are working or enrolled in further study (within the state). The University of Texas system is also participating in the Post-Secondary Employment Outcomes (PSEO) project, a partnership between the US Census Bureau and several states and post-secondary institutions. This project sheds light on graduate trajectories after graduation for the period 2001-16 and aims to fill key information gaps by tracking students who work outside of the state in which they studied, and by providing information about the firm’s industry sector and geographic location (Foote et al., 2019[152]).
Furthermore, because of rising student debt levels and growing public concern over the cost of higher education in the United States, reporting accurate information on student debt alongside earnings data is critical. Students can benefit from access to reliable data about tuition and fees, average debt and loan repayment levels, earnings, and employment outcomes in order to increase their awareness of the expected rates of return on post-secondary education. Thus, information on graduates’ return on investment is an important labour market metric that should be included in post-secondary longitudinal data systems (TICAS, 2018[116]). For example, information about student debt levels and loan repayment is not always easily accessible or available by programme level in the four states participating in this review. According to the SHEEO, many states struggle to find ways to report accurate information on student debt and loan repayment. SHEEO suggests strengthening state agency capacity to collect this kind of information, by acknowledging gaps in student financial indicators and publicising plans to collect and report this data (Whitfield, Armstrong and Weeden, 2019[151]).
Easily accessible and user-friendly information
Despite the availability of a wide array of information sources on labour market outcomes, tuition and fees, financial aid options, and sometimes debt and loan repayment information, it is not always easy for users to access or understand, which may limit its use by students and families. There have been attempts to enhance the transparency of higher education outcomes and costs, notably through the College Scorecard, a tool funded by the US Department of Education (see Chapter 2). The Scorecard connects institutional-level data about higher education requirements, costs and labour market outcomes. Programme-level data on earnings and debt have also been made available in 2019 through the Scorecard. While this new information holds significant promise for students and families to better understand and compare the returns on investment of different programmes, this information is currently only available in a downloadable “test” version.
Across the four states, student-oriented information about educational opportunities is not always linked in an easily accessible way to data on graduate labour market outcomes or information about employment prospects (for example, occupational projections and in-demand fields). While the resources made available through the states’ post-secondary data systems are comprehensive, they often appear to be mainly targeted towards educators and policy makers. These data often include relevant information about labour market outcomes that could be made available to students in an easy-to-access manner as part of the information they consider when exploring educational opportunities. For example, Washington’s Roadmap dashboard, which includes information about projected supply and demand, is a tool targeted mainly to policy makers and educators and does not appear to be connected to information about educational options that is targeted to students. In Texas, an attempt to combine resources on one site is under development, and multiple sites exist that are targeted to different users with various sources of information.
There are also challenges with respect to the choice of measures in the information to present on public-facing websites. For instance, while short-term measures such as the earnings of recent graduates may be of most interest to students, the long-term earnings may be a more reliable measure to understand the career prospects of a certain programme. Another challenge relates to the selection effect that skews the outcomes of graduates in high-earning fields of study. The raw earnings difference between programmes should thus be interpreted with caution, as they are not necessarily the earnings all students can expect. In this respect, providing information on the academic requirements alongside earnings data is important to contextualise this data.
The provision of accessible and user-oriented information has been a widely shared priority among OECD countries, often in partnership with the private sector. In some countries, governments have funded innovative approaches to provide targeted information to students. In the Netherlands, a combination of measures are used to try to help students choose the right programme, as outlined in Box 3.15.
Study Choice 123: Providing information on educational pathways and labour market outcomes
Stuediekeuze 123 (Study Choice 123) is an independent, publicly funded tool launched in 2006. It supports student choice by providing web-based tools to compare study programmes and educational pathways, based on specific indicators. The website targets prospective students in the process of making educational or career choices, and presents information that is tailored to user needs through customisation tools (including personality tests and “select-and-compare” tools).
At the programme level, comparable indicators on courses comprise information on programme availability, requirements, content and completion rates. Labour market information is provided at the study level (by study field), and includes results of alumni surveys (gross earnings, most chosen occupation, unemployment rates, labour market prospects) and employment forecasts. These forecasts include five-year employment prospects, sensitivity of the occupations in the field to economic change, and potential pathways to different jobs and positions.
The Study Choice Check: Assessing students’ interests and abilities
The Studiekeuzecheck (Study Choice Check) was established by the 2013 Law on Higher Education in the Netherlands. It requires higher education institutions to offer a package of activities enabling prospective students to assess whether their skills and interests fit with the programme to which they are applying. The Study Choice Check intends to decrease the time to graduation and address dropout rates by supporting students in their decision-making process, ultimately facilitating their path to a career that matches their chosen field of study. Some programmes require students to complete the Study Choice Check before enrolment.
Students can benefit from at least three checks (i.e. for three programmes), taking place after high school graduation. The Study Choice Check can include activities such as an initial questionnaire about the student’s study plans, motivation and skills, or a homework assignment. For each institution of interest, students can benefit from talking with representatives of the university, meeting fellow students, or experiencing, for at least a full day, the programme of their choice.
Students are provided with an individualised report resulting from participation in these activities. This report highlights how the student’s interests and abilities fit the content and requirements of the programme they have pre-selected, and what skills the student should develop within and/or outside the programme, to be successful in the programme and secure good labour market outcomes. The decision to accept or reject the institution’s advice on one’s suitability with the programme remains with the student and does not breach the Dutch open access policy; except for capacity-constrained programmes, students can enter higher education upon the completion of secondary education.
Sources: OECD (2019[5]); Studiekeuze123 (2020[153]).
Developing effective approaches to skills signalling is becoming increasingly prevalent
Signalling skills content of higher education qualifications to employers
In all four states, stakeholders highlighted the importance of helping graduates effectively communicate the labour market value and skills content of their credentials to employers. In Texas, the state’s current higher education plan requires all public institutions to identify and document the “marketable skills” that each degree programme will provide to students, enabling them to market themselves effectively to employers. The Texas Higher Education Coordinating Board (THECB) monitors institutional progress on the creation and implementation of these processes, and facilitates discussions on practices. The THECB has defined marketable skills as “those skills valued by employers that can be applied in a variety of work settings, including interpersonal, cognitive, and applied skill areas. These skills can be either primary or complementary to a major and are acquired by students through education, including curricular, co-curricular, and extracurricular activities” (THECB, 2015, p. 22[8])
Many higher education institutions in the United States have developed innovative approaches to skills signalling by using digital student records, skills inventories and other tools to engage employers and help students connect with them. For example, comprehensive learner records (CLR) enable students to share a verifiable record of their academic achievements. With consent, the CLR gathers data about a student’s performance beyond just grades, with the ultimate goal of communicating the student’s entire learning experience (Educause, 2019[154]). Some states have tried to facilitate or support this activity by establishing state-wide credential or skills inventories, which seek to standardise and harmonise different types of qualifications and skills. In Washington, the Workforce Training and Education Coordinating Board launched the development of a credential inventory that will include a registry of degrees, certificates, licenses, apprenticeships and micro-credentials. In Texas, the Texas Workforce Commission supported the development of a skills inventory for the Texas State Technical College System with skills that are validated by employers and can help educators align curriculum content with labour market needs.
Demand for specific, often ICT-related, skills may also be contributing to intensifying interest in so-called “alternative credentials”, both within and outside the post-secondary environment. Alternative credentials, such as micro-credentials, digital badges and industry-recognised certificates, have been touted as a way to fill a gap between the programmes that higher education institutions provide and the skills that employers seek; as a way of increasing the efficiency of higher education systems by offering more highly targeted training than traditional degree programmes. Many higher education institutions interviewed by the OECD team reported they are responding to this need by offering additional specialisation tracks, badges or certificates – for example, in data science or artificial intelligence – for degree-seeking students across multiple fields of study.
According to a study conducted by the Corporation for a Skilled Workforce and the Lumina Foundation, professional certificates across more than 16 industry sectors, such as health care, ICT and manufacturing, have been embedded into study programmes offered by higher education institutions in the United States (Zanville, Porter and Ganzglass, 2017[155]). A Pearson VUE survey also shows that one-quarter of the respondents with at least one IT certificate pursued their certificate as a result of an academic programme or course in which they were enrolled (Pearson VUE, 2019[156]). To date, these types of micro-credentials serve mainly to supplement other degrees or credentials and are valued by employers as such (Gallagher, 2018[157]), as outlined in a recent OECD study (2020[158]), although they have the potential to serve as a substitute for some higher education qualifications in certain circumstances (see Box 3.16).
The emergence of alternative credentials
So-called “alternative credentials” – such as micro-credentials, digital badges and industrial certifications – have proliferated as a consequence of a rising demand for upskilling and reskilling, as well as a sharp reduction in the unit cost of education and training provision made possible by digitalisation. According to a recent OECD study on alternative credentials, these new credentials do not yet serve as an “alternative” to a formal higher education qualification; rather, they serve to complement prior education, training and experience. However, factors that may limit the labour market relevance of these credentials include employers' unfamiliarity with these credentials, confusing signals caused by lack of standardisation, the frequent absence of validation procedures, and the lower signalling value of these credentials compared to other factors, such as professional experience.
However, alternative credentials may have a near-term potential to become a substitute for some formal higher education qualifications in selected sectors where alternative credentials are well recognised, and are successful at attracting non-traditional learners, such as the ICT sector. Similarly, micro-credentials that attempt to substitute for substantial parts of formal higher education programmes (e.g. MicroBachelors and MicroMasters programmes offered through an online learning platform, EdX) may be able to provide learners with skills and quality signals faster and at lower prices than traditional higher education programmes.
The development of credential inventories and criteria
In 2013, a non-profit organisation, Credential Engine, started developing an online registry with information about post-secondary credentials, including alternative credentials. It aims to help learners find post-secondary credentials that match their needs, by allowing them to compare information about credentials, including learning content, requirements, estimated time to earn, estimated costs and graduates' labour market outcomes.
With funding from Lumina Foundation, Rutgers’ School of Management and Labor Relations developed a conceptual model of non-degree credential quality in 2019. The conceptual model identifies four steps in the provision of non-degree credentials, with set indicators in each step: 1) designing credentials, 2) developing competencies, 3) being exposed to the labour market, and 4) leading to economic and social outcomes.
The Council for Higher Education Accreditation has listed possible quality criteria for alternative credentials in their 2019 publication. Additionally, the International Organization for Standardization has been working on setting minimum requirements for learning provided outside of formal education (such as the ISO 29991:2014 and the ISO 29993:2017).
Sources: Credential Engine (2019[159]); International Organization for Standardization (2017[160]); Kato, Galán-Muros and Weko (2020[158]); Van Noy, McKay and Michael (2019[161]).
Signalling skills to higher education institutions based on prior learning and alternative credentials
While less frequently discussed during OECD interviews with US states, recognising individuals’ existing skills and competencies for the purpose of pursuing higher education has been a long-standing effort in some OECD countries. In Europe, in particular, governments have actively supported the development of tools that aim to encourage individuals to pursue higher education through the recognition of prior learning, whether formal or informal. The prevalence of national qualifications frameworks, which are used to classify a country's qualifications at different levels, alongside the learning outcomes expected at each level, has facilitated processes of prior learning recognition and assessment. Box 3.17 describes examples in France and Quebec, a Canadian jurisdiction that has developed mechanisms of prior learning recognition in a context where no national framework of qualifications is in place. In the United States, national actors such as Lumina Foundation have been paying increasing attention to the challenges posed by the absence of such frameworks, particularly in a context where the provision of alternative credentials is expanding rapidly, and more often outside of higher education. This challenge also highlights opportunities to leverage technology to develop such tools in the American context (Travers et al., 2019[162]).
Prior Learning Assessment (PLA) involves the review and formal recognition of knowledge, skills and competencies obtained through previous formal, and especially informal and non-formal learning. The basic purpose of PLA is to improve the accessibility and efficiency of education delivery by ensuring learners do not have to take courses on what they already know, and often to tackle inequities in supporting those with less formal schooling who still have skills and knowledge that they should be able to certify to become more successful in the labour market.
France has a system of PLA known as validation des acquis de l’expérience (VAE), helping learners to achieve vocational or professionally oriented credentials. The basis for the system is set out in legislation (the labour code). France has defined VAE as an individual right, although it can be pursued on behalf of groups of workers in concert with employers and businesses. All qualifications in the national directory of qualifications (répertoire national des certifications professionnelles – RNCP) must be accessible through VAE unless they are a regulated profession where activity without a formal qualification is illegal. As of 2014, companies are legally required to review employees’ professional development and inform them of VAE, and significant leave and funding support are available for learners to fill any gaps. VAE has been a focus of steady policy evolution in recent years, for instance in connection with the skills investment plan (plan d’investissement dans les compétences) that aims to invest EUR 13 billion in the period 2019-22.
The Quebec model allows learners to obtain their full college (CÉGEP) diploma through Recognition of Acquired Competencies (RAC); and where gaps are identified in students’ learning it permits learners to fill these gaps through whatever form of learning they choose to complete their credential, including self-study, apprenticeship, classroom instruction or distance education. As in France, Quebec does not distinguish between credentials obtained through RAC or other avenues. The Government of Quebec is the primary source of funding for RAC undertaken in school boards and colleges, making the service free for all of the province’s residents.
Sources: Bohlinger (2017[163]); Cedefop (2018[164]); Mathou (2019[165]); Moss (2011[166]); Werquin (2010[167]).
Potential success factors for information policies to support alignment between higher education and the labour market
Multiple tools are in place in Ohio, Texas, Virginia and Washington to provide information about educational and career opportunities, graduate outcomes in the labour market, and the alignment between skills supply and demand. Across the four states, information on graduate earnings by programme or major/field of study are available for several years post-graduation through post-secondary longitudinal data systems. However, understanding graduates’ employment trajectories, field of study match, and the quality and degree of skills use in the workplace continues to be a challenge. While systematic, state-wide graduate surveys have been attempted, these have often been discontinued and are conducted only on an ad hoc basis.
Across all four states, public authorities maintain a wealth of information that is made available to students and families, educators, policy makers, employers and other stakeholders. However, it is challenging to ensure that the information provided is both sufficiently comprehensive and easy to navigate for different users. State efforts to develop credential inventories to help students, employers and institutions understand the value of different credentials are still in their early stages, and would benefit from more effective co-ordination between state agencies, institutions, employers and other industry/professional associations.
Based on international examples and the analysis conducted in the four states, potential success factors to improve the effectiveness of information policies to improve the alignment between higher education and workforce needs could include:
Mechanisms to integrate workforce information in strategic planning and forecasting processes in higher education. This can include developing state-wide supply-demand analyses and considering approaches to systematically engage employers, identify emerging trends and more granular skills needs, assessing institutional capacity to meet changing needs and providing state-wide access to major data resources (Goldman et al., 2015[139]).
Approaches to improve the quality and availability of data on graduate outcomes in the labour market by providing debt and earnings data at the programme level and expanding coverage to include both public and private institutions, where possible. Make use of data that enable outcomes to be disaggregated for different student groups and sub-populations, for example low-income and minority students. Explore the development of metrics or tools to measure the employment outcomes of graduates, for example by developing state-wide graduate outcomes or employer surveys to assess the signalling value of post-secondary qualifications and skills use in the workplace as well as in-field job placement rates.
Mechanisms to provide integrated information to students and families about educational opportunities and pathways, costs, outcomes and supports. Information about the expected return on investment of post-secondary education options can help students make better choices in terms of selecting field of study and career path. However, the tailoring of information is crucial to ensure that it reaches students in a manner in which they can easily access and absorb it (Lavecchia, Liu and Oreopoulos, 2015[168]). In order to make it easier for users to navigate and access all the information that is available, it may be beneficial to consolidate existing and relevant tools into a single information platform that differentiates between different types of users.
References
[58] Adecco USA (2019), The American Skills Gap is Real, https://www.adeccousa.com/employers/resources/skills-gap-in-the-american-workforce/ (accessed on 3 February 2020).
[146] Australian Department of Education and Training (2018), QILT - Quality Indicators for Learning and Teaching, QILT, http://www.qilt.edu.au/ (accessed on 27 March 2018).
[18] Authority, H. (ed.) (2019), Funding, Governance and Performance - Process, Higher Education Authority, https://hea.ie/funding-governance-performance/process/ (accessed on 5 February 2020).
[80] Bailey, T. (2017), “Guided Pathways at Community Colleges: From Theory to Practice”, Diversity and Democracy, Vol. 20/4, https://www.aacu.org/diversitydemocracy/2017/fall/bailey (accessed on 28 August 2019).
[72] Bailey, T. et al. (2017), “Policy Levers to Strengthen Community College Transfer Student Success in Texas”, Community College Research Center, https://ccrc.tc.columbia.edu/media/k2/attachments/policy-levers-to-strengthen-community-college-transfer-student-success-in-texas.pdf.
[163] Bohlinger, S. (2017), “Comparing recognition of prior learning (RPL) across countries”, in Mulder, M. (ed.), Technical and Vocational Education and Training, Springer Nature, https://doi.org/10.1007/978-3-319-41713-4_27.
[143] Brüning, N. and P. Mangeol (forthcoming), “What skills do employers seek in higher education graduates? An analysis using Burning Glass Technologies job posting data”, OECD Education Working Papers, OECD, Paris, https://doi.org/10.1787/19939019.
[26] Burns, T., F. Köster and M. Fuster (2016), Education Governance in Action: Lessons from Case Studies, Educational Research and Innovation, OECD Publishing, Paris, https://dx.doi.org/10.1787/9789264262829-en.
[37] Calmand, J. and P. Lemistre (2019), “Effet du parcours à diplôme donné sur l’insertion professionnelle Groupe de travail sur l’enseignement supérieur”, Céreq Echanges, Vol. 11, pp. 1-168, https://www.cereq.fr/effet-du-parcours-diplome-donne-sur-linsertion-professionnelle (accessed on 24 February 2020).
[62] Capelli, P. (2015), “Skill Gaps, Skill Shortages, and Skill Mismatches: Evidence and Arguments for the United States”, Industrial & Labor Relations Review, Vol. 68/2, pp. 251-290, https://doi.org/10.1177/0019793914564961.
[64] Carnevale, A. and N. Smith (2018), Balancing Work and Learning: Implications for Low-Income Students, Georgetown University Center on Education and the Workforce, https://1gyhoq479ufd3yna29x7ubjn-wpengine.netdna-ssl.com/wp-content/uploads/Low-Income-Working-Learners-FR.pdf (accessed on 12 March 2020).
[63] Carnevale, A., N. Smith and J. Strohl (2013), Recovery: Job Growth and Education Requirements through 2020, Georgetown University Center on Education and the Workforce, Washington, DC, https://1gyhoq479ufd3yna29x7ubjn-wpengine.netdna-ssl.com/wp-content/uploads/2014/11/Recovery2020.FR_.Web_.pdf (accessed on 10 May 2019).
[128] Carnevale, A. and J. Strohl (2013), Separate and Unequal: How Higher Education Reinforces the Intergenerational Reproduction of White Racial Privilege, Georgetown Public Policy Institute; Center on Education and the Workforce, Washington D.C., https://cew.georgetown.edu/wp-content/uploads/SeparateUnequal.FR_.pdf (accessed on 22 July 2019).
[65] Caroll, A. et al. (2018), Higher Education Learning Framework Matrix - An Evidence Informed Model for University Learning, Science of Learning Research Centre , Brisbane: The University of Queensland, https://www.slrc.org.au/wp-content/uploads/2018/05/HELF-isbn.pdf (accessed on 27 February 2020).
[164] Cedefop (2018), European Inventory on validation of non-formal and informal learning - European Inventory on Validation: 2018 update, https://www.cedefop.europa.eu/en/events-and-projects/projects/validation-non-formal-and-informal-learning/european-inventory#Country (accessed on 27 February 2020).
[84] City of New York (2020), Accelerated Study in Associate Programs - Growing Up NYC, https://growingupnyc.cityofnewyork.us/programs/cuny-asap/#section-summary (accessed on 12 March 2020).
[106] CLASP (2018), When Financial Aid Falls Short: New Data Reveal Students Face Thousands in Unmet Need, The Center for Law and Social Policy, Washington, DC, https://www.clasp.org/sites/default/files/publications/2018/12/2018whenfinancialaidfallsshort.pdf.
[138] Coffey, C., R. Sentz and Y. Saleh (2019), Degrees at Work: Examining the serendipitous outcomes of diverse degrees, EMSI, https://www.economicmodeling.com/wp-content/uploads/2019/08/Emsi_Degrees-at-Work_Full-Report-1.pdf (accessed on 6 March 2020).
[85] Cormier, M. et al. (2019), Scaling Success: Lessons From the ASAP Expansion at Bronx Community College, CCRC Research, https://ccrc.tc.columbia.edu/publications/scaling-success-cuny-asap-bcc.html (accessed on 12 March 2020).
[159] Credential Engine (2019), Credential Engine, https://credentialengine.org/ (accessed on 1 December 2019).
[86] CUNY (2020), CUNY ASAP, http://www1.cuny.edu/sites/asap/ (accessed on 12 March 2020).
[87] CUNY (2020), Significant Increases in Associate Degree Graduation Rates: CUNY Accelerated Study in Associate Programs (ASAP), http://www.mdrc.org/publication/doubling-graduation-rates (accessed on 12 March 2020).
[127] Dearden, L. et al. (2011), The Impact of Tuition Fees and Support on University Participation in the UK, Institute of Fiscal Studies, London, https://www.ifs.org.uk/wps/wp1117.pdf (accessed on 5 February 2020).
[130] Deming, D. and C. Walters (2017), The Impact of Price Caps and Spending Cuts on U.S. Postsecondary Attainment, Harvard University, UC Berkeley, NBER, https://scholar.harvard.edu/files/ddeming/files/DW_Aug2017.pdf (accessed on 28 August 2019).
[47] Department for Education (2019), Apprenticeship funding in England, https://www.gov.uk/government/publications/apprenticeship-funding (accessed on 24 February 2020).
[66] Department of Education and Skills (2018), Higher Education System Performance Framework 2018-2020, http://www.education.ie/en/Publications/Corporate-Reports/Strategy-Statement/Department-of-Education-and-Skills-Strategy- (accessed on 27 February 2020).
[16] Department of Education and Skills (2018), Key System Objectives for the Higher Education System 2018-2020, https://www.education.ie/en/Publications/Corporate-Reports/Strategy-Statement/Department-of-Education-and-Skills-Strategy- (accessed on 5 February 2020).
[120] Desjardins, R. (2017), Political economy of adult learning systems : comparative study of strategies, policies and constraints, https://www.bloomsbury.com/uk/political-economy-of-adult-learning-systems-9781474273664/.
[67] Donnelly, R. et al. (2018), Ireland’s Higher Education Teachers Have a National Professional Development Framework, Now What?, https://arrow.tudublin.ie/ltccon (accessed on 27 February 2020).
[142] Dorrer, J. (2016), “Using real-time labor market information to achieve better labor market outcomes”, Lumina Issue Papers, Lumina Foundation, https://www.luminafoundation.org/files/resources/using-real-time-labor-market-information-full.pdf.
[117] Dougherty, K. et al. (2011), The Politics of Performance Funding in Eight States: Origins, Demise, and Change - Final Report to Lumina Foundation for Education, Community College Research Center, http://ccrc.tc.columbia.edu (accessed on 27 February 2020).
[14] Eckel, P. and J. King (2004), “An Overview of Higher Education in the United States: Diversity, Access, and the Role of the Marketplace”, in Forest, J. and P. Altbach (eds.), The International Handbook of Higher Education, http://www.springeronline.com. (accessed on 3 June 2019).
[154] Educause (2019), 7 things you should know about the comprehensive learner record, Educause Learning Initiative, https://credentialengine.org/wp-content/uploads/2019/01/Educause_Comprehensive-Learner-Record.pdf (accessed on 14 February 2020).
[30] European Training Foundation (2018), Support to VET - Financing Policy guidance note; Formula Funding, https://www.etf.europa.eu/sites/default/files/2018-11/Policy%20guidance%20note_Formula%20%20funding_0.pdf (accessed on 4 March 2020).
[38] Eurydice (2019), National Reforms in Vocational Education and Training and Adult Learning | France, https://eacea.ec.europa.eu/national-policies/eurydice/content/national-reforms-vocational-education-and-training-and-adult-learning-23_en (accessed on 24 February 2020).
[21] Eurydice (2019), National Reforms related to Transversal Skills and Employability | Norway, https://eacea.ec.europa.eu/national-policies/eurydice/content/national-reforms-related-transversal-skills-and-employability-48_en (accessed on 24 February 2020).
[28] Federal Reserve Bank of Dallas; Center for Public Policy Priorities (2016), Regional Talent Pipelines: Collaborating with Industry to Build Opportunities in Texas, https://www.dallasfed.org/-/media/Documents/cd/pubs/pipelines.pdf?la=en, https://www.dallasfed.org/-/media/Documents/cd/pubs/pipelines.pdf.
[152] Foote, A. et al. (2019), Post-Secondary Employment Outcomes (PSEO), United States Census Bureau, https://lehd.ces.census.gov/doc/PSEOTechnicalDocumentation.pdf (accessed on 19 November 2019).
[15] Fulton, M. (2019), An Analysis of State Postsecondary Governance Structures, Education Commission on the States, https://www.ecs.org/an-analysis-of-state-postsecondary-governance-structures/.
[157] Gallagher, S. (2018), Educational Credentials Come of Age: A Survey on the Use and Value of Educational Credentials in Hiring, Northeastern University, Center for the Future of Higher Education and Talent Strategy, https://www.northeastern.edu/cfhets/wp-content/uploads/2018/12/Educational_Credentials_Come_of_Age_2018.pdf (accessed on 20 July 2019).
[124] GAO (2015), Better Management of Federal Grant and Loan Forgiveness Programs for Teachers Needed to Improve Participant Outcomes, United States Government Accountability Office, https://www.gao.gov/assets/670/668634.pdf (accessed on 18 March 2020).
[139] Goldman, C. et al. (2015), Using Workforce Information for Degree Program Planning in Texas, RAND Corporation, https://doi.org/10.7249/RR1011.
[129] Goolsbee, A., G. Hubbard and A. Ganz (2019), “A Policy Agenda to Develop Human Capital for the Modern Economy”, in Kearney, M. and A. Ganz (eds.), Expanding Economic Opportunity for More Americans: Bipartisan Policies to Increase Work, Wage and Skills, https://www.aspeninstitute.org/longform/expanding-economic-opportunity-for-more-americans/a-policy-agenda-to-develop-human-capital-for-the-modern-economy/ (accessed on 12 August 2019).
[60] Hart Research Associates (2018), Fulfilling the American Dream: Liberal Education and the Future of Work. Selected Findings from Online Surveys of Business Executives and Hiring Managers., https://www.aacu.org/sites/default/files/files/LEAP/2018EmployerResearchReport.pdf.
[17] HEA (2017), Higher Education System Performance 2014-2017 - Third Report of the Higher Education Authority to the Minister for Education and Skills Higher Education System, Higher Education Authority, https://hea.ie/assets/uploads/2018/01/Higher-Education-System-Performance-2014-17-report-1.pdf (accessed on 5 February 2020).
[35] Hemelt, S. et al. (2018), “Why is Math Cheaper than English: Understanding Cost Differences in Higher Education”, Discussion Paper Series, No. 11968, IZA Institute of Labor Economics, http://ftp.iza.org/dp11968.pdf.
[68] Hénard, F. and D. Roseveare (2012), Fostering Quality Teaching in Higher Education: Policies and Practices, OECD/ IMHE, http://www.oecd.org/edu/imhe (accessed on 27 February 2020).
[137] Hershbein, B. and K. Hollenbeck (2015), Refining Workforce Education Supply and Demand Analysis: Final Report, W.E. Upjohn Institute for Employment Research, https://research.upjohn.org/cgi/viewcontent.cgi?article=1034&context=up_technicalreports.
[94] HESA (2019), The State of Post Secondary Education in Canada, Higher Education Strategy Associates, http://www.higheredstrategy.com (accessed on 27 February 2020).
[95] Hicks, M. and L. Jonker (2016), The Differentiation of the Ontario University System: Where are we now and where should we go?, Higher Education Quality Council of Ontario (HEQCO), http://www.heqco.ca (accessed on 27 February 2020).
[12] Higher Education Quality Council of Ontario (2020), HEQCO, http://www.heqco.ca/en-CA/Pages/Home.aspx.
[78] Holzer, H. and S. Baum (2017), Making College Work: Pathways to Success for Disadvantaged Students, Brookings Institution Press, https://www.brookings.edu/book/making-college-work/.
[96] Howard, A. and J. Edge (2014), Policies, Laws, and Regulations - Governing Post-Secondary Education and Skills in Canada, The Conference Board of Canada - Centre for Skills and Post-Secondary Education.
[46] IFF Research - Department for Education (2018), Employer skills survey 2017, IFF Research and Department for Education, https://assets.publishing.service.gov.uk/government/uploads/system/uploads/attachment_data/file/746493/ESS_2017_UK_Report_Controlled_v06.00.pdf.
[147] IFF Research - Department for Education (2018), Employer skills survey 2017: Research report, IFF Research and Department for Education, https://assets.publishing.service.gov.uk/government/uploads/system/uploads/attachment_data/file/746493/ESS_2017_UK_Report_Controlled_v06.00.pdf.
[148] IFF Research - Department for Education (2018), Employer skills survey 2017: Technical report, https://assets.publishing.service.gov.uk/government/uploads/system/uploads/attachment_data/file/733999/Employer_Skills_Survey-Technical_report.pdf.
[56] IHE (2019), Survey: Employers Want ’Soft Skills’ From Graduates, Inside Higher Ed, https://www.insidehighered.com/quicktakes/2019/01/17/survey-employers-want-soft-skills-graduates (accessed on 3 February 2020).
[39] INSEE (2018), “L’école et ses sortants [Education and its aftermath]”, Formation et emploi - Insee Références, pp. 68-81, https://www.insee.fr/fr/statistiques/fichier/3526077/Formemp18f_F1_ecole.pdf (accessed on 24 February 2020).
[160] International Organization for Standardization (2017), ISO 29993:2017(en) Learning services outside formal education - Service requirements, https://www.iso.org/obp/ui/#iso:std:iso:29993:ed-1:v1:en (accessed on 2 October 2019).
[75] Jenkins, D. and J. Fink (2016), Tracking Transfer - New Measures of Institutional and State Effectiveness in Helping Community College Students Attain Bachelor’s Degrees, Community College Research Center, Columbia University; The Aspen Institute; National Student Clearinghouse Research Center, https://ccrc.tc.columbia.edu/media/k2/attachments/tracking-transfer-institutional-state-effectiveness.pdf (accessed on 7 February 2020).
[76] JLARC (2019), JLARC Impacts - Actions taken on report recommendations 2015-2018, Joint Legislative Audit and Review Commission , Richmond, http://jlarc.virginia.gov/pdfs/reports/Rpt517-3.pdf (accessed on 21 September 2019).
[158] Kato, S., V. Galán-Muros and T. Weko (2020), “The emergence of alternative credentials”, OECD Education Working Papers, No. 216, OECD Publishing, Paris, https://doi.org/10.1787/b741f39e-en (accessed on 8 April 2020).
[126] Kelchen, R. (2017), MHEC POLICY BRIEF Tuition Control Policies: A Challenging Approach to College Affordability, Midwestern Higher Education Compact (MHEC), https://doi.org/10.1016/j.econedurev.2017.07.007.
[48] Knowles, E. (2020), Degree apprenticeships, Prospects, https://www.prospects.ac.uk/jobs-and-work-experience/apprenticeships/degree-apprenticeships (accessed on 24 February 2020).
[49] Kuczera, M. and S. Field (2013), “A Skills beyond School Review of the United States”, OECD Reviews of Vocational Education and Training, OECD Publishing, Paris, https://doi.org/10.1787/9789264202153-en (accessed on 24 June 2019).
[140] Labour Market Information Council (2019), Public Opinion Research Project, https://lmic-cimt.ca/public-opinion-research-project/.
[168] Lavecchia, A., H. Liu and P. Oreopoulos (2015), “Behavioral Economics of Education: Progress and Possibilities”, NBER Working Paper No. 20609, http://www.nber.org/papers/w20609.
[69] Learning Avenue (2017), Review of the National Forum for the Enhancement of Teaching and Learning, https://hea.ie/assets/uploads/2017/04/Review-of-the-National-Forum-for-the-Enhancement-of-Teaching-and-Learning-2.pdf (accessed on 27 February 2020).
[112] Legislative Budget Board (2019), Financing Public Higher Education in Texas: Legislative Primer, The State of Texas, https://www.lbb.state.tx.us/Documents/Publications/Primer/4909_Financing_Public_Higher_Ed.pdf.
[82] Levin, H. and E. Garcia (2017), “Accelerating Community College Graduation Rates: A Benefit–Cost Analysis”, The Journal of Higher Education, Vol. 89/1, pp. 1-27, https://doi.org/10.7916/D8ST82BS.
[109] Li, A. (2018), Lessons Learned: A Case Study of Performance Funding in Higher Education, https://www.researchgate.net/publication/328615362_Lessons_Learned_A_Case_Study_of_Performance_Funding_in_Higher_Education (accessed on 30 January 2020).
[145] London Economics (2017), Review of the Employer Skills and Employer Perspectives surveys: A synthesis of stakeholder views, https://assets.publishing.service.gov.uk/government/uploads/system/uploads/attachment_data/file/622310/Review_of_EPS_and_ESS.pdf.
[6] Lumina Foundation (2019), A Stronger Nation: National Report 2019, http://blob:http://strongernation.luminafoundation.org/0e7dea0c-7a70-4ac4-a43f-389fa705b1ac.
[59] Manpower Group (2018), 2018 Talent Shortage Survey: United States., WI: ManpowerGroup, Milwaukee, https://www.manpower.com/wcm/connect/ManpowerUSA/eb76e7d3-637a-4982-aea3-8693256aa6a8/manpower-2020-talent-shortage-candidate-infographic.pdf?MOD=AJPERES&CVID=n0gDg20 (accessed on 12 March 2020).
[165] Mathou, C. (2019), European inventory on validation of non-formal and informal learning 2018 update - Country report: France, Cedefop/ETF/ European Commission, http://libserver.cedefop.europa.eu/vetelib/2019/european_inventory_validation_2018_France.pdf (accessed on 27 February 2020).
[27] McGuinness, A. (2016), State Policy Leadership for the Future: History of state coordination and governance and alternatives for the future, Education Commission of the States, Denver, https://www.ecs.org/wp-content/uploads/051616-State-Policy-Leadership-for-the-Future-KL-final4-1.pdf (accessed on 10 September 2019).
[89] MDRC (2016), Accelerated Study in Associate Programs, https://www.mdrc.org/sites/default/files/ASAP%202-pager%2002.09.16.pdf (accessed on 9 March 2020).
[44] MESRI-SIES (French Ministry of Higher Education, Research and Innovation) (2020), Note Flash n°03- Les étudiants en sections de technicien supérieur en 2019-2020 [Students in higher vocational education in 2019-2020], Systèmes d’Information et d’Etudes Statistiques (SIES), Ministère de l’Enseignement Supérieur, de la Recherche et de l’Innovation (MESRI), https://cache.media.enseignementsup-recherche.gouv.fr/file/2020/19/7/NF_2020_03_sts_1241197.pdf (accessed on 24 February 2020).
[42] MESRI-SIES (French Ministry of Higher Education, Research and Innovation) (2019), Note Flash n°25- Parcours et réussite en DUT: les résultats de la session 2018 [Pathways and success in DUT: results of the 2018 session], Systèmes d’Information et d’Etudes Statistiques (SIES), Ministère de l’Enseignement Supérieur, de la Recherche et de l’Innovation (MESRI), https://cache.media.enseignementsup-recherche.gouv.fr/file/2019/04/5/NF_Reussite_IUT_1214045.pdf (accessed on 24 February 2020).
[43] MESRI-SIES (French Ministry of Higher Education, Research and Innovation) (2019), Note Flash n°29- Les indicateurs d’insertion des diplômés de DUT à 18 et 30 mois s’améliorent [Indicators of DUT graduates’ employability 18 and 30 months after graduation are improving], Systèmes d’Information et d’Etudes Statistiques (SIES), Ministère de l’Enseignement Supérieur, de la Recherche et de l’Innovation (MESRI), https://data.enseignementsup-recherche.gouv.fr/pages/insertion_professionnelle/ (accessed on 24 February 2020).
[41] MESRI-SIES (French Ministry of Higher Education, Research and Innovation) (2018), Note Flash n°17- Parcoursup 2018: Propositions d’admission dans l’enseignement supérieur et réponses des bacheliers [Parcoursup 2018: Higher education admission proposals and responses from high school graduates], Systèmes d’Information et d’Etudes Statistiques (SIES), Ministère de l’Enseignement Supérieur, de la Recherche et de l’Innovation, http://www.enseignementsup-recherche.gouv.fr/pid30617/notes-flash.html (accessed on 24 February 2020).
[40] MESRI-SIES (French Ministry of Higher Education, Research and Innovation) (2017), Note Flash n°11- Les effectifs dans l’enseignement supérieur en 2016-2017 [2016-2017 Enrolments in higher education], Systèmes d’Information et d’Etudes Statistiques (SIES), Ministère de l’Enseignement Supérieur, de la Recherche et de l’Innovation (MESRI), https://cache.media.enseignementsup-recherche.gouv.fr/file/2017/29/0/NF_2017-11_Synthese_effectifs_etudiants_2016-2017_num_802290.pdf (accessed on 24 February 2020).
[131] Minaya, V. and J. Scott-Clayton (2017), “Labor Market Outcomes and Postsecondary Accountability: Are Imperfect Metrics Better than None?”, in Hoxby, C. and K. Stange (eds.), Productivity in Higher Education, National Bureau of Economic Research/University of Chicago Press, https://www.nber.org/chapters/c13876.pdf (accessed on 7 August 2019).
[45] Ministère de l’Education Nationale et de la Jeunesse (French Ministry of Education and Youth) (2019), Résultats de la session de juin du baccalauréat 2019 [Results of the June session of the 2019 Baccalaureate], https://www.education.gouv.fr/resultats-de-la-session-de-juin-du-baccalaureat-2019-7385 (accessed on 24 February 2020).
[22] Ministry of Education and Research (2017), Norwegian Strategy for Skills Policy 2017-2021, https://www.regjeringen.no/en/topics/education/voksnes-laring-og-kompetanse/artikler/National-Skills-Policy-Strategy-2017-2021/id2516169/ (accessed on 17 December 2017).
[166] Moss, L. (2011), “The Recognition of Prior Learning in Quebec: Current Practices”, McGill Journal of Education, Vol. 46/3, pp. 395-406, https://mje.mcgill.ca/article/view/5783 (accessed on 27 February 2020).
[133] Musset, P. and L. Mytna Kurekova (2018), “Working it out: Career Guidance and Employer Engagement”, OECD Education Working Papers, No. 175, OECD Publishing, Paris, https://dx.doi.org/10.1787/51c9d18d-en.
[107] NASFAA (n.d.), Glossary of Terms for Financial Aid Offers, National Association of Student Financial Aid Administrators, https://www.nasfaa.org/glossary#efc (accessed on 18 March 2020).
[50] National Collaborative Outreach Programme (2018), A Student’s Guide to Higher and Degree Apprenticeships, https://www.pathwaystohe.ac.uk/wp-content/uploads/2018/05/Pathways-Higher-and-Degree-Apprenticeships-Guide.pdf (accessed on 24 February 2020).
[70] National Forum for the Enhancement of Teaching and Learning in Higher Education (2019), National Professional Development Framework for all Staff Who Teach in Higher Education, https://www.teachingandlearning.ie/publication/national-professional-development-framework-for-all-staff-who-teach-in-higher-education/ (accessed on 27 February 2020).
[91] NCES (2018), Digest of Education Statistics, 2018, National Center for Education Statistics, Washington, DC, https://nces.ed.gov/programs/digest/d18/tables/dt18_330.20.asp?current=yes (accessed on 11 March 2020).
[97] NCES (2017), Digest of Education Statistics-Advance Release of Selected 2017 Digest tables, https://nces.ed.gov/programs/digest/2017menu_tables.asp (accessed on 27 February 2020).
[19] Neavyn, R. (2019), Higher Education Authority, Presentation to the 17th OECD Informal Working Group on Higher Education.
[93] Northam Administration (2019), Governor Northam Unveils Tuition-Free Community College Program for Low- and Middle-Income Students, Webpage of the Virginia Governor, https://www.governor.virginia.gov/newsroom/all-releases/2019/december/headline-849869-en.html (accessed on 26 February 2020).
[24] Norwegian Committee on Skill Needs (n.d.), Official Committee on Skill Needs, https://kompetansebehovsutvalget.no/mandate-of-official-norwegian-committee-on-skill-needs/ (accessed on 10 March 2020).
[100] ODHE (2019), Financial Aid Guidance Memo - Ohio College Opportunity Grant (OCOG), Ohio Department of Higher Education, Columbus, https://www.ohiohighered.org/sites/default/files/uploads/sgs/guidance-memos/FA%2020-002.pdf (accessed on 9 February 2020).
[111] ODHE (2019), State Share of Instruction Handbook for use by Community and Technical Colleges, Ohio Department of Higher Education, Columbus.
[110] ODHE (2019), State Share of Instruction Handbook for use by University Regional and Main Campuses, Ohio Department of Higher Education, Columbus.
[5] OECD (2019), Benchmarking Higher Education System Performance, Higher Education, OECD Publishing, Paris, https://dx.doi.org/10.1787/be5514d7-en.
[4] OECD (2019), Education at a Glance 2019: OECD Indicators, OECD Publishing, Paris, https://dx.doi.org/10.1787/f8d7880d-en.
[25] OECD (2019), Government at a Glance 2019, https://www.oecd-ilibrary.org/governance/government-at-a-glance-2019_8ccf5c38-en (accessed on 10 March 2020).
[23] OECD (2019), OECD Skills Strategy 2019: Skills to Shape a Better Future, OECD Publishing, Paris, https://doi.org/10.1787/9789264313835-en.
[141] OECD (2018), OECD Economic Surveys: Canada 2018, OECD Publishing, Paris, https://dx.doi.org/10.1787/eco_surveys-can-2018-en.
[121] OECD (2017), Education at a Glance 2017: OECD Indicators, OECD Publishing, Paris, https://dx.doi.org/10.1787/eag-2017-en.
[122] OECD (2017), Financial Incentives for Steering Education and Training, Getting Skills Right, OECD Publishing, Paris, https://dx.doi.org/10.1787/9789264272415-en.
[29] OECD (2015), Education Policy Outlook 2015: Making Reforms Happen, OECD Publishing, Paris, https://dx.doi.org/10.1787/9789264225442-en.
[132] OECD (2004), Career Guidance and Public Policy : Bridging the Gap, OECD Publishing, https://doi.org/10.1787/9789264105669-en (accessed on 10 March 2020).
[20] OECD/European Union (2017), Supporting Entrepreneurship and Innovation in Higher Education in Ireland, OECD Skills Studies, OECD Publishing, Paris/European Union, Brussels, https://dx.doi.org/10.1787/9789264270893-en.
[51] Office for Students (2019), Analysis of degree apprenticeships, https://www.officeforstudents.org.uk/data-and-analysis/analysis-of-degree-apprenticeships/disadvantage/ (accessed on 24 February 2020).
[52] Office for Students (2019), Degree apprenticeships - guide for apprentices, https://www.officeforstudents.org.uk/advice-and-guidance/skills-and-employment/degree-apprenticeships/degree-apprenticeships-guide-for-apprentices/.
[53] Office for Students (2019), Degree apprenticeships: a viable alternative?, https://www.officeforstudents.org.uk/media/c791216f-a1f1-4196-83c4-1449dbd013f0/insight-2-degree-apprenticeships.pdf.
[7] Ohio Department of Higher Education (n.d.), Attainment, https://www.ohiohighered.org/attainment (accessed on 20 April 2020).
[115] Ohio General Assembly (2019), House Bill 166 - Creates FY 2020-2021 operating budget, https://www.legislature.ohio.gov/legislation/legislation-summary?id=GA133-HB-166 (accessed on 8 February 2020).
[3] Ost, B., W. Pan and D. Webber (2018), The Returns to College Persistence for Marginal Students: Regression Discontinuity Evidence from University Dismissal Policies, http://www.journals.uchicago.edu/t-and-c (accessed on 20 May 2019).
[156] Pearson VUE (2019), 2018 Value of IT Certification, Pearson Education, London, https://home.pearsonvue.com/voc (accessed on 24 July 2019).
[150] Pena, C. (2018), Workforce success relies on transparent postsecondary data, National Skills Coalition, https://m.nationalskillscoalition.org/resources/publications/file/Workforce-success-relies-on-transparent-postsecondary-data_web.pdf.
[134] Prince, H. et al. (2015), Are people getting credentials that lead to jobs? Using dashboards for state workforce planning, National Skills Coalition, State Workforce and Education Alignment Project, https://www.nationalskillscoalition.org/resources/publications/file/SWEAP_Using_Dashboards_for_State_Workforce_Planning.pdf.
[149] QILT (2019), 2018 Employer Satisfaction Survey: National Report, Quality indicators for learning and teaching, https://www.qilt.edu.au/docs/default-source/ess/ess-2018/2018-ess-national-report.pdf?sfvrsn=9d2ae33c_8.
[118] Research for Action (2017), Implementation and Impact of Outcomes-Based Funding in Tennessee, https://8rri53pm0cs22jk3vvqna1ub-wpengine.netdna-ssl.com/wp-content/uploads/2017/07/RFA-OBF-in-Tennessee-Full-Brief_updated-July-2017.pdf (accessed on 27 February 2020).
[114] SBCTC (n.d.), Student Achievement Initiative, Washington State Board for Community and Technical Colleges, https://www.sbctc.edu/about/agency/initiatives-projects/student-achievement-initiative.aspx (accessed on 12 March 2020).
[103] SCHEV (2019), 2020-22 Systemwide Operating and Financial Aid Budget Recommendations for Higher Education in Virginia State Council of Higher Education for Virginia, State Council of Higher Education for Virginia, Richmond, https://www.schev.edu/docs/default-source/Reports-and-Studies/2019/soc2020-22budgetrecommendations.pdf (accessed on 22 February 2020).
[144] SCHEV (2019), Agenda Book - September 16-17, 2019, State Council of Higher Education for Virginia, Richmond, https://www.schev.edu/docs/default-source/about-section/council-files/2019-council-meetings/september-2019/rev-agenda-book-pdf-(w-page-numbers-for-posting).pdf (accessed on 21 September 2019).
[9] SCHEV (2019), The Virginia Plan for Higher Education - Annual Report 2018, State Council of Higher Education for Virginia, Richmond, https://www.schev.edu/docs/default-source/virginia-plan/Reports-and-Updates/the-virginia-plan-annual-report-2018.pdf (accessed on 27 June 2019).
[123] SCHEV (2018), Current Six-Year Plans - 2018, State Council of Higher Education for Virginia, Richmond, https://www.schev.edu/index/institutional/planning-and-performance/currentsixyearplans (accessed on 30 June 2019).
[36] SCHEV (2018), FY 2020 Budget and Policy Recommendations for Higher Education in Virginia, State Council of Higher Education for Virginia, Richmond, https://www.schev.edu/docs/default-source/Reports-and-Studies/2018-reports/fy2020budget-recommendations11918.pdf (accessed on 29 June 2019).
[74] SCHEV (2016), Aspects of Student Transfer and Post-Transfer Success at Virginia Public Institutions, State Council of Higher Education for Virginia, Richmond, https://www.schev.edu/docs/default-source/Reports-and-Studies/2016-reports/transferreport2016.pdf.
[81] Scrivener, S. et al. (2015), Doubling Graduation Rates, MDRC, New York, https://files.eric.ed.gov/fulltext/ED558511.pdf (accessed on 28 August 2019).
[90] SHEEO (2019), SHEF: FY 2018 State Higher Education Finance, State Higher Education Executive Officers Association, http://www.sheeo.org/shef (accessed on 30 July 2019).
[99] SHEEO (2019), SHEF: State Higher Education Finance, State Higher Education Executive Officers Association, https://sheeo.org/project/state-higher-education-finance/ (accessed on 23 September 2019).
[57] SHRM (2019), Employers Say Students Aren’t Learning Soft Skills in College, Society for Human Resource Management, https://www.shrm.org/resourcesandtools/hr-topics/employee-relations/pages/employers-say-students-arent-learning-soft-skills-in-college.aspx (accessed on 3 February 2020).
[83] Sommo, C. et al. (2018), Doubling graduation rates in a new state: Two-year findings from the ASAP demonstration in Ohio., MDRC, https://www.mdrc.org/sites/default/files/ASAP_brief_2018_Final.pdf (accessed on 12 March 2020).
[13] States, E. (2019), High-Level Analysis of State Postsecondary Governance Structures, Education Commission of the States, https://www.ecs.org/wp-content/uploads/PS-Gov-Structures-50_State-Analysis_Compacts_Other-States_May2019.pdf.
[31] Steen Roesdahl, M. (2017), Initiatives to Promote Labour Market Match and Relevance in Danish Higher Education.
[88] Strumbos, D., Z. Kolenovic and A. Tavares (2016), “CUNY Accelerated Study in Associate Programs (ASAP): Evidence from six cohorts and lessons for expansion.”, in Proceedings of the 12th National Symposium on Student Retention, Norfolk, Virginia, http://csrde.ou.edu (accessed on 12 March 2020).
[153] Studiekeuze123 (2020), Studiekeuze123 (Study Choice 123), https://www.studiekeuze123.nl/ (accessed on 12 March 2020).
[119] Tennessee Higher Education Commission (2016), Outcomes-Based Formula Model Data Definitions - Revised 08-15-2016, https://www.tn.gov/content/dam/tn/thec/bureau/fiscal_admin/fiscal_pol/obff/Detailed_Outcomes_Formula_Definitions_08-2016.pdf (accessed on 27 February 2020).
[79] Texas Legislature (2019), H.B. No. 3808: An act relating to measures to facilitate the timely graduation of and attainment of marketable skills by students in public higher education., https://capitol.texas.gov/tlodocs/86R/billtext/pdf/HB03808F.pdf#navpanes=0 (accessed on 26 January 2020).
[102] THECB (2019), 2019-20 Program Guidelines Toward EXcellence, Access, & Success Grant (TEXAS Grant), Texas Higher Education Coordinating Board, http://reportcenter.thecb.state.tx.us/agency-publication/miscellaneous/texas-grant-fy-2020-program-guidelines/ (accessed on 12 March 2020).
[101] THECB (2019), Operating Budget: Fiscal Year 2020, Texas Higher Education Coordinating Board, http://www.thecb.state.tx.us/DocID/PDF/12963.PDF (accessed on 12 March 2020).
[98] THECB (2018), Report on Student Financial Aid in Texas Higher Education: Fiscal Year 2017, http://www.60x30tx.com/media/1412/student-fin-aid-in-texas-report.pdf (accessed on 12 April 2020).
[11] THECB (2016), Closing the Gaps Final Progress Report, Texas HIgher Education Coordinating Board, http://www.thecb.state.tx.us/DocID/PDF/8138.PDF (accessed on 9 December 2019).
[8] THECB (2015), 60x30TX: Texas Higher Education Strategic Plan 2015-2030, http://reportcenter.thecb.state.tx.us/agency-publication/miscellaneous/60x30tx-strategic-plan-for-higher-education/ (accessed on 12 April 2020).
[1] TICAS (2019), Student Debt and the Class of 2018, The Institute for College Access and Success, https://ticas.org/interactive-map/. (accessed on 23 October 2019).
[116] TICAS (2018), Of metrics and markets: Measuring post-college employment success, The Institute for College Access and Success, https://ticas.org/accountability/metrics-and-markets/ (accessed on 10 March 2020).
[162] Travers, N. et al. (2019), Learning Frameworks: Tools for Building a Better Educational Experience, Lumina Foundation, https://www.uschamberfoundation.org/workforce-development/JDX (accessed on 9 March 2020).
[108] U.S. Department of Education (n.d.), Federal Student Aid Handbook, https://ifap.ed.gov/ilibrary/document-types/federal-student-aid-handbook (accessed on 18 March 2020).
[54] UCAS (2019), Degree apprenticeships, https://www.ucas.com/alternatives/apprenticeships/apprenticeships-england/what-apprenticeships-are-available/degree-apprenticeships (accessed on 10 May 2020).
[55] UCAS (2019), Entry requirements for apprenticeships in England, https://www.ucas.com/alternatives/apprenticeships/apprenticeships-england/entry-requirements-apprenticeships-england (accessed on 10 April 2020).
[34] Uddannelses- og Forskningsministeriet (Danish Ministry of Education and Research) (2019), Bevillingssystemet for de videregående uddannelser (The higher education grant system), https://ufm.dk/uddannelse/videregaende-uddannelse/institutionstilskud/nyt-bevillingssystem-for-de-videregaende-uddannelser (accessed on 4 March 2020).
[33] Uddannelses- og Forskningsministeriet (Danish Ministry of Education and Research) (2018), Dobbeltuddannelse: Uddannelsesloftet fjernes [The Education Ceiling is repealed], https://ufm.dk/uddannelse/videregaende-uddannelse/dobbeltuddannelse (accessed on 4 March 2020).
[32] Uddannelses- og Forskningsministeriet (Danish Ministry of Education and Research) (2018), Evaluering - Af den ledighedsbaserede dimensioneringsmodel [Evaluation of the unemployment-based dimensioning model], http://www.ufm.dk (accessed on 4 March 2020).
[125] Urban Institute (2017), Understanding College Affordability, http://collegeaffordability.urban.org/ (accessed on 12 March 2020).
[161] Van Noy, M., H. McKay and S. Michael (2019), Non-Degree Credential Quality: A Conceptual Framework to Guide Measurement, Rutgers’ School of Management and Labor Relations, New Jersey, https://smlr.rutgers.edu/sites/default/files/rutgerseerc_ndcquality_framework_full_paper_final.pdf.
[77] VCCS (2019), Transfer Virginia launches, http://www.vccs.edu/vccsblog_post/transfer-virginia-launches-goal-is-to-ensure-that-students-are-able-to-make-the-jump-from-community-college-to-the-states-four-year-universities-more-efficiently/ (accessed on 21 September 2019).
[113] VCCS (2017), VCCS E&G Outcomes-Based Funding Model, Virginia Community College System, Richmond, https://www.ccleague.org/sites/default/files/images/overview_vccs_outcomes_based_funding_model.pdf (accessed on 19 February 2020).
[71] VEDP (2017), Amazon HQ2 Submission: Partnership Proposal, Virginia Economic Development Partnership, https://issuu.com/teamsubjectmatter/docs/nova_r1_proposal_full_doc_single_pa?e=35488011/65733964.
[61] Waddoups, C. (2016), “Did Employers in the United States Back Away from Skills Training during the Early 2000s?”, Industrial & Labor Relations Review, Vol. 69/2, pp. 405-434, https://doi.org/10.1177/0019793915619904.
[104] Washington Legislature (2019), Washington Education Invesment Act, https://app.leg.wa.gov/billsummary?BillNumber=2158&Initiative=false&Year=2019 (accessed on 7 August 2019).
[167] Werquin, P. (2010), Recognising Non-Formal and Informal Learning: Outcomes, Policies and Practices, OECD Publishing, Paris, https://doi.org/10.1787/9789264063853-en (accessed on 30 August 2018).
[151] Whitfield, C., J. Armstrong and D. Weeden (2019), The State of State Postsecondary Data Systems: Strong Foundations 2018, SHEEO, https://postsecondarydata.sheeo.org/wp-content/uploads/2019/04/SHEEO_StrongFoundations_18.pdf (accessed on 26 August 2019).
[135] Wilson, B. (2014), How many more skilled workers do we need? Using supply and demand reports for state workforce planning, National Skills Coalition, State workforce and education alignment project, https://www.nationalskillscoalition.org/resources/publications/file/how-many-more-skilled-workers.pdf.
[10] WSAC (2013), The 2013 Roadmap, Washington Student Achievement Council, Olympia, https://www.wsac.wa.gov/the-2013-roadmap (accessed on 15 July 2019).
[105] WSAC (n.d.), The New Washington College Grant, Washington Student Achievement Council, https://wsac.wa.gov/wcg (accessed on 12 March 2020).
[136] WSAC, SBCTC and WTECB (2018), A Skilled and Educated Workforce 2017 Update: An analysis of postsecondary education, workforce preparation, and employer demand in Washington, Washington Student Achievement Council/State Board for Community and Technical Colleges/ Workforce Training and Education Coordinating Board / Workforce Training and Education Coordinating Board, Olympia, https://wsac.wa.gov/sites/default/files/2017.ASkilledAndEducatedWorkforce.pdf (accessed on 31 May 2019).
[92] WSIPP (2019), Higher Education Funding: Models Used in Washington and Similar States, Washington State Institute for Public Policy, Olympia, https://www.wsipp.wa.gov/ReportFile/1702/Wsipp_Higher-Education-Funding-Models-Used-in-Washington-and-Similar-States_Report.pdf.
[73] Xu, D. et al. (2017), Strengthening Transfer Paths to a Bachelor’s Degree: Identifying Effective Two-Year to Four-Year College Partnerships, https://ccrc.tc.columbia.edu/media/k2/attachments/strengthening-transfer-paths-bachelors-degree.pdf (accessed on 31 October 2018).
[155] Zanville, H., K. Porter and E. Ganzglass (2017), Report on Phase I Study: Embedding Industry and Professional Certifications within Higher Education, Corporation for a Skilled Workforce, Lumina Foundation, https://www.luminafoundation.org/files/resources/report-on-phase-i-study-embedding-industry-professional-certifications-within-higher-education-january-2017.pdf.
[2] Zimmerman, S. (2014), The Returns to College Admission for Academically Marginal Students, https://doi.org/10.1086/676661.
This document, as well as any data and map included herein, are without prejudice to the status of or sovereignty over any territory, to the delimitation of international frontiers and boundaries and to the name of any territory, city or area. Extracts from publications may be subject to additional disclaimers, which are set out in the complete version of the publication, available at the link provided.
https://doi.org/10.1787/38361454-en
© OECD 2020
The use of this work, whether digital or print, is governed by the Terms and Conditions to be found at http://www.oecd.org/termsandconditions.