Chapter 25. United States
Support to agriculture
The level of support provided to agricultural producers in the United States has been consistently below the OECD average. Market price support (MPS) has become a progressively smaller share of US support to agriculture. Budgetary support has increased in importance over time, mainly due to increases in payments that require production and, to a lesser extent, increases in input payments. Reflecting the fact that many agricultural policies are counter-cyclical to market prices, the level of budgetary support is inversely related to market price developments. As a result, support has peaked when world commodity prices were depressed (in terms of USD), while high commodity prices after 2007-08 contributed to lower levels of support.
The United States’ producer support estimate (PSE) declined from 12% of gross farm receipts in 1995-97 to below 10% in 2015-17, although producer support increased in the late 1990s to early 2000s. The share of potentially most distorting support has fallen to 32% in 2015-17, and is well below the OECD average. On average, prices received by farmers in 2015-17 were 3% higher than those observed in world markets, largely as a result of MPS for milk, sugar, and to a lesser extent sheep meat. Producer prices of other commodities are mostly aligned with border prices. Payments requiring production are important because of the emphasis on farm insurance and risk management. Support to consumers accounts for close to half of total support to US agriculture as a result of US domestic food assistance programmes. Expenditures for general services (GSSE) have increased and were equivalent to 4.4% of agricultural value added in 2015-17, slightly below the OECD average.
Main policy changes
The Bipartisan Budget Act (BBA), enacted on 9 February 2018, included significant revisions to cotton and dairy programmes that take effect with the 2018 crop year. Seed cotton base acres will be established and eligible for payments under the Agriculture Risk Coverage and Price Loss Coverage programmes after the BBA authorised seed cotton as a covered commodity. The BBA revised the Margin Protection Program for Dairy Producers (MPP-Dairy) by reducing lower tier premiums and increasing the production history eligible for those premiums as well as calculating payments on a monthly rather than a bimonthly basis. The BBA also implemented a number of measures to provide disaster assistance to producers affected by hurricanes and wildfires in 2017.
Other policy changes were made to programmes that make direct payments to cotton and dairy producers. A second Cotton Ginning Cost Share programme was authorised to provide assistance to cotton producers to help cover cotton ginning costs for the 2017 crop year. USDA announced a revision to the implementation of MPP-Dairy, which allows producers previously enrolled in the programme to opt out for the 2018 coverage year.
The 2017 Tax Cuts and Jobs Act, enacted on 22 December 2017, reformed the US corporate and individual income tax structure. A number of provisions will affect agricultural producers, beginning 2018. For farmers, few of whom have organised their businesses as corporations, the most significant change will be the increased deduction for business income reported as individual income (pass-through businesses) and the provisions for income from co-operatives.
Most provisions of the 2014 Farm Act are scheduled to expire with the end of the 2018 programme year. The House and Senate Agriculture committees began work on a new farm bill as early as 2016 in some cases and continued with listening sessions in field locations and hearings in Washington, DC, throughout 2017. Development of legislation and floor debate is expected to take place in 2018.
Assessment and recommendations
-
Levels of producer support and border protection have decreased substantially since 1986-88. However, low levels of support since 2002 have been primarily due to higher world commodity prices, as many of the agricultural support programmes are counter-cyclical to market prices.
-
The increasing emphasis on insurance and risk management policy tools is, in principle, a good approach to providing support to farmers when they are in need. However, insurance programmes remain commodity-specific. Moving to an all farm-revenue approach would exploit differences in price and yield variability across products, reducing government costs for a given objective, and also remove distortions across commodity sectors. As a first step, it will be necessary to ensure that information is available to develop actuarially fair and competitive premiums. Risk management instruments should also be evaluated to ensure that they do not transfer risk to the public budget which should be borne by farmers.
-
While established environmental programmes like the Environmental Quality Incentives Program (EQIP) and the programmes consolidated into the Agricultural Conservation Easement Program (ACEP) appear to be effective in addressing soil conservation and water pollution problems, careful assessments are needed to ensure that newer programmes like the Regional Conservation Partnership Program are well targeted to providing intended environmental benefits at a local level.
-
Farm programmes continue to support farm incomes. The long-term effects of these programmes on incentives to make sustainable improvements in agricultural productivity and efficiency should be assessed to guide changes to US farm programmes in future farm bills.
Source: OECD (2018), “Producer and Consumer Support Estimates”, OECD Agriculture statistics (database), https://doi.org/10.1787/agr-pcse-data-en.
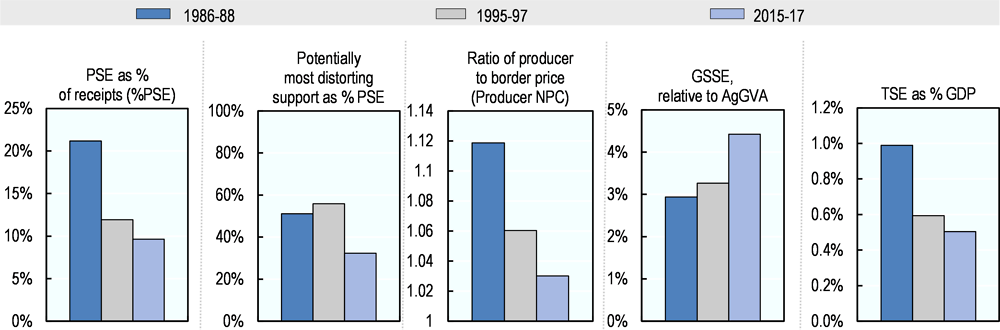
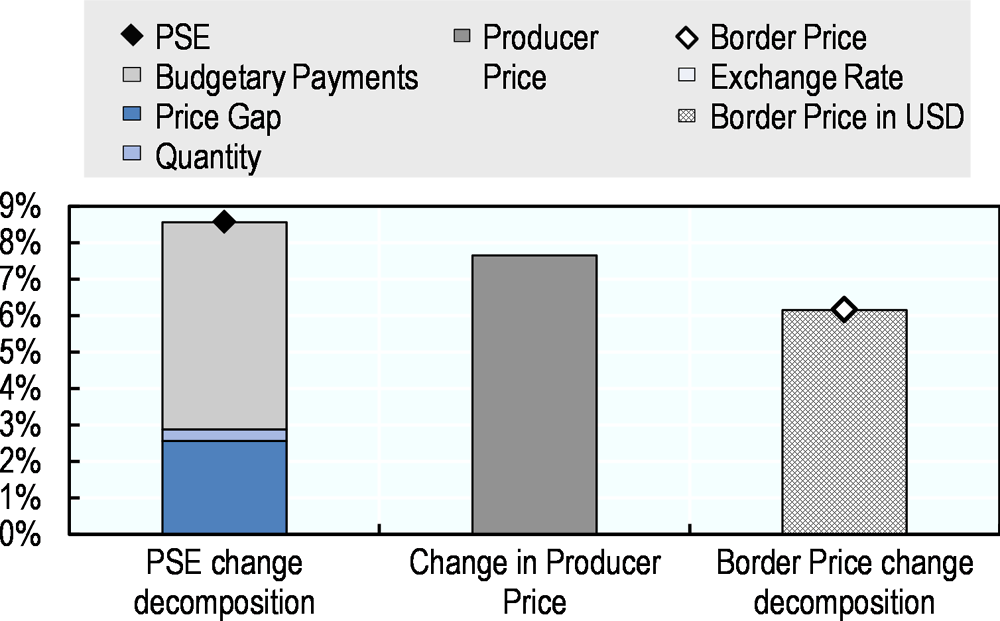
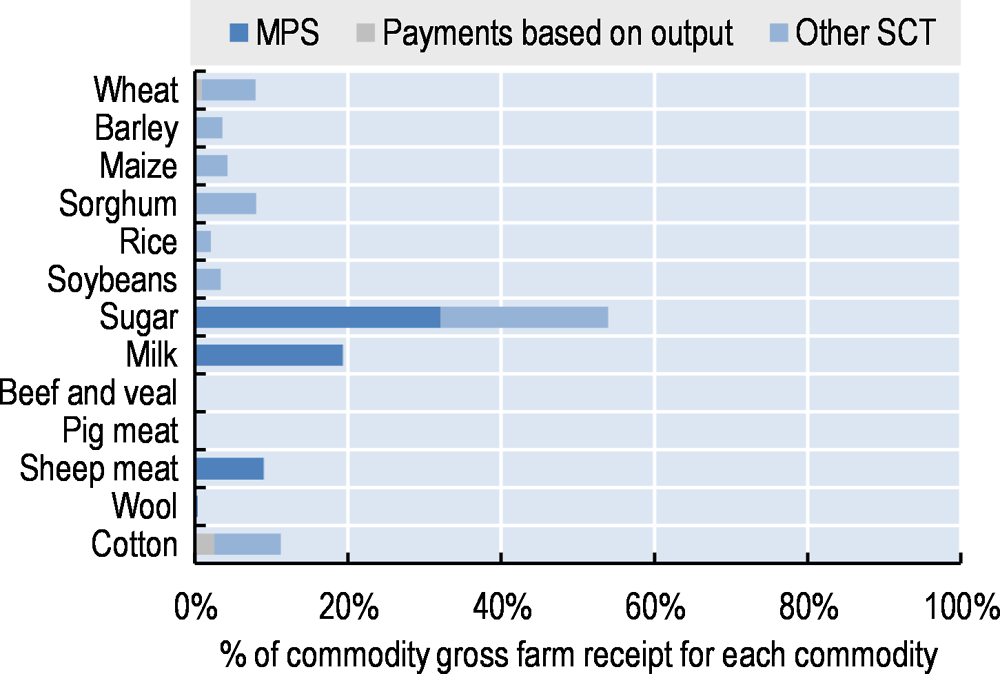
Support to farmers (%PSE) has declined from 11.9% of gross farm receipts in 1995-97 to 9.6% in 2015-17, although support levels were as high as 25% in the late 1990s to early 2000s. The share of potentially most distorting support has fallen to 32% in 2015-17, well below the OECD average and lower than levels in 1995-97 (Figure 25.1). Expenditures for general services (GSSE) are increasing and were equivalent to 4.4% of agricultural value added in 2015-17, up from 3.3% in 1995-97. Total support to agriculture as a share of GDP represented 0.5% of GDP in 2015-17. In 2017, the level of support increased due to higher budgetary payments and MPS. The increase in MPS results from a larger price gap as domestic prices increased by more than world prices (Figure 25.2). On average, prices received by farmers were 3% higher in 2015-17 than those observed in world markets. This largely results from market price support for milk, sugar, and sheep meat, as producer prices of other commodities are mostly aligned with border prices (Figure 25.3). Single commodity transfers (SCT) accounted for 46% of producer support in 2015-17. SCTs account for the highest share of farm receipts for sugar, milk, cotton, and sheep meat.
Source: OECD (2018), “Producer and Consumer Support Estimates”, OECD Agriculture statistics (database), https://doi.org/10.1787/agr-pcse-data-en.
Source: OECD (2018), “Producer and Consumer Support Estimates”, OECD Agriculture statistics (database), https://doi.org/10.1787/agr-pcse-data-en.
Contextual information
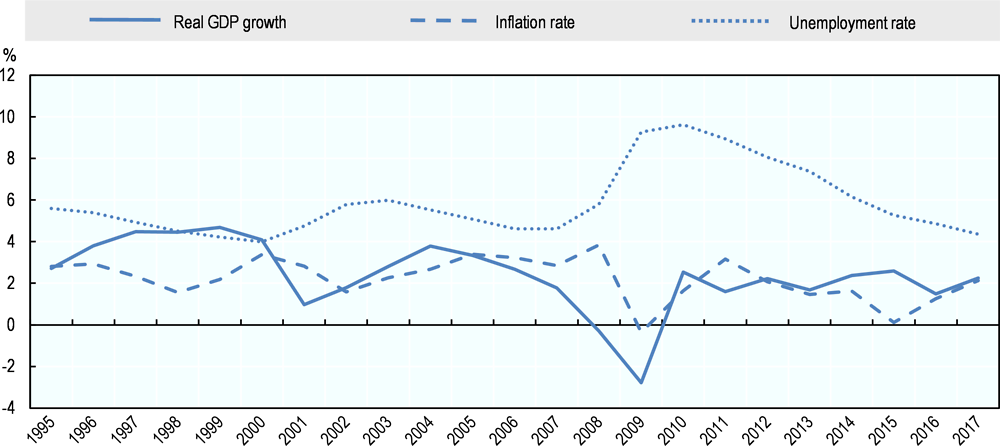
The United States is the world's second largest economy and the third largest by land area and population. US GDP per capita is more than double the average of all countries analysed in this report. Primary agriculture accounts for a small part of the economy – around 1.1% of GDP and 1.6% of employment – but agro-food exports account for over 11% of total exports. The US agricultural sector benefits from a large domestic consumer market, as well as abundant arable and pasture land and diverse climatic conditions that support production of a wide range of commodities. In recent years, total agricultural production has been divided relatively equally between crops and livestock, although their shares vary over time. Key industries include grains (maize and wheat), oilseeds (soybeans), cotton, cattle, dairy, poultry, and fruits and vegetables.
US economic growth increased in 2017, and unemployment is at its lowest level since 2000. The United States is a net exporter of agro-food products and the world’s largest agricultural exporter. In recent years, the US agro-food trade surplus has narrowed as exports declined in 2015 and 2016. Exports to China, Canada and Mexico accounted for around 44% of US agro-food exports in 2016, while over half of US agro-food imports are sourced from Mexico, Canada and the European Union. Exports are dominated by primary products for further processing and processed products for final consumers, while almost half of agro-food imports are processed products for final consumption.
Source: OECD statistical databases.
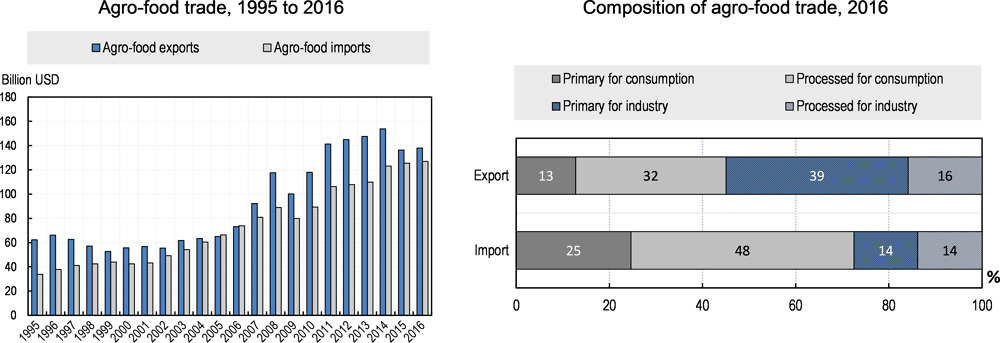
Note: Numbers may not add up to 100 due to rounding.
Source: UN Comtrade Database.
Total factor productivity (TFP) growth has driven agricultural output growth of 1% a year on average over the recent decade, offsetting declining use of primary factors and intermediate inputs. TFP growth averaged 1.7% a year between 2005 and 2014, driven by farm consolidation and the adoption of innovations in crop and livestock breeding, nutrient use and pest management, farm practices, and farm equipment and structures. The high productivity growth realised by US agriculture has been achieved with an overall reduction in environmental pressures from the sector. Nutrient surplus intensities at the national level have declined and are at similar levels to the average for OECD countries. Agriculture’s share in energy use is below the OECD average, as are GHG emissions. However, water stress in the United States is above the OECD average.
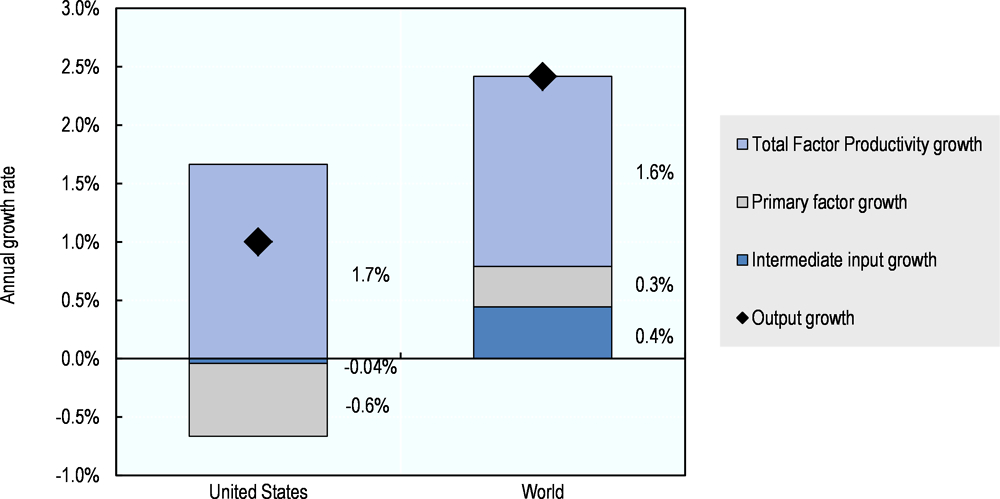
Note: Primary factors comprise labour, land, livestock and machinery.
Source: USDA Economic Research Service Agricultural Productivity database. Available at: www.ers.usda.gov/data-products/international-agricultural-productivity/documentation-and-methods.aspx#excel.
Description of policy developments
Main policy instruments
The Agricultural Act of 2014 (2014 Farm Bill) provides the basic legislation governing farm programmes for the period 2014 to 2018. The 12 titles of the 2014 Farm Bill authorise policies for commodity programmes, crop insurance, conservation on agricultural land, domestic food assistance, agricultural trade promotion and international food aid, farm credit, rural development, agricultural research, forestry on private lands, horticulture and organic agriculture, and bioenergy, among others. Almost 80% of budgetary spending under the 2014 Farm Bill is allocated to domestic food assistance programmes – primarily, the Supplemental Nutrition Assistance Program (SNAP) – with farm programmes accounting for just over 20% of the projected budgetary outlays.
Agriculture in the United States is also affected by a wide range of other legislation, at both Federal and local levels, including trade measures, food safety regulation, commodity trading and finance, tax policy, energy, and transportation.
The primary crop commodity programmes under the 2014 Farm Bill include programmes that make payments to producers with historical base acres of programme crops (wheat, feed grains, rice, oilseeds, peanuts and pulses) when prices fall below statutory minimums or when crop revenue is low relative to recent levels. Producers are not required to produce the covered commodity to receive payments on their historical base. Price Loss Coverage (PLC), a counter-cyclical price programme, makes a payment when market prices for covered crops fall below their fixed reference prices. Agriculture Risk Coverage (ARC), a revenue-based programme, makes a payment when actual revenue at the county level falls below rolling average benchmark revenues. For both programmes, payments are made on 85% of base acres. Participating producers were required to make a choice between the PLC and ARC programmes on a commodity-by-commodity basis, which then remains in place through 2018.
Sugar is supported by a tariff rate quota (TRQ), together with provisions for non-recourse loans and marketing allotments. Milk and dairy products are no longer supported by minimum prices with government purchases of butter, skim milk powder and cheddar cheese, but tariffs and TRQs continue. A programme for dairy producers, the Margin Protection Program for Dairy Producers (MPP-Dairy), insures the margin between milk price and feed costs for a premium, with payments made on enrolled on historical milk production. The related Dairy Product Donation Program (DPDP) makes purchases of dairy products for feeding programmes under certain conditions. Marketing assistance loans continue for wheat, feed grains, cotton, rice, oilseeds, pulses, wool, mohair and honey, as do border measures (including TRQs) for beef and sheep meat and some other products, although US agricultural tariffs are generally low.
The crop insurance programme offers coverage options for both yield and revenue losses. Traditional crop insurance makes available subsidised crop insurance to producers who purchase a policy to protect against losses in yield, crop revenue, or whole farm revenue. In addition, the Supplementary Coverage Option (SCO) offers producers additional area-based insurance coverage in combination with traditional crop insurance policies (but excluding crops for which producers have elected to participate in the ARC programme). The Stacked Income Protection Plan (STAX) provides premium subsidies to upland cotton producers to purchase area-based revenue insurance policies (cotton is not a covered commodity under the PLC and ARC programmes). Participants in the STAX programme may not purchase SCO policies for the same upland cotton acreage.
At the federal level, agri-environmental programmes focus on measures to: convert environmentally fragile cropland to approved conservation uses (including long-term retirement); and encourage crop and livestock producers to adopt practices that reduce environmental pressures. Since the enactment of the 1985 Farm Act, eligibility for most federal commodity programme payments is subject to the recipients having established an individual farm-based conservation plan to protect highly erodible cropland and wetlands. The 2014 Farm Act restored the conservation compliance eligibility requirement for crop insurance premium subsidies that was removed in 1996.
Other farm programmes include direct and guaranteed loans – including microloans – for farmland purchase and for operating credit, which are designed to assist producers who face difficulty obtaining credit on their own in the private market, particularly beginning, military veteran, and socially disadvantaged farmers. Farm Bill programmes also support public agricultural research and technical assistance, including programmes targeted specifically to specialty crops, organic production, and pest and disease prevention, as well as promotion of sustainable farming practices.
Ethanol and other biofuels production are mainly supported in the form of mandated blending for fuel use, and loan and grant programmes.
The United States is continually working to enhance agricultural productivity, even under increasing climate variability and extreme weather events. On climate adaptation, USDA continues to operate its network of Regional Climate Hubs. These link USDA research and programme agencies in order to develop and deliver science-based, region-specific information and technologies to agricultural producers and professionals to enable climate-informed decision-making, and provide access to assistance to implement those decisions. USDA also helps producers mitigate GHG emissions and adapt to a changing climate, while improving the natural resource base, by providing technical and financial assistance to land owners through various conservation practices and programmes. The United States signed the Paris Agreement on Climate Change on 22 April 2016, but has since announced its intention to withdraw from the Paris Agreement.
Domestic policy developments in 2017-18
The main policy developments in 2017-18 focused on modifications to existing Farm Bill programmes, disaster relief and regulatory reform. The Bipartisan Budget Act (BBA), enacted on 9 February 2018, included revisions to cotton and dairy programmes that take effect with the 2018 crop year. In response to the hurricanes and wildfires that occurred in 2017, a number of policy changes were enacted with the BBA but applied retroactively to 1 January 2017. The other major legislative change was the 2017 Tax Cuts and Jobs Act, which includes a number of provisions that will affect agricultural producers beginning 2018.
Most provisions of the 2014 Farm Act are scheduled to expire with the end of the 2018 programme year. The House and Senate Agriculture committees began work on a new farm bill as early as 2016 in some cases and continued with listening sessions in field locations and hearings in Washington, DC, throughout 2017. Development of legislation and floor debate is expected to take place in 2018.
A number of changes were made to programmes that make direct payments to producers. Seed cotton base acres will be eligible for payments under the Agriculture Risk Coverage (ARC) and Price Loss Coverage (PLC) programmes for the 2018 crop year, after the BBA established seed cotton as a covered commodity. Generic acres under the 2014 Farm Bill will be reallocated to either seed cotton or other covered commodities, based on plantings during 2009-2012.
A second Cotton Ginning Cost Share (CGCS) programme was authorised to provide assistance to cotton producers to help cover cotton ginning costs for the 2017 crop year. Payments were based on a producer’s 2016 cotton planted acres, multiplied by 20% of the average ginning cost for each production region. Producers were required to meet eligibility requirements, including active engagement in farming, conservation compliance, and adjusted gross income limits. Payments were limited to USD 40 000 per producer.
Several changes were made to the Margin Protection Program for dairy producers (MPP-Dairy). In August 2017, USDA announced a revision to the implementation of MPP-Dairy, which allows producers previously enrolled in the programme to opt out for the 2018 coverage year. The BBA also revised the programme by reducing lower tier premiums (i.e. for covered production history of up to the legislated threshold) and increasing the production history threshold for those premiums from 4 million to 5 million pounds. In addition, the payment calculation frequency was increased from bi-monthly to monthly.
On insurance, the BBA repealed the USD 20 million spending cap on livestock insurance products for premium subsidies to producers and administrative and operating reimbursements to insurance companies. As noted above, the BBA established seed cotton as a covered commodity under the Agriculture Risk Coverage and Price Loss Coverage (ARC/PLC) programmes. A provision of the new programme limits access to the Stacked Income Protection Plan (STAX) under Federal crop insurance. Beginning with the 2019 crop year, a farm enrolled in ARC or PLC for seed cotton in any crop year is not eligible to purchase STAX coverage in that crop year.
A number of measures were implemented to provide disaster assistance to producers affected by hurricanes and wildfires in 2017. In October 2017, the Dairy Assistance Program for Puerto Rico made up to USD 12 million available in assistance to licensed dairy operations to purchase feed to maintain their cattle following heavy damages sustained from Hurricane Maria. Eligible producers could receive vouchers worth the estimated costs of a one-month supply of feed based on the number of cows in the operation.
The BBA provided USD 2.36 billion in disaster assistance for crop, tree, bush, and vine losses caused by hurricanes and wildfires during 2017. Producers with crop insurance or Noninsured Crop Disaster Assistance Program (NAP) policies were limited to combined payments covering 85% of losses, while producers without crop insurance or NAP policies were limited to payments covering 65% of losses. NAP provides financial assistance to producers of non-insurable crops when low yields, loss of inventory, or prevented planting occur due to natural disasters.
The BBA also made adjustments to Supplemental Disaster Assistance programmes, applied retroactively to 1 January 2017. Under the Tree Assistance Program, the area limit was increased from 500 to 1 000 acres and payment limitations were removed. Eligible losses under the Livestock Indemnity Program were expanded to include value losses for livestock injured during eligible disasters and payment limitations were removed. The spending cap of USD 20 million was lifted for the Emergency Assistance Program for Livestock, Honeybees, and Farm-Raised Fish.
Finally, the BBA provided USD 24 million for emergency food assistance under the Commodity Assistance Program in jurisdictions with Presidential Disaster designations following hurricanes or wildfires in 2017, including Puerto Rico, the US Virgin Islands, and affected states. The funds were intended to provide additional emergency food allocations to affected families and individuals in those areas.
On tax concessions, the 2017 Tax Cuts and Jobs Act, enacted on 22 December 2017, reformed the US corporate and individual income tax structure beginning 1 January 2018. A number of provisions affect agricultural producers, including changes to: individual tax brackets; the corporate tax rate; Federal Estate, Gift, and Generation Skipping Transfer Tax; expensing provisions; deduction for pass-through cooperative income; interest deduction; and like-kind exchanges (Box 25.1).
The BBA provided USD 400 million in additional funds for the Emergency Conservation Program (ECP) to address damages resulting from hurricanes and wildfires in 2017. The ECP provides financial and technical assistance to producers for repairing damage to farmlands caused by natural disasters.
On food safety, the US Food and Drug Administration announced its intention to extend compliance dates for meeting agricultural water requirements established by the Food Safety Modernization Act’s (FSMA) produce safety rule (PSR). The FSMA PSR sets microbial quality standards for agricultural water, including irrigation water that comes into contact with produce. The length of the extension is under consideration and is intended to provide additional time to develop rules that will be workable across diverse agricultural conditions.
On rural development, in April 2017, the President established the Interagency Task Force on Agriculture and Rural Prosperity to identify legislative, regulatory and policy changes that could promote agriculture and prosperity in rural communities. The Task Force produced a report in January 2018 with 31 recommendations to guide the administration’s rural initiatives. The recommendations focused on aligning Federal government initiatives with state, local and tribal government priorities for addressing rural needs.
On biofuels, the BBA retroactively extended the second-generation biofuel producer credit, the blender’s tax credit for biodiesel and renewable diesel, the tax credit for alternative fuel vehicle refuelling property and the special allowance for second generation biofuel plant property until the end of 2017. The credits were not extended beyond 2017.
The 2017 Tax Cuts and Jobs Act (TCJA), enacted on 22 December 2017, reformed the US corporate and individual income tax structure beginning 1 January 2018. Provisions affecting agricultural producers include:
-
Individual tax brackets: Individuals will be able to deduct 20% of qualified business income earned through a pass-through business (partnership, S-Corporation or sole proprietorship). Most farms are pass-through businesses, with income taxed at individual rates. Individual tax brackets are reduced. The changes in individual taxes, including the 20% deduction on business income for pass-through businesses, expire at the end of 2025.
-
Corporate tax rate: The corporate tax rate will be 21%, a reduction for most corporations from 35%. At current rates of incorporation, 6% of family farms and 17% of non-family farms that are incorporated will benefit from this tax reduction. The corporate tax reduction is permanent.
-
Federal Estate, Gift, and Generation Skipping Transfer Tax: the lifetime exemption from these taxes is increased to USD 11.2 million from the previous USD 5.5 million per individual. Less than 0.5% of farm estates owe estate tax, although closer to 2% meet the threshold to file estate tax returns. The change will further reduce those shares. The estate tax changes are temporary, and expire at the end of 2025.
-
Expensing provisions: The limit on deductions allowed for purchases of financed or leased agricultural equipment will increase from USD 500 000 to USD 1 million, with the amount of expenses at which deductions begin to decline increasing from USD 2 million to USD 2.5 million. In addition, citrus producers will be allowed to immediately deduct replanting expenses incurred or paid after the enactment of the legislation.
-
Deduction for pass-through cooperative income: In the TCJA, specified agricultural or horticultural co-operatives were allowed to take a deduction of up to 20% of their gross income minus dividends distributed to co-operative members. Individual co-operative members were allowed a 20% deduction on their gross sales to their co-operative. As a result of provisions in the Consolidated Appropriations Act, enacted 23 March 2018, those original provisions were repealed. New provisions allow co-operatives to receive a deduction of up to 9% on income, which may be passed on to their members. There will be no separate deduction for co-operative members. These deductions for co-operatives and co-operative members expire at the end of 2025.
-
Interest deduction: The deduction for business interest income will be limited for producers with USD 25 million or more in gross receipts. Farm businesses with gross receipts larger than USD 25 million may be exempted from the limit, but they are then required to depreciate property in the business using the alternative depreciation system with a recovery period of 10 years or more.
-
Like-kind exchanges: Like-kind exchanges allow taxpayers to forego recognition of a gain or loss if property for productive use in a business or for investment is exchanged for property of a “like kind” to be held for productive use or investment. The new tax law limits like-kind exchanges to real property not held primarily for sale. Since most farmers use like-kind exchanges for exchanges of land, the new limit will affect only the small number of farms who have used like-kind exchanges for purchases of machinery or livestock.
Trade policy developments in 2017-18
On 18 May 2017, US President notified Congress of the Administration’s intent to renegotiate the North American Free Trade Agreement (NAFTA). Five rounds of negotiations were held in 2017 and negotiations continue in 2018.
On 13 September 2016, the United States initiated WTO dispute proceedings against China regarding its domestic support measures for agricultural producers of, among other crops, wheat, Indica rice, Japonica rice, and maize. The WTO Dispute Settlement Board (DSB) established a panel on 25 January 2017, which was composed on 24 June 2017. The panel has informed the DSB that it expects to issue a final report in late 2018 (WTO, 2017). On 15 December 2016, the United States filed a complaint against China’s administration of tariff rate quotas for rice, wheat, and maize. The DSB established a panel on 22 September 2017, which was composed on 12 February 2018 (WTO, 2018a).
In November 2017, the WTO Appellate Body ruled in favour of the United States in the case of Indonesia’s licensing regimes affecting importation of certain agricultural products (WTO, 2018b).
The United States proceeded with arbitration to determine the level of countermeasures against India in relation to its restrictions on imported US poultry and other products (WTO, 2018c).
In January 2017, China imposed antidumping and countervailing duties on imports of US distiller's dried grains with solubles (DGGS). In June 2017, the United States and Mexico reached agreement on revised agreements to suspend antidumping and countervailing duties on imports of Mexican sugar into the United States.
References
WTO (World Trade Organization) (2018a), “DS517: China — Tariff Rate Quotas for Certain Agricultural Products”, https://www.wto.org/english/tratop_e/dispu_e/cases_e/ds517_e.htm, viewed 5 March 2018.
WTO (World Trade Organization) (2018b), “DS478: Indonesia — Importation of Horticultural Products, Animals and Animal Products”, https://www.wto.org/english/tratop_e/dispu_e/cases_e/ds478_e.htm, viewed 16 March 2018.
WTO (World Trade Organization) (2018c), “DS430: India — Measures Concerning the Importation of Certain Agricultural Products”, https://www.wto.org/english/tratop_e/dispu_e/cases_e/ds430_e.htm, viewed 16 March 2018.
WTO (2017), “DS511: China — Domestic Support for Agricultural Producers”, https://www.wto.org/english/tratop_e/dispu_e/cases_e/ds511_e.htm, viewed 5 March.