Chapter 18. Norway
Support to agriculture
Norway’s progress in reducing support levels has been modest; its farming sector continues to receive one of the highest levels of support in the OECD area. The principal policy instruments supporting agriculture include border measures, budgetary payments and domestic market regulations.
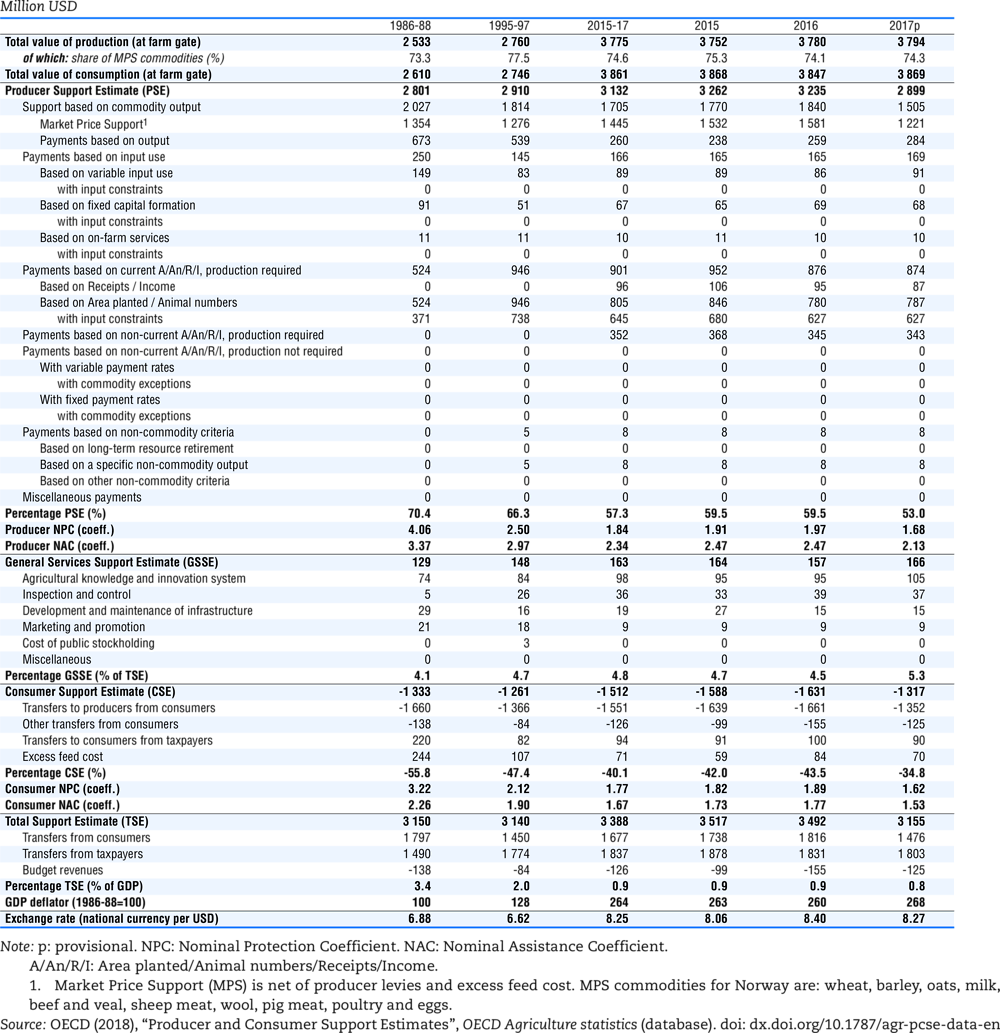
The Total Support Estimate to agriculture (TSE) was slightly less than 1% of GDP in recent years. Support to farmers (PSE) accounts for 57% of gross farm receipts, which is three times higher than the OECD average. Expenditures on general services for the sector as a whole (General Service Support Estimate - GSSE) are relatively small – around 5% of TSE – and mostly finance the agricultural knowledge and innovation system.
Market price support (MPS), mainly due to border protection, still remains the main component of support to farmers, and its share in support to farms has been reduced by only 2 percentage points between 1986-88 and 2015-17. While the share of potentially most production and trade distorting support has declined, it still represented most of the support in recent years. Support that is based on individual commodities (mainly market price support) represents 60% of support to farmers and is relatively evenly distributed among commodities. Effective prices received by producers are on average 84% above world market prices.
Main policy changes
In the White paper, released in December 2016, plans to reform agricultural policies are being considered. The White paper was discussed in the Parliament in April, but the government did not obtain a majority. The government aims to enhance the efficiency and competiveness of the sector by reducing and simplifying the number of support programmes, while maintaining the overall system of market regulation.
Assessment and recommendations
-
Agricultural support remains overly concentrated on maintaining the status quo and progress towards reform has been very modest. Despite lower price distortions, Norway’s agricultural sector remains among the most highly protected in the OECD area. There is considerable scope for accelerating the pace of reforms in order to achieve stated goals at less cost to taxpayers and consumers.
-
Further progress is needed to reduce the potentially most distorting support in order to increase exposure to market signals and eliminate measures impeding structural shifts towards a more productive agricultural sector.
-
The limited reforms agreed by the Parliament in April 2017, such as the commitment for some simplification in support measures and the rule changes on milk quota, are steps towards enhancing the efficiency and reducing policy-related transaction costs and should be accelerated.
-
Environmental taxation, which is a core pillar of Norway’s efforts to reduce non-ETS greenhouse gas (GHG) emissions and in tackling other environmental issues, should be considered for agriculture, along with other market-based climate mitigation measures. Efforts to identify measures for reducing emissions from agriculture are important.
-
Pursuing productivity growth while maintaining environmental protection and sustainable natural resource management should be a policy priority. In this context, re-orienting support towards general services, especially for the agricultural knowledge and innovation system is an avenue to be further explored.
Source: OECD (2018), “Producer and Consumer Support Estimates”, OECD Agriculture statistics (database), https://doi.org/10.1787/agr-pcse-data-en.
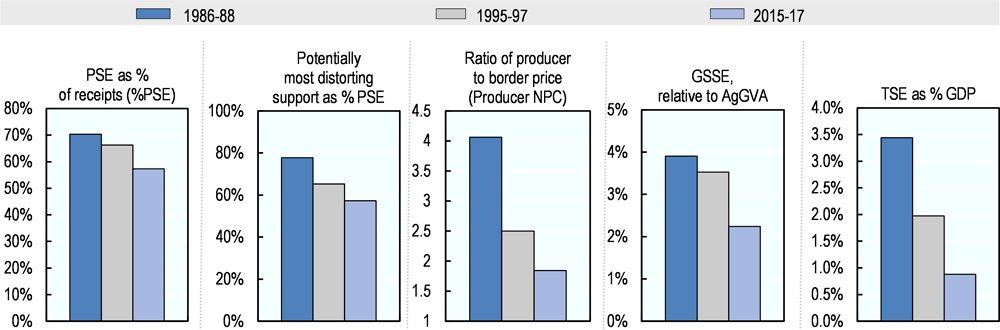
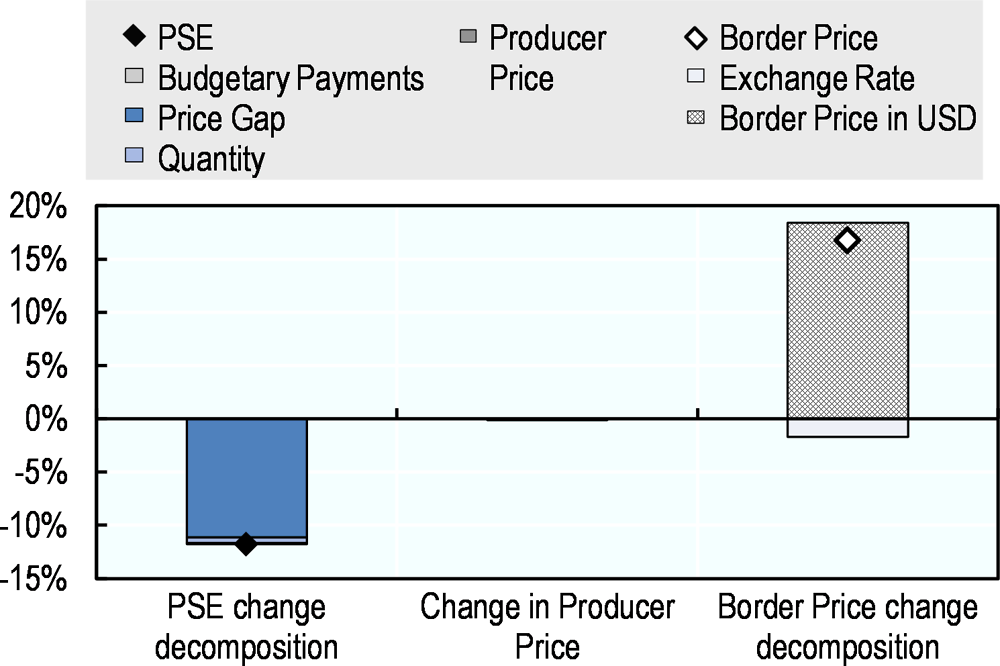
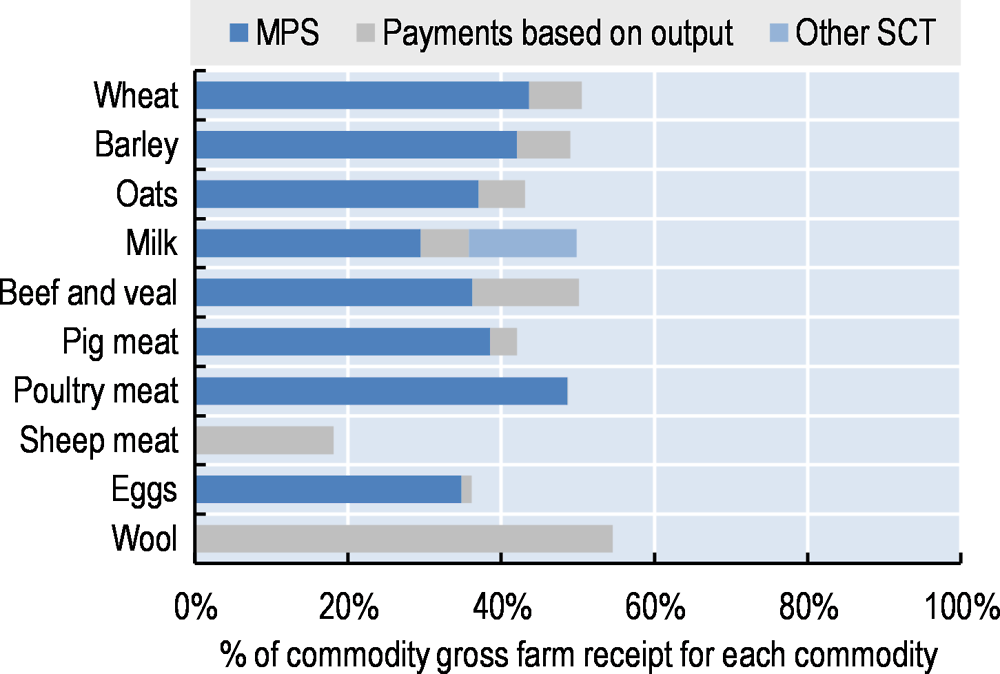
Support to farmers (%PSE) has declined gradually over the long term. In 2015-17, support has been around 57% of gross farm receipts, which is more than three times higher than the OECD average. The share of the potentially most distorting support has decreased over time, but it is still more than half of farmers support (Figure 18.1). Market price support is the main component of the most distorting support. The level of support in 2017 has decreased mainly due to higher border prices in USD, particularly for butter (Figure 18.2). Effective prices received by farmers, on average, were 1.8 times higher than world prices in 2015-17. Single Commodity Transfers (SCT) accounted for 39% of the total PSE. The share of the SCT in the commodity gross receipts is higher than 30% for all commodities, exempt for sheep meat and eggs (Figure 18.3). The expenditures for general services (GSSE), mainly on knowledge and infrastructure, relative to agriculture value added were in line with OECD average. Total support to agriculture as a share of GDP has declined significantly over time. About 92% of the total support is provided to individual farmers (PSE).
Source: OECD (2018), “Producer and Consumer Support Estimates”, OECD Agriculture statistics (database), https://doi.org/10.1787/agr-pcse-data-en.
Source: OECD (2018), “Producer and Consumer Support Estimates”, OECD Agriculture statistics (database), https://doi.org/10.1787/agr-pcse-data-en.
Contextual information
Agriculture constitutes a relatively small share of the economy. Land most suitable for farming, around 3% of the territory, tends to be located in the most populous and rapidly growing regions. While the contribution of agriculture to GDP and employment is small, Norway has consistently stressed the importance of the sector for policy priorities such as achieving food security and maintaining population in rural areas.
The sector produces a rather narrow range of commodities. In addition to sheep farming, the primary activity has traditionally been livestock (for milk and meat) and crops, such as grass and cereals (mainly used as animal feed). The farm structure is dominated by relatively small family farms, many of which are in remote locations.
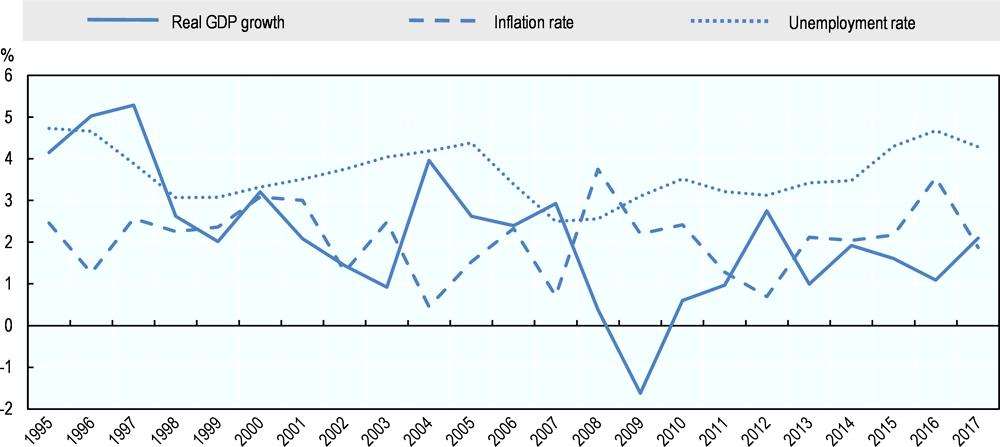
Sound management of natural resources and business dynamism has helped to boost Norway’s per capita GDP, which is now one of the highest in the world. Combined with its “Nordic model” ensuring inclusiveness and low inequality, Norway exhibits impressive levels of well-being in many dimensions. Sustaining Norway’s inclusive society will require successful economic diversification away from oil-related activities and continue seizing opportunities from globalisation and digitalisation.
Norway is a net importer of agricultural products: agro-food imports represent around 10% of total imports, while agro-food exports represent 1% of total exports. The vast majority of Norway’s agricultural production is consumed domestically. Imports of products mostly take place where domestic production does not meet demand. Most of the agro-food trade is for final consumption.
Source: OECD statistical databases.
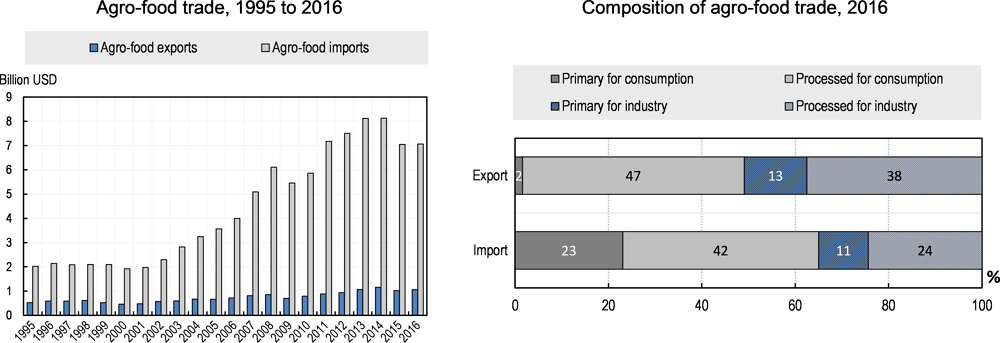
Note: Numbers may not add up to 100 due to rounding.
Source: UN Comtrade Database.
Over the 2005-14 period, agricultural output is estimated to have increased at a slow annual pace. Variable inputs and fixed factors of production have declined, while total factor productivity is estimated to have increased – at a rate that is slightly higher than the world average. Overall, pressure from agriculture on the environment has decreased, as is shown by the decrease in nutrient surpluses per hectare, in air emissions and energy use from agriculture. The lowering of nutrient surpluses has reduced the risk of environmental pressures on soil, water and air. This reflects both improvements in nutrient use efficiency by farmers and slow growth of agricultural production.
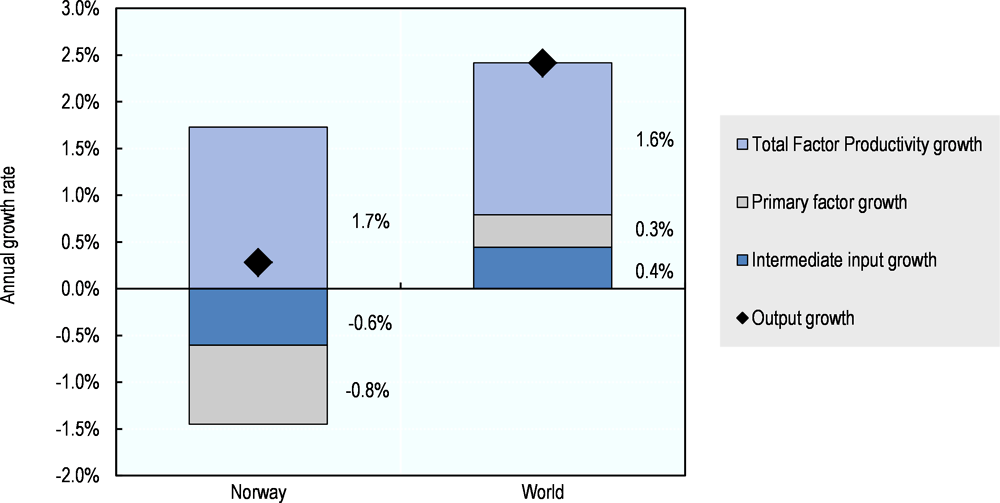
Note: Primary factors comprise labour, land, livestock and machinery.
Source: USDA Economic Research Service Agricultural Productivity database. Available at: www.ers.usda.gov/data-products/international-agricultural-productivity/documentation-and-methods.aspx#excel.
Description of policy developments
Main policy instruments
The strategic objectives of agricultural and food policies, as set out in the White Paper No. 11 (2016–17) “Change and development - A future-oriented agricultural production” are: food security; agriculture throughout the country; creating more added-value; and sustainable agriculture. The agricultural policy aims at safeguarding agricultural resources, developing know-how and contributing to the creation of employment and value added in farming and farm-based products throughout the country. Agricultural support policy is a component of Norway’s regional and rural policies.
The principal policy instruments supporting agriculture include border measures, budgetary payments and domestic market regulation based on the Marketing Act. The Act covers certain types of meat (beef, mutton, pork and poultry); milk, butter and cheese; eggs; cereals and oilseeds; potatoes, vegetables, fruit and berries; and fur skins.
Target prices are provided for milk, pork, grains, some fruits and vegetables. Target prices and the budgetary framework for payments to farmers are negotiated annually between the government and farmers’ organisations. Marketing fees are collected from producers to finance marketing activities dealing with surpluses, including export subsidies for livestock products. Export subsidies of processed products to the European Union and marketing activities for horticultural products are financed directly by the government.
Milk production quotas were introduced in 1983 and a system of buying and selling quotas was introduced in 1997. Most of Norway’s tariff-rate-quotas were eliminated in 2000 when the WTO bound tariff rates became equal to the in-tariff quota rates. Tariffs for some products, particularly livestock products are set between 100-400% although there is a system of “open periods” for imports at reduced tariff rates when domestic prices rise above threshold levels.
Various direct payments to farmers, including area and headage payments as well as payments based on product quantities (meat) continue to be provided. Many of these payments are differentiated by region and farm size in order to provide adequate income support across all type of farms and regions. Environmental levies on agricultural pesticides are applied.
Domestic policy developments in 2017-18
The White paper No. 11 (2016-17) “Change and development - A future-oriented agricultural production”, released in December 2016, makes suggestions for reform of agricultural policies. The White paper was discussed in the Parliament in April, but the government did not obtain a majority to vote it through. The government aims to enhance the efficiency and competiveness of the sector by reducing and simplifying the number of support programmes, while maintaining the overall system of market regulation.
In June 2017, an agreement was reached between the government and the two farmers’ organisations involved in the agricultural negotiations. The main changes in the agreement were: i) an increase in target prices with a total budgetary effect of NOK 150 million (USD 18 million) from 1 July 2017; ii) an increase in budgetary support of NOK 377 million (USD 46 million) from 2017 to 2018; iii) transfer of NOK 79 million (USD 10 million) from the 2016 budget and an increase in the tax relief on NOK 19 million (USD 2.3 million); iv) increased support for the investments and development programme; and v) increased payments for grazing animals.
For 2017 and 2018, both the basic milk quotas and the actual production capacity are reduced by 2%. In 2017, farmers selling cow milk quota were allowed to sell up to 80% of their quota at a free price directly to other producers within a production region (mainly defined as the county), and a minimum of 20% had to be sold to the government at a fixed price. Following the December 2016 White Paper, the Parliament accepted for cow milk to reduce the number of production regions for quota redistribution from 18 to 14.
The National Environmental Programme contains the main agri-environmental measures, such as the Acreage Cultural Landscape Support, payments to extensive grazing, payments for grazing animals, organic agriculture, Regional Environmental Programmes (REP) and special environmental measures in agriculture. The budget for the REP was increased from NOK 422.4 million (USD 50 million) to NOK 432.4 million (USD 52 million). Examples of programmes include payments to reduce water pollution from agricultural fields, environmentally-friendly spreading of manure, mowing small (abandoned) fields with high or special biodiversity in the forest and mountains areas, grazing on islands, maintenance around heritage sites in the agricultural landscape, etc.. The 2016 White Paper advocates: a revision of the National Environmental Programme; accordance of higher priority to climate adaptation; and continuing the work on simplification and enhancement of goal-orientation of programmes.
Although carbon pricing is extensive in Norway, emissions from agriculture are neither subject to a carbon-dioxide tax nor included in the European Trading System (ETS). Norway’s Paris commitment is to reduce greenhouse-gas (GHG) emissions by at least 40% by 2030 compared with the 1990 level. Norway is in dialogue with the European Union on joint fulfilment of the 2030 climate commitment. The government will appoint a Committee to evaluate the possibility of introducing a gradually increased CO2 tax for agriculture and to propose other climate mitigation measures. However, Norway has implemented other measures – both statutory and financial as well as measures related to information – affecting the emissions from agriculture.
In June 2017, the Parliament adopted a Climate Change Act (Lov om klimamål) which establishes by law Norway’s target of becoming a low-emission society by 2050. The Act has an overarching function in addition to existing environmental legislation. It sets binding emission reduction targets for 2030 and 2050 and establishes by law the long-standing political aim to become a low emission society by 2050. The Act also calls for the government to appoint a working group to evaluate the existing support schemes for climate measures at farm level. An agreement was signed in June 2017 with the food industry to halve food waste by 2030.
The rural development aspects of Norwegian agricultural policy include several programmes designed to stimulate innovation and the establishment of alternative businesses on farms and alternative employment in rural areas. Most of the funding is financed through the Agricultural Development Fund. The proposal of the total allocation of funds for rural development (on the Agricultural Agreement) was NOR 1 148 million (USD 137 million) for 2017 and NOR 1 124 million (USD 136 million) for 2018.
Trade policy developments in 2017-18
Article 19 of the European Economic Area (EEA) agreement provides that contracting parties will periodically carry out reviews of the conditions of their trade in agricultural products. Another round of these reviews was agreed in 2013 and finalised in April 2017, but the outcomes of these reviews have not yet been implemented.
As part of the European Free Trade Association (EFTA), Norway has negotiated 27 Free Trade Agreements with 38 partner countries. Free trade negotiations are currently being conducted between EFTA and India, Indonesia, Viet Nam, Malaysia, Philippines and Ecuador. EFTA has also started re-negotiations of free trade agreements with Mexico, Chile, Turkey and the Southern African Customs Union (SACU) - Botswana, Lesotho, Namibia, South Africa and Swaziland. These Free Trade Agreements and negotiations include processed agricultural products and a range of primary agricultural products. Norway and China have held further meetings on a bilateral agreement in 2017.
As from 1 January 2015, Norway unilaterally eliminated import duties on 114 agricultural tariff lines. While these duties were low (and not of significant importance for the protection of Norwegian agricultural production), their elimination resulted in reduction of customs procedures and administrative costs.
At the WTO Ministerial Meeting in Nairobi on 19 December 2015, the member states decided that if the developed countries (Norway, Canada and Switzerland) abolish export subsidies on products destined for the least developed countries, they would be permitted to provide export subsidies for processed products, dairy products and swine meat until the end of 2020. The Norwegian Parliament has adopted a Government recommendation that Norway would phase out all export subsidies for agricultural products by the end of 2020.