Chapter 5. Sugar
Market situation
After two consecutive seasons of supply shortage, global sugar production rebounded in the 2017 marketing year (October 2017-September 2018), with growth close to that recorded five years ago. Good weather conditions in India and Thailand, increased production in the People’s Republic of China (hereafter “China”) and the end of production quotas in the European Union are the main reasons for this increase. But the largest producer, Brazil, experienced a decline in sugar output as processing sugarcane into ethanol became more profitable than sugar production.
Global sugar imports dropped by 10% in 2016 and despite the lower prices in 2017, imports continued to decline, mainly due to lower imports in China. On the demand side, there is no growth in per capita consumption in high consuming countries, where consumers' attitude towards sugar has changed because of health concerns associated with high consumption levels. Prices increased during the first months of the 2016 marketing year, but started to decline during the first quarter of 2017. As a result, annual average prices during the 2017 marketing year are expected to be lower than in 2016, but still slightly above the average of the last 25 years.
Projection highlights
Starting at relatively low levels, the price of raw sugar in USD is projected to increase in nominal and real terms during the next marketing year (2018). Over the remainder of the medium term, it is projected to follow a moderate upward trend in nominal terms, in line with the inflation rate of 2.3% p.a., but a downtrend in real terms. The white sugar price is foreseen to follow a similar pattern. A relatively tight white sugar premium (the difference between white and raw sugar prices) at the start of the projections (USD 62/t) is expected to widen slightly for a couple of years to USD 81/t, but will stay relatively low compared to the average over the last decade (USD 93/t).
Both sugarcane and sugar beet are foreseen to continue to expand in producing countries, driven by remunerative returns in comparison to alternative crops. Sugarcane will remain the main crop to produce sugar (about 86%) and is cultivated largely in tropical and sub-tropical countries in Africa, Asia and Latin America and the Caribbean. The remainder will come from sugar beet, which is grown in more temperate zones, mainly Europe. The share of sugar from sugar beet relative to sugarcane is expected to remain relatively constant on the outlook period, at around 14%.
Over the next ten years, 83% of the increase in sugar output is projected to originate in developing countries. In absolute terms, major changes in global production are expected in India (+20%), followed by China (+11%), Brazil (+11%), Thailand (+9%) and the European Union (+5%). Brazil is projected to remain the main producer, providing more than a fifth of the world's sugar production, although its sugar sector could face increased competition from the use of sugarcane for ethanol. A slower growth of production compared to the previous decade is foreseen in Asia (India, Pakistan and Thailand) and Europe, which explains the slower annual growth in global sugar production over the outlook period (+1.5%) compared to the previous decade (+2.0%).
Demand for caloric sweeteners – sugar and high fructose corn syrup (HFCS) – is projected to grow by 33 Mt over the outlook period to reach 213 Mt in 2027 (Figure 5.1). The annual growth rate of 1.5% over the projection period is slightly lower than the one experienced during the last decade (1.6% p.a.). This lower growth rate is the result of the slowdown in global population growth and stagnant per capita consumption growth in developed countries and certain developing countries (Brazil, Egypt, Mexico, Paraguay, South Africa, Turkey), where per capita consumption has reached levels that raise health concerns (obesity, diabetes and other associated health issues). In countries with lower consumption levels, particularly in Asia and Africa, population growth and urbanisation are expected to sustain growth in sugar consumption, driven by increased consumption of sweetened beverages and prepared food products, particularly in Asia and Africa.
Note: Sweeteners include sugar and high fructose corn syrup
Source: OECD/FAO (2018), “OECD-FAO Agricultural Outlook”, OECD Agriculture statistics (database), https://doi.org/10.1787/agr-outl-data-en.
The distribution of global trade is expected to remain fairly constant over the projection period, with Brazil keeping its role as the main sugar exporter (45% of global trade). White sugar exports will represent nearly 34% of global trade over the outlook period, an increase from the 31% observed during the base period. Exports of white sugar are expected to increase in the European Union in the short term following the end of production quotas, and in countries that have built refineries (Middle Eastern countries and Algeria). Imports will remain diversified, mostly driven by demand from Africa and Asia.
The outlook for sugar markets depends on several factors on the supply side. These include climatic conditions, prices of other competing crops or products, the evolution of input prices and exchange rates, domestic policies and also import tariffs (which have increased in China). The demand side is more stable with stronger prospects in countries where consumption is still relatively low, but weak projections in countries where high levels of per capita consumption have been reached. Many developed countries and some developing countries, including Mexico, Chile, Thailand and Saudi Arabia, have introduced a sugar tax on soft drinks in an attempt to reduce over-consumption of sugar. These taxes have prompted the food industry and manufacturers to adapt through product reformulation or the use of alternative sweeteners. The projections do not take into account unsigned policies.
Market trends and prospects
Prices
With a global sugar surplus expected for the current marketing year, international sugar prices are rather low at the start of the outlook period, reversing the uptrend observed over the last two crop years. Over the medium term, prices are expected to recover due to increased demand in countries where per capita consumption is low compared to the world average. However, price increases will be modest as supplies are expected to remain abundant following high prices in recent years.
Sugar prices are foreseen to be higher than the average of the last 25 years in nominal terms, but lower when expressed in real terms. By 2027, the nominal world price is projected to be USD 392/t (USD 17.8cts/lb) for raw sugar and USD 472/t (USD 21.4cts/lb) for white sugar (Figure 5.2). The white sugar premium is currently low with higher white sugar deliveries from the European Union and increasing refining capacities in Middle Eastern countries and Algeria. The premium is expected to average around USD 79/t over the outlook period.
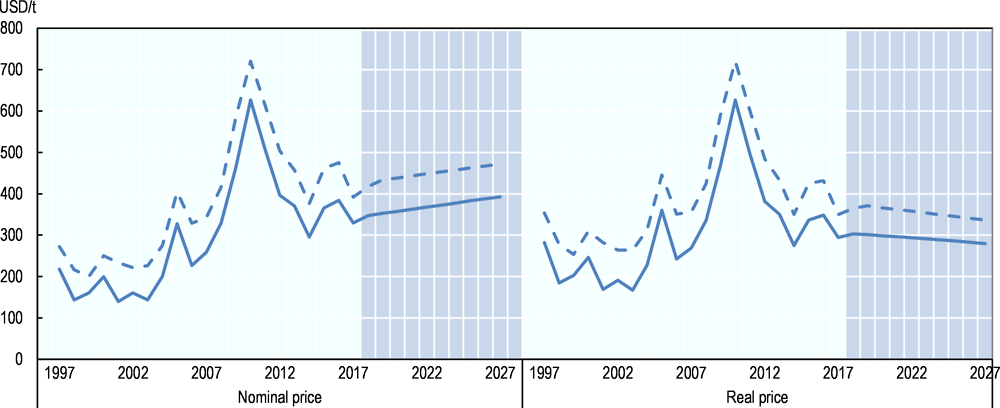
Note: Raw sugar world price, Intercontinental Exchange contract No.11 nearby futures price; Refined sugar price, Euronext Liffe, Futures Contract No. 407, London. Real sugar prices are nominal world prices deflated by the US GDP deflator (2010=1).
Source: OECD/FAO (2018), “OECD-FAO Agricultural Outlook”, OECD Agriculture statistics (database), https://doi.org/10.1787/agr-outl-data-en.
Year-to-year sugar price variations are expected to be dampened by the phasing out of trade-distorting sugar support policies in several key sugar markets. Recent policy changes on the supply side include the elimination of the sugar quota system in the European Union in October 2017 and the removal of production quota and price support in Thailand at the end of 2017. India had already introduced policies in 2013 to counteract recurring production cycles, the results of which are still to be assessed. Reforms on the demand side are also expected to take place, with cuts to sugar consumption subsidy programmes in response to budgetary pressures (e.g. Malaysia and Egypt). In addition, demand for sugar is expected to be influenced by sugar taxes on sugar-sweetened beverages that are already in place in several countries.
Production
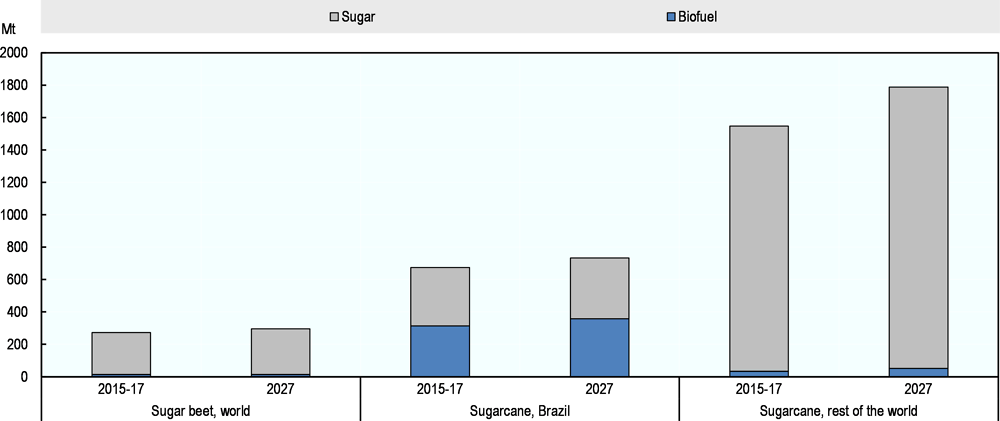
Given its favourable returns per hectare compared to competing crops, production of sugar crops is foreseen to expand in many parts of the world. Production of sugarcane, the main sugar crop, is expected to grow by 1.1% p.a., compared to 2.1% p.a. during the last decade. Increases are projected to come from a combination of higher yields and area expansion. Prospects are less robust for sugar beet, with nearly no growth in production (+0.1% p.a.) compared to the last decade (+2.5% p.a.) (Figure 5.3). Some expansion is anticipated in Egypt, China, the Ukraine, Eastern Europe and Turkey. In the European Union, sugar beet production reached maximum levels in 2017 due to the abolition of production quotas, but its share in global sugar beet production is projected to decrease from 45% in 2017 to 40% in 2027.
At the global level, the share of sugar crops allocated to sugar production is expected to remain flat over the projection period (81% for sugarcane and 95% for sugar beet), which means that the share of world sugar crops used for world ethanol production is not expected to change much. But Brazil will continue to be the main producer of sugar and sugarcane based ethanol, producing 34% of the world's sugarcane by 2027, which will be used for 20% of global sugar production and 88% of global sugarcane based ethanol production (versus 22% and 90%, respectively, during the base period).
Growth in world sugar production is expected to slow to 1.5% p.a. over the projection period compared to 2.0% p.a. in the previous decade. Most of the production increases are expected to occur in developing countries which will represent 77% of global sugar production in 2027 (compared to 76% during the base period). The leading regions are Asia and Latin America and the Caribbean. Asia is projected to expand its share in global production from 36% during the base period to 38% in 2027. Latin America and the Caribbean, on the other hand, are expected to play a smaller role in global production with their share decreasing from 35% during the base period to 33% in 2027. The drop in Latin America and the Caribbean is mostly due to lower growth in Brazil, the biggest supplier. Brazil’s dominance as the world's top producer and exporter will be maintained over the outlook period but its production will continue to be challenged by domestic ethanol production (from sugarcane). The crop will also continue to suffer from a lack of renewal of plants for several years. At the end of the projection period, sugar production in Brazil is expected to reach 42 Mt (+4 Mt compared to the base period, about 3 Mt less than the increase foreseen in India).
Source: OECD/FAO (2018), “OECD-FAO Agricultural Outlook”, OECD Agriculture statistics (database), https://doi.org/10.1787/agr-outl-data-en.
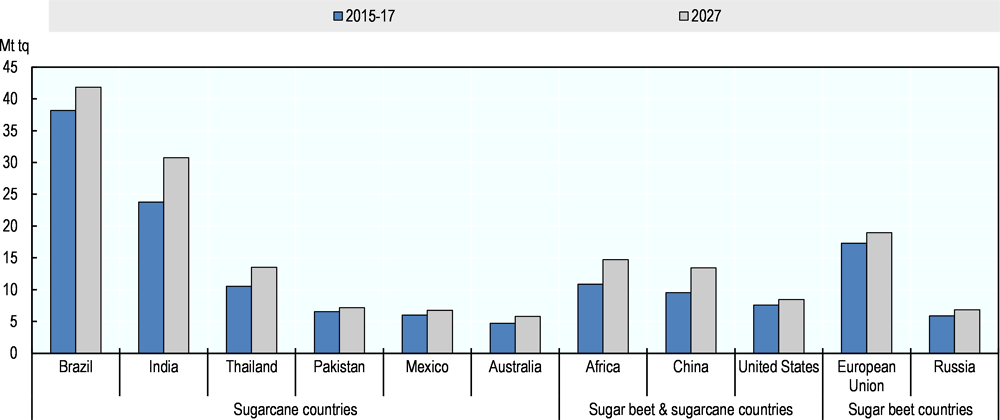
The world's second largest producer is India, where sugar production is expected to expand more steadily as a result of recent sugar policy reforms that have ensured greater stability in terms of prices paid to farmers. Driven by sustained domestic demand for sugar, production is expected to increase by 7 Mt over the next decade, reaching 31 Mt in 2027. Thailand will maintain its market position as the world's fourth largest producer (the European Union is the third largest), but is projected to experience a slower growth compared to recent years due to the elimination of price supports from January 2018 onwards and due to the fact that sugarcane expansion occurs in areas less suitable for production. By 2027, Thailand is projected to produce 13.5 Mt, which is close to China's production level. China is projected to experience an accelerated growth in sugarcane and sugar beet production during the first years of the projection period, supported by the 2015-2020 National Plan. By 2027, production in China is expected to reach 13.4 Mt, mainly through increases in yields and area. Strong prospects are also foreseen in Pakistan, where the government will continue to support sugar production through guaranteed prices to farmers and subsidized exports.
In Africa, growth in output will be driven by strong domestic demand for sugar as well as trade opportunities. Sugar output is projected to increase by 36% by the end of 2027 compared to the base period (+4 Mt) as a result of production expansion in Sub Saharan countries supported by investments at the farm and mill levels. Despite this production growth, the continent will continue to represent a small share of the world market (7% in 2027).
Developed countries account for less than a quarter of global sugar output (Figure 5.4). Compared to the developing world, growth in sugar production will be much lower over the projection period (0.4% p.a. versus 1.9% p.a.). Relative to the base period, the main increases in volume are projected to occur in the European Union, the world's third largest producer (+1.7 Mt), followed by Australia and the Russian Federation (both nearly 1 Mt more) and the United States (+0.9 Mt). The sugar sector in the United States remains heavily influenced by government policy, which is based on domestic support (the Sugar Loan Program, Sugar Marketing Allotments, and the Feedstock Flexibility Program) as well as trade barriers (TRQs, regional agreements and Export Limits for Mexico). On the other hand, a decline is projected in the European Union (-0.85% p. a), following the surge in production that occurred with the abolition of sugar quotas during the base period, in October 2017.
World sugar stock levels are projected to diminish moderately, partly due to the release of some of China's stocks on the market. The global stock-to-use ratio is expected to decline to 43% in 2027, from 47% in the base period.
Note: Add the note here. If you do not need a note, please delete this line.
Source: OECD/FAO (2018), “OECD-FAO Agricultural Outlook”, OECD Agriculture statistics (database), https://doi.org/10.1787/agr-outl-data-en.
Consumption
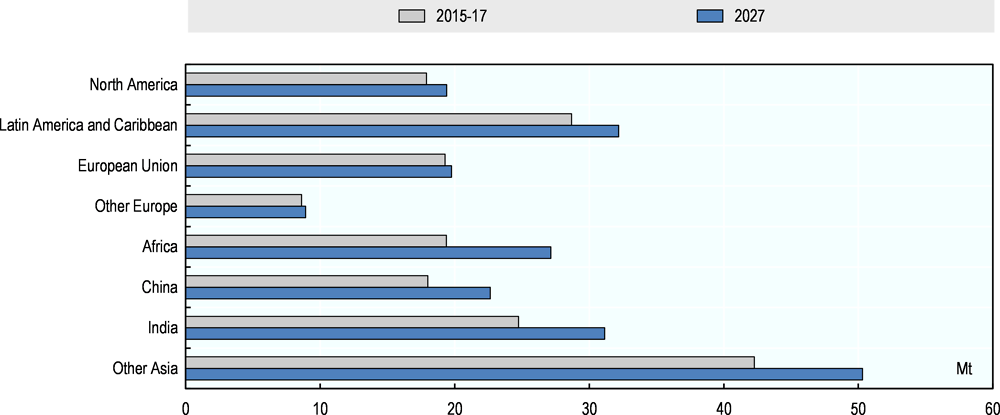
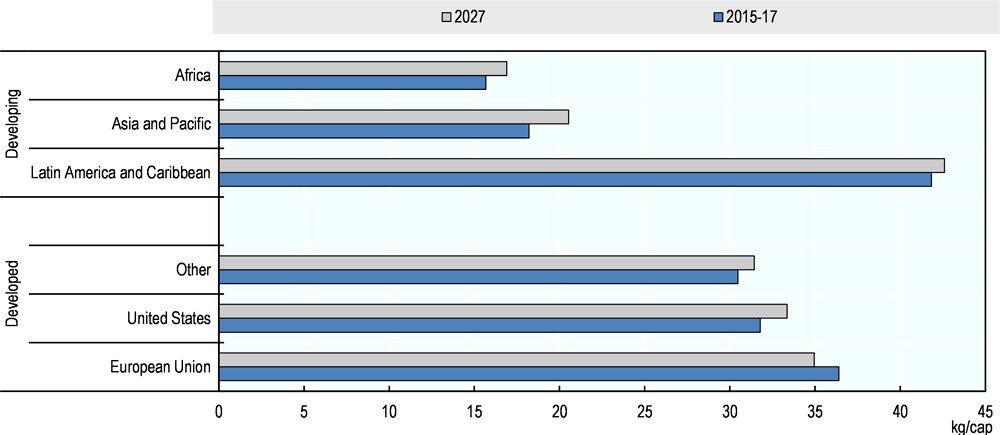
Global consumption of sugar is projected to grow at around 1.48% p.a., slightly lower than in the previous decade, to reach 198 Mt in 2027. It will be influenced by the slight slowdown in population growth and sluggish global economic growth. Over the outlook period, the average world level of per capita consumption is expected to increase from 22.4 kg/cap to 23.8kg/cap, although considerable variations between regions and countries occur (Figure 5.5).
Increases in global sugar consumption over the next ten years are expected to come mainly from the developing countries who will account for 94% of the additional demand. The largest contributions to additional demand will occur in Asia (60%) and Africa (25%), two sugar deficit regions. With higher demand for processed products, sugar-rich confectionery and soft drinks, growth prospects are high in urban areas in Asian and African countries where the levels of consumption are low compared to other regions. Conversely, little growth is foreseen in Latin America and the Caribbean where consumption is already high.
In Asia, it is expected that India, followed by China, Indonesia and Pakistan, will experience the largest increases in sugar consumption. Per capita consumption is very low in China and LDC Asia, less than 12 kg per year during the base period, but the annual growth rate in those countries will not change much compared to the last decade. In Africa, the highest increases in total consumption are projected in Egypt and several Sub-Saharan countries but per capita consumption will stay below 10 kg per year in LDC Sub-Saharan countries.
Source: OECD/FAO (2018), “OECD-FAO Agricultural Outlook”, OECD Agriculture statistics (database), https://doi.org/10.1787/agr-outl-data-en.
In contrast, the level of sugar intake per person in many developed countries is projected to show a decline, consistent with their status as mature or saturated sugar markets. Slowing population growth, dietary changes based on increased health consciousness and nutritional commitments taken by multinationals will continue to impact their markets. The decline will be the strongest in the European Union where sugar markets will face, in addition, increased competition with isoglucose (HFCS) after the abolition of sugar quotas in 2017. The reverse will however occur in the United States where even if sweetener consumption is expected to be steady, the share of sugar in sweetener consumption is expected to increase at the expense of that of HFCS. Rapid expansion of sugar demand is, however, foreseen in the Russian Federation and Ukraine where sugar will be considered as a staple product as long as slow economic growth persists.
Owing to its competitiveness in producing sugary soft drinks, HFCS consumption (dry weight) is projected to grow by 16% or 2 Mt by 2027. The European Union will be the main driver of this increase as the abolition of the HFCS quota in 2017 will lead to a surge in isoglucose availability in the sugar deficit countries of the region. Consumption growth is also expected in China and – to a lesser degree – in Mexico. In the latter, the share of HFCS in the demand for sweeteners is expected to remain stable over the outlook period due to the Export Limit policy implemented in the United States which limits sugar exports from Mexico to the United States. However, in the United States, the leading HFCS producer, demand for HFCS as a share of total sweetener consumption is expected to continue to decline from 38% during the base period to 36% in 2027. This reduced demand is a direct result of the contraction of the market for carbonated soft drinks and the desire of some consumers to avoid this sweetener.
Trade
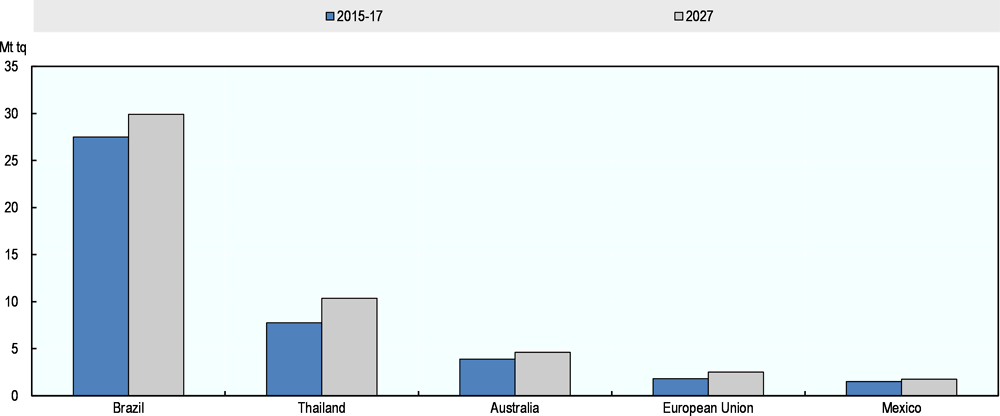
Over the coming decade, sugar exports (Figure 5.6) are expected to remain highly concentrated, with Brazil keeping its position as the leading exporter (45% of world trade). The weakening of its currency vis-à-vis the US dollar over the projection period will help maintain the industry’s competiveness, but the country will be challenged by Thailand, an established Asian competitor. Brazil and Thailand are each foreseen to expand their exports by 2.5 Mt compared to the base period. Thailand, the world’s second largest exporter, will benefit from steady growth in production and will as a result continue to gain market share, accounting for 16% of world exports in 2027 versus 13% during the base period. In Australia, investments in irrigation, expansion of the sugarcane area and increased milling capacities will lead to higher production, which will in turn boost export sales over the medium term.
Source: OECD/FAO (2018), “OECD-FAO Agricultural Outlook”, OECD Agriculture statistics (database), https://doi.org/10.1787/agr-outl-data-en.
In the European Union, the abolition of sugar and isoglucose quotas will lead to higher sugar and HFCS production, which will result in an increase of its renowned high quality white sugar exports (+38% in 2027 compared to the base period), even at a premium price. Those exports will reach sugar mainly deficit countries in the MENA and Far East regions, but will also face competition from traditional sugarcane refineries in the MENA region.
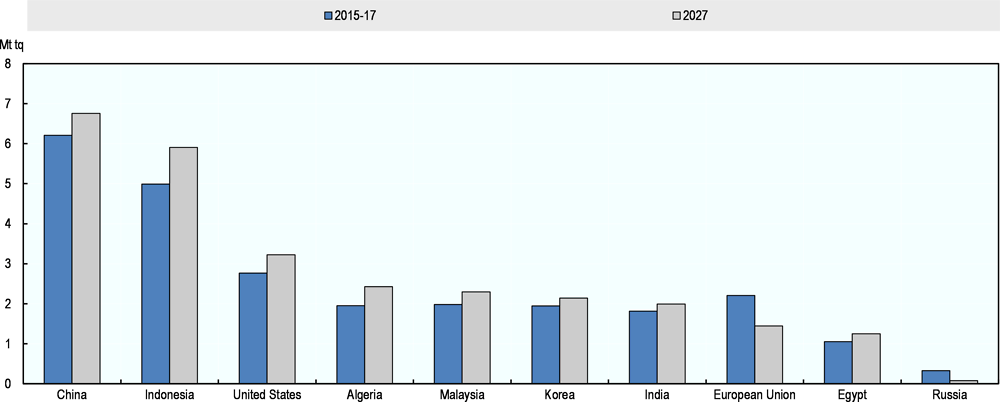
World sugar imports are more dispersed than exports (Figure 5.7). According to the outlook projections, Asia and Africa will see the strongest growth in sugar demand and this will influence the growth in imports for those regions. During the base period 2015-2017, China and Indonesia were the leading importers followed by the United States and the European Union, but over the projection period, China is expected to become the leading sugar importer, followed by Indonesia and the United States (respectively 6.8 Mt, 5.9 Mt and 3.2 Mt). EU sugar imports are projected to drop by 34% over the next ten years due to the abolition of the sugar quotas. The EU HFCS trade will not change much as the production increase that will occur after 2017 will mostly satisfy internal demand.
The United States, traditionally a sugar deficit region, will continue to be influenced by its policies which tend to foster domestic production and control the level of imports. The projected low sugar prices during the outlook period provide little incentive to expand sugar production. This will result in a continuation of imports established under the TRQ duty-free imports through WTO and FTAs agreements, and the Export Limit set by the US Department of Commerce that defines Mexico’s market access to the United States. Given the relatively higher sugar prices in the United States, Mexico will continue to export its sugar primarily to the United States, but the share allocated to the world market is foreseen to expand from 25% during the base period to 29% in 2027. In return, Mexico would resort to US HFCS imports (+19% or 176 kt by 2027) to fill its demand for sweeteners.
Source: OECD/FAO (2018), “OECD-FAO Agricultural Outlook”, OECD Agriculture statistics (database), https://doi.org/10.1787/agr-outl-data-en.
Main issues and uncertainties
The projections in this Outlook assume stable macro-economic and weather conditions and make specific assumptions with respect to crude oil prices. A shock to any of these variables could create significant variability in the market because large producers are concentrated in a small number of countries.
The projections for Brazil are uncertain due to the ongoing financial consolidation as well as a potential recovery in investment in the sector. The country is also challenged by the evolution of biofuel policies and prices that could indirectly affect the sugar markets. In addition, the increased planting of genetically modified sugarcane plants, whose commercial use was approved a year ago, could also impact sugarcane yields in a couple of years and therefore change the level of production of the sub-products.
The outlook for Thailand is rather positive, but the competitiveness of its sugar sector depends on the extent to which sugar producers will adapt to the new policy environment with less support to the industry. This could also create some instability on world markets, given the country's large contribution to sugar exports.
Trade distortions in international sugar markets will persist, which creates an additional source of uncertainty. Changes in international sugar prices are not fully transferred to domestic sugar producers and consumers, even if some world sugar markets have undergone a number of reforms and structural changes (i.e. the recent elimination of sugar quotas in European Union and Thailand, the fair price paid to farmers in India since 2013). To protect their domestic markets, many countries use trade policy instruments: high out-of-quota tariffs (China); adjustment to WTO TRQ and Export Limit for Mexico (United States); exports subsidies to protect sugar domestic sugar prices (Pakistan, India); high import tariffs (European Union, Russian Federation, United States); regional agreements (NAFTA agreements, European EPAs and EBA).
Prospects for demand are also uncertain. In view of growing evidence on the detrimental effect of excessive sugar consumption on human health, consumption levels could go down in the future. This could also be reinforced by government policies (such as taxes) and pro-active actions taken by the food industry, such as product reformulation or use of alternative sweeteners.