Health expenditure per capita
The level of per capita health spending, which covers both individual and population health care needs, and how this changes over time, depends on a wide range of demographic, social and economic factors, as well as the financing and organisational arrangements of the health system.
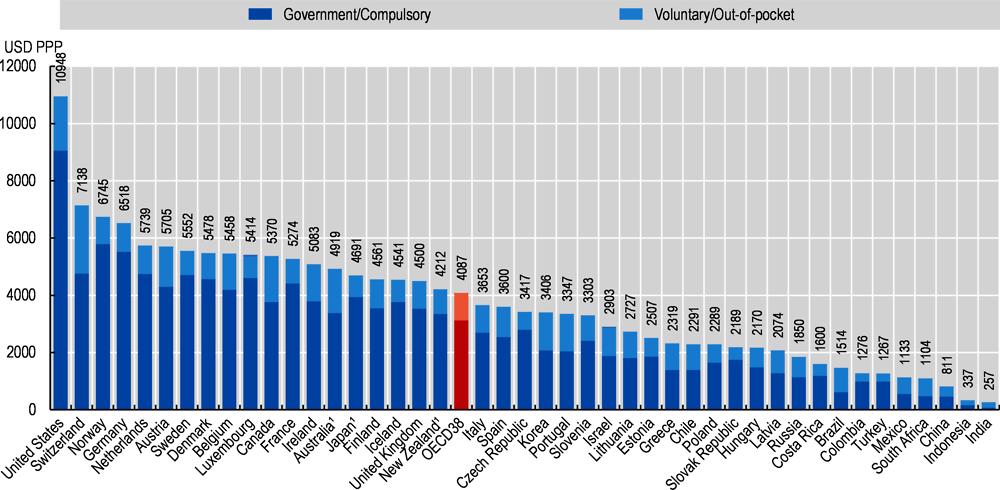
In 2019, average per capita health spending in OECD countries (when adjusted for differences in purchasing power) was estimated to be more than USD 4 000, while in the United States it reached the equivalent of almost USD 11 000 for every US citizen. Switzerland, the next highest spender among OECD countries, had health expenditure of around two-thirds of this level (Figure 7.4). In addition to Switzerland, only a handful of high-income OECD countries, including Germany, Norway and Sweden, spent more than half of the US spending on health, while others, such as Japan and the United Kingdom, were around the OECD average. Lowest per capita spenders on health among OECD member countries were Colombia, Turkey and Mexico, with health expenditure of around a quarter of the OECD average. Latest available estimates show that per capita spending in China was just under 20% of the OECD average, while both India and Indonesia spent between 6% and 8% of this figure.
Figure 7.4 also shows the split of health spending based on the type of health care coverage – organised either through government health schemes or compulsory insurance (public or private), or through a voluntary arrangement such as private voluntary health insurance or direct payments by households (see indicator “Health expenditure by financing schemes”). Across OECD countries, more than 76% of all health spending is financed through government or compulsory insurance schemes. In the United States, since the introduction of the Affordable Care Act in 2014, this share stands at 85%, reflecting the existence of an individual mandate to purchase health insurance. Federal and state programmes such as Medicaid and Medicare continue to play an important role in purchasing health care.
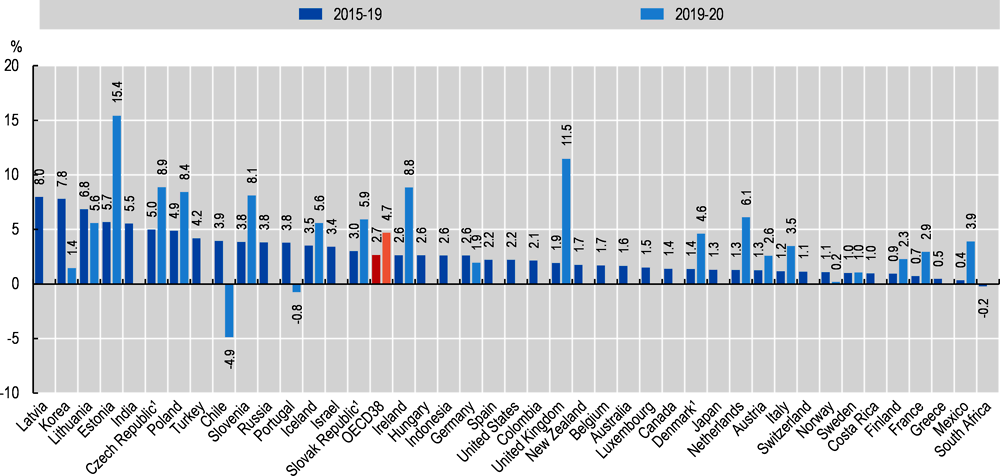
Between 2015 and 2019, average per capita spending on health care grew by an average of 2.7% across OECD countries (Figure 7.5). This compares with the low growth rates experienced in many countries in the years immediately following the global financial and economic crisis. In the 2015-19 period, average annual growth of less than 1% was still seen in France, Greece and Mexico, while the Baltic countries and Korea continued to show strong average growth above 5%. With the onset of the COVID-19 pandemic in 2020, preliminary estimates for a subset of OECD countries point to a sharp increase in overall health spending of around 4.7%, on average. This increase would represent the highest growth in average per capita health spending for around 15 years.
However, there are diverging trends in the pattern of health spending across countries in 2020, varying according to the extent to which a country was affected by the crisis, and reflecting the differing ways that health care is financed in countries. Upward pressure on spending can be observed in a number of countries in line with increased testing and treatment of COVID-19 patients, while widespread containment policies and the reduction in non-COVID-19 care services may have led to lower spending on health, particularly where activity-based financing plays a role. Initial estimates for Estonia, Slovenia and the United Kingdom suggest that per capita health spending grew by more than 10% in 2020. A number of other – mainly European – countries able to provide initial estimates also reported significant increases in health spending compared to the previous period. Norway and Korea, which imposed strict public health measures and saw a relatively low number of COVID-19 cases, both recorded substantially lower health spending growth in 2020 compared to 2019. In Chile and Portugal, preliminary projections point to a real-terms reduction of health spending per capita in 2020.
Expenditure on health gives a measure of the final consumption of health goods and services (i.e. current health expenditure) (OECD/Eurostat/WHO, 2017[1]). This includes spending by all types of financing arrangements (such as government-based programmes, social insurance and out-of-pocket spending) on medical services and goods, population health and prevention programmes, as well as administration of the health system. The split of spending combines government and compulsory financing schemes, the latter including private insurance of a mandatory nature (as, for example, in Switzerland and the Netherlands). Due to data limitations, private voluntary insurance in the United States is included with employer-based private insurance, which is currently mandated under the Affordable Care Act.
To compare spending levels between countries, per capita health expenditures are converted to a common currency (US dollars) and adjusted to take account of the differences in purchasing power of the national currencies. Actual Individual Consumption PPPs are used as the most available and reliable conversion rates. For the calculation of growth rates in real terms, actual individual consumption deflators are used for all countries, where available.
Note that data for 2020 are based on provisional figures submitted by the country or estimated by the OECD Secretariat.
Source: OECD Health Statistics 2021, WHO Global Health Expenditure Database.