
Health expenditure in relation to GDP
The amount spent on health care compared to the size of the overall economy varies over time owing to differences in both the growth of health spending and overall economic growth. During the 1990s and early 2000s, OECD countries generally saw health spending outpace the rest of the economy, leading to an almost continual rise in the ratio of health expenditure to gross domestic product (GDP). After the volatility of the 2008 economic crisis, the share remained relatively stable, as growth in health spending broadly matched overall economic performance across OECD countries. However, with the COVID-19 crisis severely restricting economic activity, and health spending tending to increase, the ratio of health expenditure to GDP is set to experience significant adjustment.
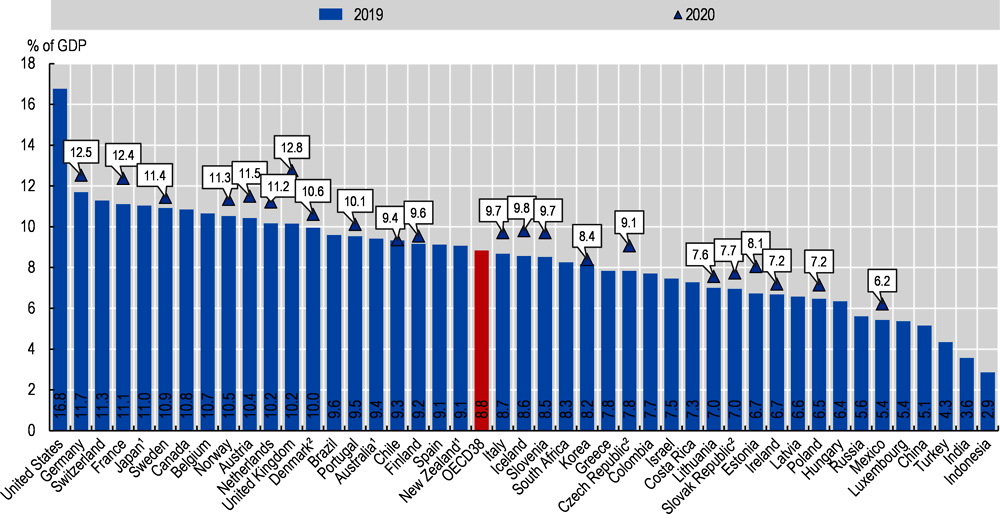
In 2019, prior to the COVID-19 pandemic, OECD countries spent, on average, around 8.8% of their GDP on health care – a figure more or less unchanged since 2013. The United States spent by far the most on health care, equivalent to 16.8% of its GDP – well above Germany, the next highest spending country, at 11.7% (Figure 7.1). After the United States and Germany, a group of ten high-income countries, including France, Canada, Japan and the United Kingdom, all spent more than 10% of their GDP on health care. A further dozen countries spread across OECD countries, but also including Brazil and South Africa, sit within a band of health spending of 8-10% of GDP. The next block of countries spending between 6% and 8% of their GDP on health care includes many of the central and eastern European OECD countries, as well as the newer members from the Latin America region – Colombia and Costa Rica. Finally, Mexico and Turkey spent less than 6% of GDP on health, alongside some of the partner countries, such as the People’s Republic of China (China) and India.
Preliminary estimates for 2020 for a number of OECD countries all point to a significant increase in the ratio of health spending to GDP. This reflects both the extra health spending needed to combat COVID-19 and reductions in GDP caused by restrictions on economic activity. Based on the initial data, the average share of GDP allocated to health is estimated to have jumped from 8.8% in 2019 to 9.7% in 2020. Those countries most severely affected by the pandemic reported unprecedented increases in the share of GDP allocated to health. The United Kingdom estimated an increase from 10.2% in 2019 to 12.8% in 2020, while Slovenia anticipated its share of spending on health rising from 8.5% to more than 10%.
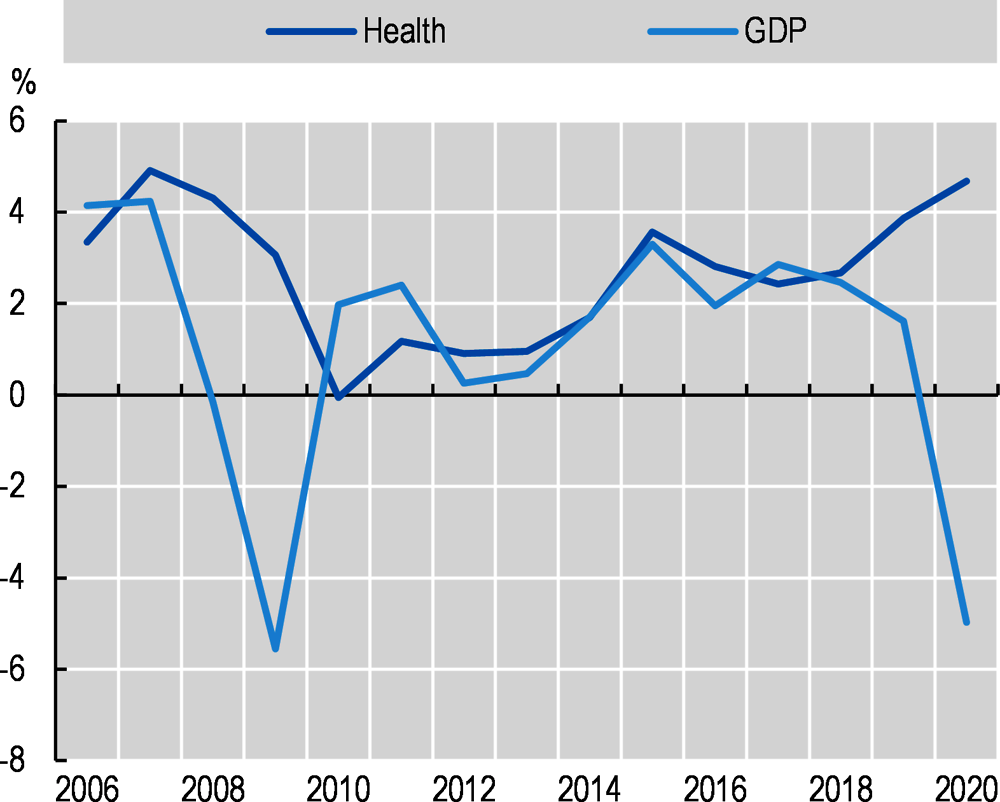
Analysis of the trends in per capita health spending and GDP over the last 15 years clearly show the two shocks: the economic crisis in 2008 and the recent impact of COVID-19 in 2020 (Figure 7.2). While OECD economies contracted sharply in 2008 and 2009, health spending growth was maintained for a while before also declining – growth hovered just above zero between 2010 and 2012 – as a range of policy measures to rein in public spending on health kicked in. For the rest of the 2010s, the average rate of health spending growth in OECD countries tended to track growth in the overall economy closely. The gap widened in 2019, with stronger growth in health spending. With widespread lockdowns and other public health measures severely restricting economic output and consumer spending, many OECD economies went into freefall in 2020. Per capita GDP fell by more than 4.5% on average, with Spain and the United Kingdom recording double-digit contractions in GDP. The need to increase health spending, particularly by governments, in response to the pandemic pushed average per capita growth in spending close to 5%, according to preliminary data for a number of OECD countries. This is likely to be the fastest growth in OECD health spending in the last 15 years.
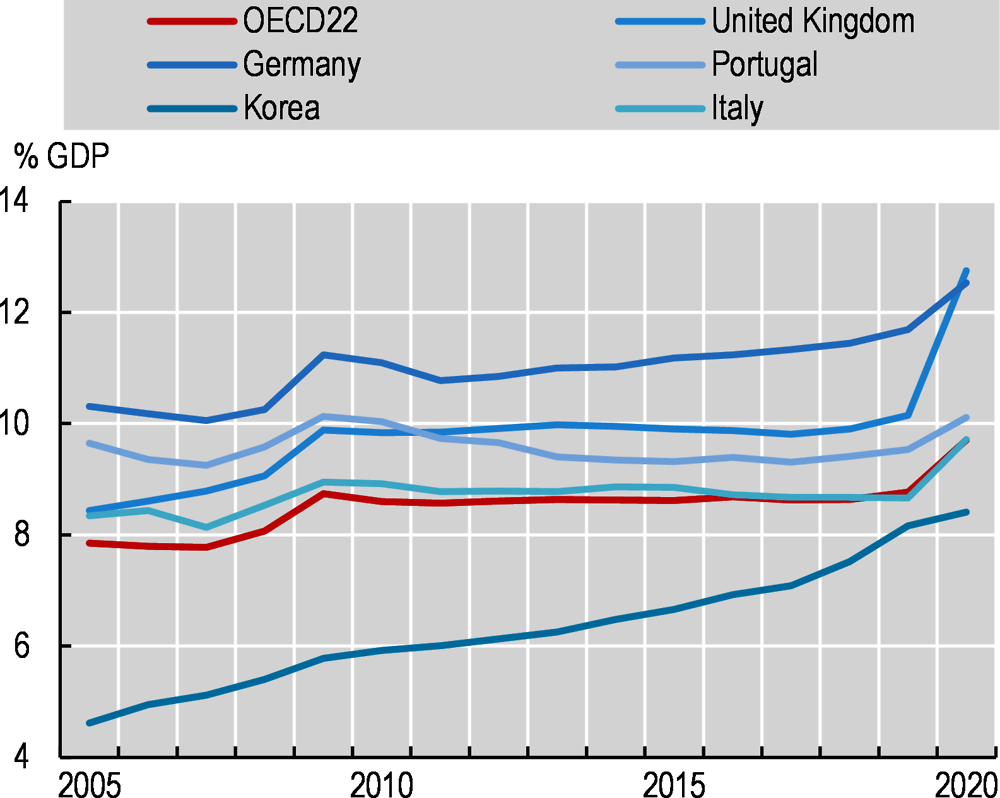
The trends in health spending and GDP over this period have translated into a distinct pattern, with significant jumps in the ratio in 2009 and 2020, and a period of stability in between (Figure 7.3). Focusing on a few countries, Italy and the United Kingdom closely followed this trend, with the latter showing an even more pronounced jump in 2020. Germany and Portugal experienced a smoother transition, with health spending in Portugal estimated to be only 0.4 percentage points higher than in 2005. Despite the shocks, health spending in Korea has shown a steady increase year on year, rising from 4.8% to 8.4% over the 15-year period.
See indicator “Health expenditure per capita” for a definition of current expenditure on health. GDP is the sum of final consumption, gross capital formation (investment) and net exports. Final consumption includes goods and services used by households or the community to satisfy their individual needs. It includes final consumption expenditure of households, general government and non-profit institutions serving households.
In countries such as Ireland and Luxembourg, where a significant proportion of GDP refers to repatriated profits and is thus not available for national consumption, gross national income may be a more meaningful measure than GDP. However, for consistency, GDP is maintained as the denominator for all countries.
Note that data for 2020 are based on provisional figures provided by the country or preliminary estimates made by the OECD Secretariat. As a result of challenges faced in collecting data during COVID-19 pandemic, 2020 estimates may be subject to more uncertainty than usual.
Source: OECD Health Statistics 2021.