
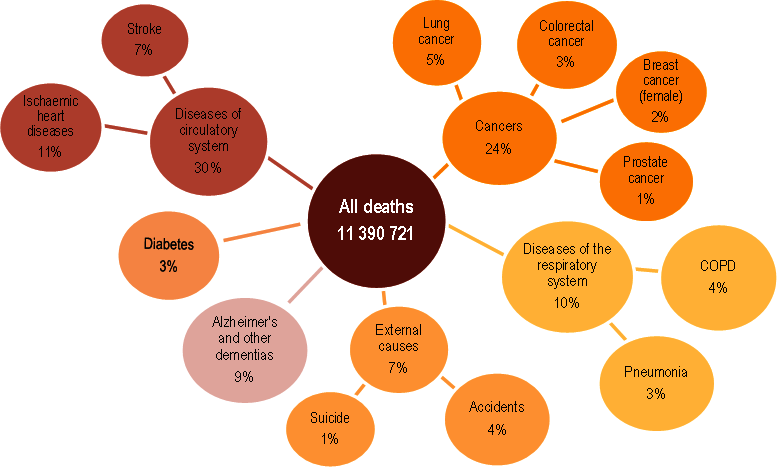
Main causes of mortality
In 2019, over 11 million people died across OECD countries – equivalent to 770 deaths per 100 000 population (Figure 3.7). Diseases of the circulatory system and cancer were the two leading causes of death in most countries. This reflects the epidemiological transition from communicable to non-communicable diseases, which has already taken place in high-income countries and is rapidly occurring in many middle-income countries (Roth et al., 2018[7]). Across OECD countries in 2019, heart attacks, strokes and other circulatory diseases caused about one in three deaths; one in four deaths were related to cancer. Population ageing largely explains the predominance of deaths from circulatory diseases – with deaths rising steadily from age 50.
Respiratory diseases were also a major cause of death, accounting for 10% of deaths across OECD countries. Chronic obstructive pulmonary disease (COPD) alone accounted for 4% of all deaths. Smoking is the main risk factor for COPD, but occupational exposure to dust, fumes and chemicals, and air pollution in general, are also important risk factors.
External causes of death were responsible for 7% of deaths across OECD countries – notably road traffic accidents and suicides. Road traffic accidents are a particularly important cause of death among young adults, whereas suicide rates are generally higher among middle-aged and older people. Further, in some countries, notably the United States and Canada, the opioid crisis has caused more working-age adults to die from drug-related accidental poisoning.
Looking at other specific causes, Alzheimer’s and other dementias accounted for 9% of all deaths; they were a more important cause of death among women than men. Diabetes represented 3% of all deaths across OECD countries. The main causes of death differ between socio-economic groups, with social disparities generally larger for the most avoidable diseases (Mackenbach et al., 2015[8]).
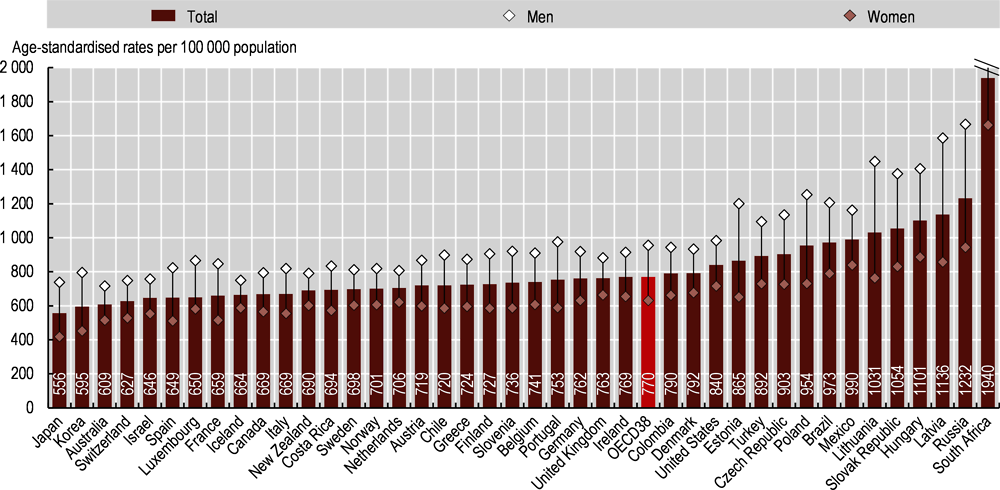
All-cause age-standardised mortality rates in 2019 ranged from under 600 deaths per 100 000 in Japan and Korea to over 1 000 deaths per 100 000 in Latvia, Hungary, the Slovak Republic and Lithuania (Figure 3.8). Among OECD partner countries, mortality rates were highest in South Africa (1 940 per 100 000 deaths) and Russia (1 232 per 100 000).
Age-standardised mortality rates were 50% higher for men than women across OECD countries (956 per 100 000 population for men, compared with 631 for women). In Lithuania, Latvia and Hungary there were over 1 400 deaths per 100 000 men. For women, mortality rates were highest in Hungary, Latvia, Mexico and the Slovak Republic. Among OECD partner countries, male mortality rates were around 2 400 deaths per 100 000 in South Africa and over 1 600 in Russia. These countries also had the highest female mortality rates. Gender gaps are partly due to greater exposure to risk factors – particularly smoking, alcohol consumption and less healthy diets – alongside intrinsic gender differences. Accordingly, men had higher death rates from heart diseases, lung cancer and injuries, among other diseases.
Note that this section analyses the main causes of mortality in 2019, the most recent year for which detailed cause-of-death data are available across OECD countries. In 2020 and beyond, the COVID-19 pandemic will have a large effect on these indicators. For example, COVID-19 was the third leading cause of mortality in the United States in 2020 (Health System Tracker, 2021[9]). Indeed, because of COVID-19, there have been far more deaths overall in 2020 and 2021 than in previous years (see Chapter 2 for an in-depth analysis of the health impact of COVID-19).
Mortality rates are based on the number of deaths registered in a country in a year divided by the population. Rates have been directly age-standardised to the 2010 OECD population (available at http://oe.cd/mortality) to remove variations arising from differences in age structures across countries and over time. Note this results in some age-standardisation differences with other population standards used by, for example, the World Health Organization (WHO) and the European Union (EU). The source for mortality rates is the WHO Mortality Database.
Deaths from all causes are classified as International Classification of Diseases, tenth revision (ICD-10) codes A00-Y89, excluding S00-T98. The classification of causes of death defines groups and subgroups. Groups are umbrella terms covering diseases that are related to each other; subgroups refer to specific diseases. For example, the group “diseases of the respiratory system” comprises four subgroups: influenza, pneumonia, COPD and asthma. Charts are based on this grouping, except for Alzheimer’s and other dementias. These were grouped together (Alzheimer’s is classified in group G and other dementias in group F).
Source: OECD Health Statistics 2021.