Chapter 3. Timing indicators in the Survey of Adult Skills
This chapter provides an overview of the indicators extracted from log files, analysing differences across countries, cognitive domains and the socio-demographic characteristics of respondents. Older respondents and more educated adults tended to spend more time on the assessment, and time spent on the assessment was found to be positively correlated with performance. The data also show a positive relationship between timing indicators and literacy proficiency.
Basic facts on timing indicators
As discussed in Chapter 2, this report focuses on indicators that are available for all or most items and cognitive domains (literacy, numeracy, and Problem Solving in Technology-Rich Environments [PSTRE]) and, more importantly, on indicators for which the meaning and interpretation can be plausibly considered consistent across different domains.1 This chapter closely examines four indicators, three concerning timing information and the fourth concerning missing answers.
The three timing indicators are: 1) overall time spent on an item (time on task); 2) time spent between the appearance of an item on the screen and the first action undertaken by the respondent on that item (time to first interaction); and 3) time spent between the last action undertaken by the respondent and final validation of the answer (time since last action). It should be noted that time since last action is not defined for either PSTRE items or items requiring numeric answers (see Chapter 1).
The fourth indicator analysed is the proportion of missing answers, defined as the share of items to which the respondent did not give an answer. All items skipped by respondents are taken into account, irrespective of the amount of time they took before moving to the next item.
All analysis in this chapter is conducted from an individual perspective. Timing and response information on different items is aggregated or averaged at the level of the individual respondent. In other words, the analysis focuses on the average behaviour of respondents in the assessment. A complementary approach followed in subsequent chapters is to take an item-level perspective, exploring, for example, whether respondents’ behaviour changes according to the characteristics of specific items or over the course of the assessment.
Interpreting timing indicators
Timing indicators have no straightforward or obvious interpretation. The Survey of Adult Skills, a product of the Programme for the International Assessment of Adult Competencies (PIAAC) (hereafter referred to as “PIAAC”) was not conceived as a timed assessment, meaning that respondents were allowed to spend as much time as they wanted trying to solve the items. Spending more time on the assessment could be interpreted as a sign of higher motivation, but it could also be interpreted as a sign of lower ability, to the extent that equally motivated but less able individuals would likely need to spend more time on an item to solve it.
It follows that, although speed was not part of the constructs that PIAAC aimed to assess, timing information should be jointly analysed with information on proficiency. However, two complications arise in this respect. First, performance and timing are measured simultaneously in PIAAC. Second, the adaptive and rotated design of the assessment implies that respondents were not all assigned the same items. Typically, respondents who demonstrated higher proficiency were assigned more difficult items, which could require more time (e.g. because of lengthier stimuli).
Another important thing to consider is possible heterogeneity across domains. PIAAC included three different domains: literacy, numeracy, and PSTRE. However, as illustrated in Figure 2.3, each respondent undertook only two domains. After the computer-based assessment core, respondents were randomly allocated to a first module of literacy, numeracy or problem solving. After this first module, they were again randomly allocated to a second module, with the restriction that respondents could not take two literacy or two numeracy modules (while it was possible to take two modules of problem solving). Each literacy and numeracy module included 20 items, while the PSTRE modules included 7 items each.
Furthermore, it must be kept in mind that the assessment of problem solving was optional. Among the countries for which process data are available, France, Italy and Spain did not administer the problem-solving assessment. As a result, all respondents in these countries took one literacy module and one numeracy module (in random order).
Modules were designed to be approximately the same length. As the PSTRE modules included only seven items, it follows that they took much more time to complete than literacy and numeracy items. Figure 3.1 shows the average time spent on literacy, numeracy and PSTRE items across all countries in which all three domains were administered. Respondents spent on average almost three minutes on each PSTRE item, and only slightly more than one minute on each literacy or numeracy item.
Differences in the time spent on different modules are smaller. In fact, as the literacy and numeracy modules included a larger number of items, respondents spent more time on those modules (about 22 minutes on average) than on PSTRE modules (19 minutes).
PSTRE items also stand out on a different dimension. On average, respondents did not provide an answer to 23% of the PSTRE items assigned to them. This was the case for only 5% of the literacy items and 3% of the numeracy items. This is partly due to the fact that the concept of “missing answer” is not well defined for PSTRE items, given that, in most cases, the aim was not to provide an answer but rather to reach a specific stage within a simulated environment.
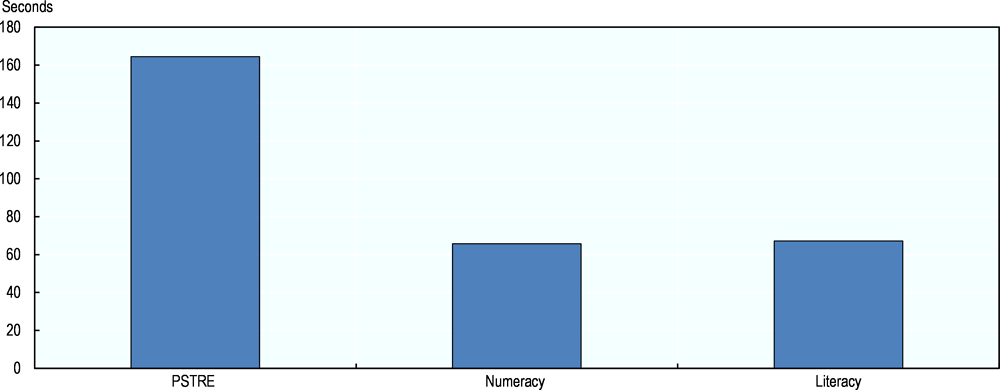
Note: Average time spent on items in different domains, in seconds. The average is taken over all countries that administered all three domains and therefore excludes France, Italy and Spain.
Source: OECD (2017[1]), Programme for the International Assessment of Adult Competencies (PIAAC), Log Files, https://doi.org/10.4232/1.12955.
In light of the particularities of the PSTRE assessment, the rest of the chapter focuses on timing indicators for literacy and numeracy items only. This makes it possible to retain in the sample the three countries that decided not to administer the PSTRE assessment (Italy, France and Spain). In order to make more homogeneous comparisons, the analysis excludes individuals who were assigned either of the two PSTRE modules. This is particularly relevant because the PSTRE modules could affect the overall duration of the assessment, but also because undertaking the PSTRE assessment in the first module could have an effect on behaviour in the second module.
This choice has, of course, a cost in terms of sample size. In the countries that administered PSTRE, about 60% of respondents were directed to at least one PSTRE module. However, the remaining sample size is still reasonably large, averaging 2 300 respondents across the countries that administered PSTRE.
Cross-country differences in timing indicators
There is considerable cross-country variation in the time respondents spent on the literacy and numeracy assessments (Figure 3.2). Respondents in Norway spent almost 12 minutes more than those in Spain, a difference of about 30%.
Differences between domains were much smaller. In Figure 3.2, countries are ranked according to the overall time spent on the literacy and numeracy modules, but the ranking would be practically identical (with only a few minor switches) if it were based on either the literacy or the numeracy module.
In most countries, the literacy module took more time than the numeracy module, but the average difference is only 25 seconds. In England / Northern Ireland (United Kingdom), France, Ireland, Italy, Norway and Poland, respondents spent more time on the numeracy assessment, but the differences were again small, never exceeding 30 seconds.
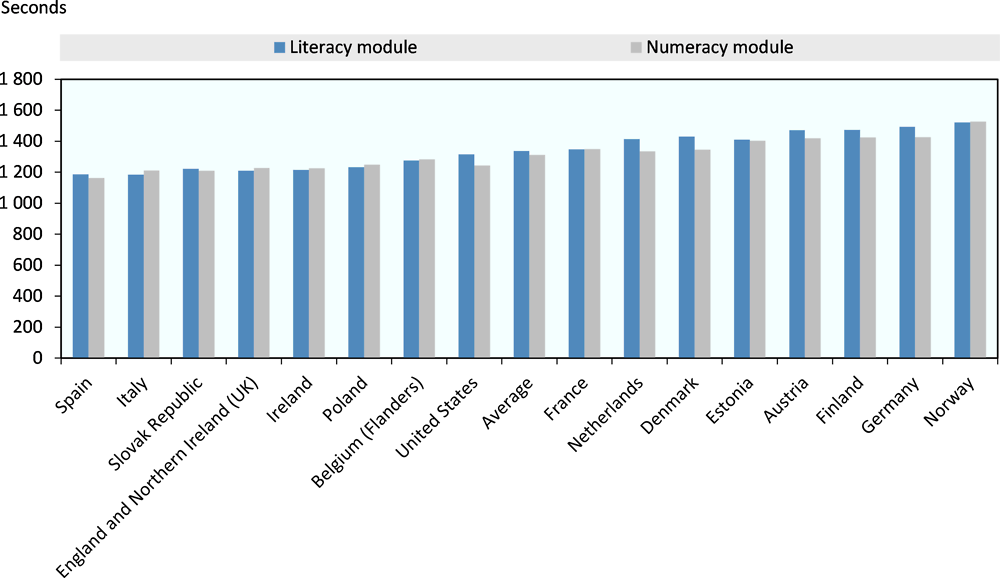
Note: The sample includes only participants to the computer-based assessment who were assigned to the literacy and numeracy modules.
Source: OECD (2017[1]), Programme for the International Assessment of Adult Competencies (PIAAC), Log Files, https://doi.org/10.4232/1.12955.
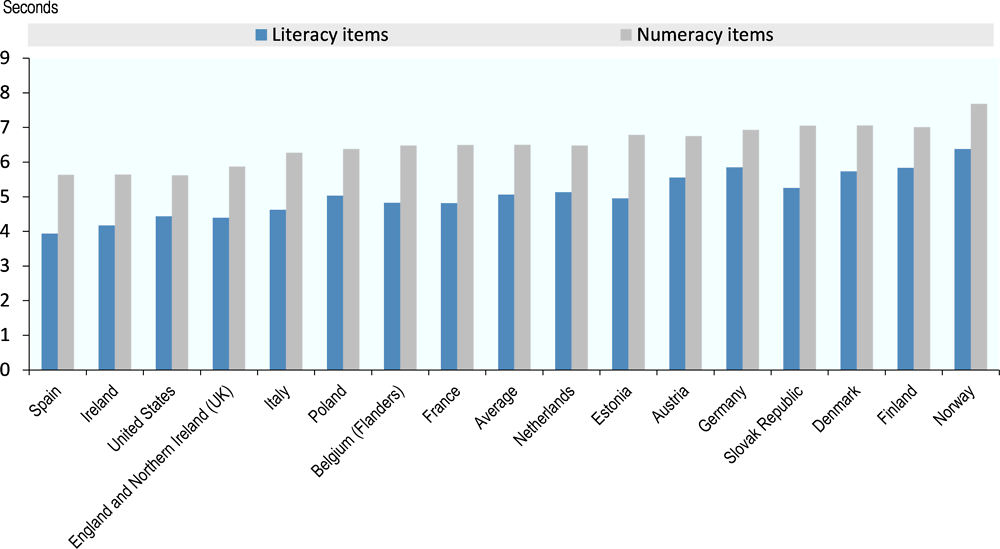
A similar picture emerges when comparing the average time to first interaction (time elapsed between display of the item and respondent’s first interaction with the item) (Figure 3.3).

Note: The sample includes only participants to the computer-based assessment who were assigned to the literacy and numeracy modules.
Source: OECD (2017[1]), Programme for the International Assessment of Adult Competencies (PIAAC), Log Files, https://doi.org/10.4232/1.12955.
In Figure 3.3, countries are ranked according to time to first interaction on numeracy items, but the ranking would change only marginally if they were sorted according to contact time on literacy items. The ranking is consistent with Figure 3.2, with Austria, Finland, Germany and Norway at the top of the distribution and Italy, the Slovak Republic and Spain at the bottom.
The major difference between time to first interaction and overall time on task is that the time to first interaction is typically greater for numeracy items than for literacy items. In other words, respondents tend to spend more time on literacy items overall, but the time before their first observed interaction with items is greater in numeracy than in literacy. This is likely to be related to the different format of items in the two domains. Literacy items often require the respondent to move to a different page to examine the content of the item and give an answer, meaning that the first interaction (i.e. going to another page) is triggered very quickly. In most numeracy items, the respondent has immediate access to all the information needed to answer the question. The time of first contact may, therefore, often coincide with the time at which the respondent inputs an answer.
This is also true for time since last action, defined as time elapsed between the last interaction the respondent had with an item and the moment in which he/she decided to move to the following item (Figure 3.4). Before finally validating their answer, respondents appear to spend more time reflecting on their answers for numeracy items than for literacy items.
Note: The sample includes only participants to the computer-based assessment who were assigned to the literacy and numeracy modules.
Source: OECD (2017[1]), Programme for the International Assessment of Adult Competencies (PIAAC), Log Files, https://doi.org/10.4232/1.12955.
Ranking countries on the basis of time since last action delivers a slightly different picture than rankings based on the other indicators. Ireland and the United States are now at the bottom of the ranking, along with Spain, while Denmark and Finland are now at the top, together with Norway.
However, comparing countries on the basis of timing indicators based on absolute measures of elapsed time (in this case, seconds) is not necessarily appropriate. The adaptive nature of the assessment means that different respondents were assigned different items. In particular, respondents with higher estimated proficiency (based on their responses to items in the background questionnaire and their performance in the first stage of the assessment) were assigned more difficult items that could require more time to complete.
To make comparisons that control for differences in the items assigned to different individuals, it is possible to compute, for each individual and for each item to which he/she was assigned, a position (expressed in percentile) in the overall distribution of the timing indicator, and then to average these percentiles across items. For example, a respondent in a given country could be at the 40th percentile of the overall time on task distribution on one item and at the 60th percentile on the overall time on task distribution for a different item. In that case, the average position across the two items would be the 50th percentile (Figure 3.5).

Note: Average percentile rank on the three timing indicators, across literacy and numeracy items. The sample includes only participants to the computer-based assessment who were assigned to the literacy and numeracy modules.
Source: OECD (2017[1]), Programme for the International Assessment of Adult Competencies (PIAAC), Log Files, https://doi.org/10.4232/1.12955.
In Figure 3.5, countries are ranked according to the average value of the three indicators. Overall, there is a close correlation between the values of different indicators within countries. Time since last action is the indicator that tends to deviate most from the general pattern observed, especially in countries such as Germany, the Slovak Republic and Spain.
When it comes to ranking countries, there is little difference between using percentile-based indicators and indicators expressed in elapsed time in seconds. The partial exception is time since last action, where country rankings based on seconds vary more markedly from rankings based on percentiles. As shown in Chapter 4, time since last action is less related to item characteristics. Even in the case of time since last action, however, the correlation between the percentile-based indicator and the indicator expressed in elapsed time in seconds is very high, 0.78 for literacy items and 0.73 for numeracy items.
Timing indicators, missing answers and performance
A logical question following the analysis conducted so far is the relationship between the time spent on the assessment and the performance of respondents in literacy and numeracy. In performing such an analysis, however, a crucial element to take into account is the incidence of missing answers.
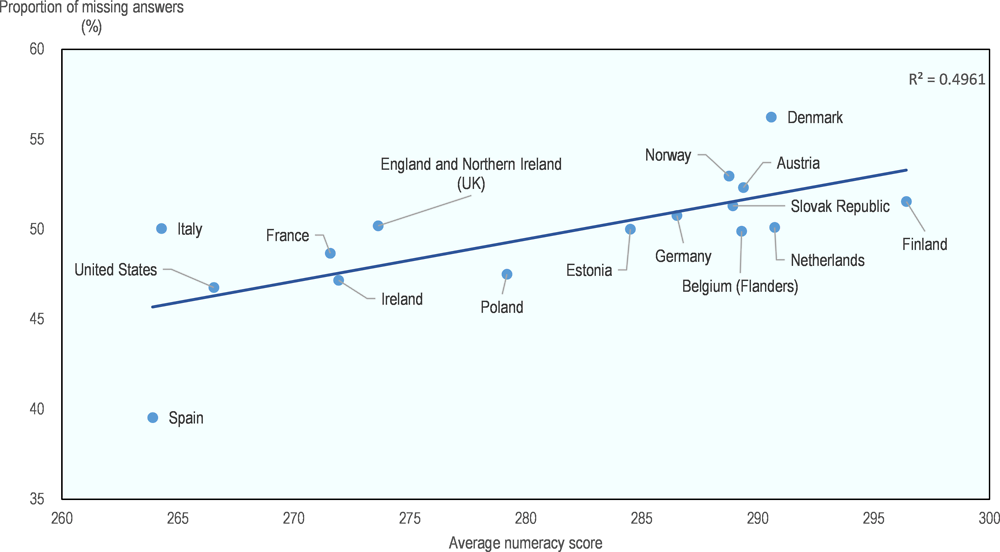
As explained above, no attempt is made in this chapter to identify the various reasons that lie behind a missing answer. In other words, no effort is made to distinguish between cases in which the respondent made the effort to solve an item (by spending time on it) and cases in which the respondent skipped the item without spending much time on it (due to lack of motivation or lack of confidence or because the test-taker felt that the item was out of reach and not worth spending time on). The fairly strong negative correlation between time spent on items and the proportion of items with missing answers suggests that the latter form of behaviour (i.e. skipping an item without spending too much time on it) is more prevalent (Figure 3.6).

Note: The sample includes only participants to the computer-based assessment who were assigned to the literacy and numeracy modules.
Source: OECD (2017[1]), Programme for the International Assessment of Adult Competencies (PIAAC), Log Files, https://doi.org/10.4232/1.12955.
Countries in which respondents skipped a higher proportion of items are typically those in which respondents spent less overall time on the assessment. This result holds irrespective of the timing indicator used and irrespective of whether percentile-based measures are used, as opposed to raw time-based indicators.
Given the negative relationship between the incidence of missing answers and time spent on the assessment, it comes as no surprise that there is a positive relationship between overall performance and the various timing indicators. In other words, countries with higher literacy and numeracy scores are typically countries in which respondents spent more time on the assessment.
However, the relationship is not particularly strong, especially in the case of literacy. Among the various timing indicators, time since last action displays the strongest association with performance, in both assessment domains. For all indicators, the association is stronger for numeracy than for literacy.
To the extent that timing indicators capture some aspects of respondents’ engagement and motivation, these results raise the question of how much impact the differences in motivation across countries have on performance on the assessment. These issues are explored more in depth in chapters 4 and 5.
Note: The sample includes only participants to the computer-based assessment who were assigned to the literacy and numeracy modules.
Source: OECD (2017[1]), Programme for the International Assessment of Adult Competencies (PIAAC), Log Files, https://doi.org/10.4232/1.12955.
Socio-demographic distribution of timing indicators and missing answers
This section analyses differences according to the socio-demographic characteristics of respondents. It focuses on the subsample of individuals who only took the literacy and numeracy assessment, excluding respondents who took the PSTRE assessment for the reasons discussed above. In order to take into account country-specific factors associated with response time and patterns of missing answers, all statistics are computed at the country level and then averaged across countries.
The analysis groups respondents on the basis of standard socio-demographic characteristics, such as gender, age and education. Other distinctions are made according to three further criteria: 1) literacy and numeracy proficiency demonstrated during the assessment; 2) index of use of information and communications technology (ICT) in everyday life, to account for familiarity with the digital device on which the assessment was undertaken; and 3) time spent on the background questionnaire, to assess whether a consistent pattern emerges in terms of spending more or less time in both the direct assessment and in answering the background questionnaire.
The various subsections present raw differences, followed by adjusted differences estimated by means of regression analysis. This type of analysis, while still insufficient to provide evidence of a causal link between the characteristic under investigation and the behavioural outcome of interest, makes it possible to take into account a number of observable factors that are associated with the characteristic under investigation.
Gender differences
Gender differences in timing indicators are generally small, especially when compared to cross-country differences or to differences across groups defined by other socio-demographic characteristics. On average, women spent 41 seconds less than men on the literacy and numeracy assessment and were about 1 percentage point more likely to skip answering an item.
These results are robust to controlling for additional characteristics, such as age, education, employment status and familiarity with ICT. Estimated adjusted differences in time spent on the assessment increase to 53 seconds, while differences in the probability of skipping an answer remain at 1 percentage point.
Time to first interaction is virtually identical for women and men. Women spend slightly less time than men between the last interaction with the item and the final confirmation of their answer.
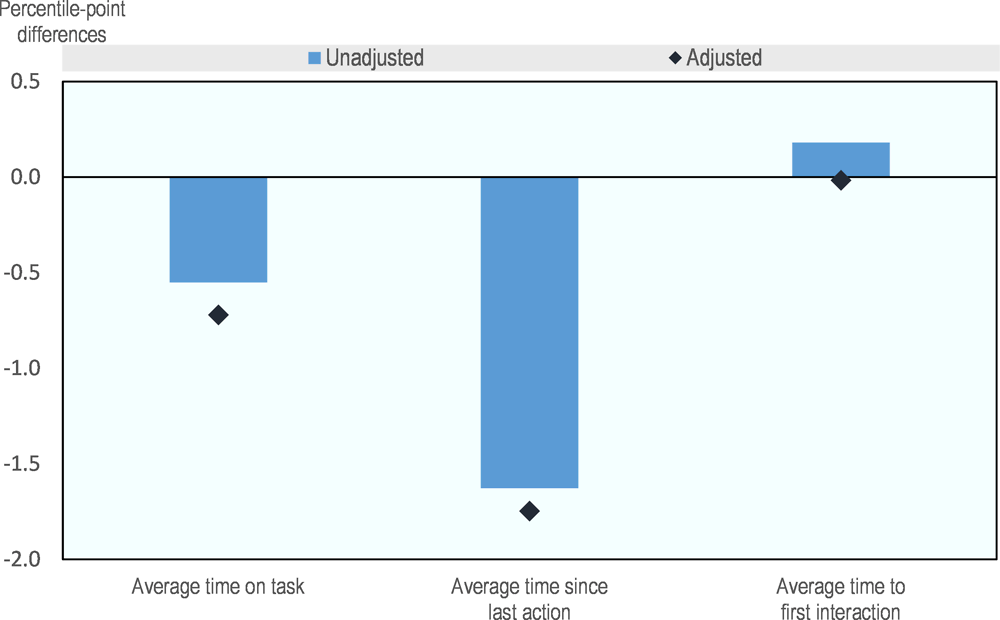
Note: The figure shows differences in timing indicators between men and women (men being the reference category). Adjusted differences account for age, education, employment status, familiarity with ICT, time spent on the background questionnaire, presence of another person and readiness to learn. The sample includes only participants to the computer-based assessment who were assigned to the literacy and numeracy modules.
Source: OECD (2017[1]), Programme for the International Assessment of Adult Competencies (PIAAC), Log Files, https://doi.org/10.4232/1.12955.
Age differences
Age differences in timing indicators are more pronounced than gender differences. All the timing indicators increase in a linear fashion with age. For instance, the overall time on task in the entire assessment is, on average, 39 minutes for respondents aged 16 to 25, increasing to almost 50 minutes for respondents aged 55 to 65.
A similar pattern is observed when looking at the proportion of items with missing answers, which is as low as 5% for the youngest respondents in the sample and as high as 10% for the oldest respondents (Figure 3.9). Importantly, these differences are not removed by controlling for other factors, such as education or familiarity with ICT.
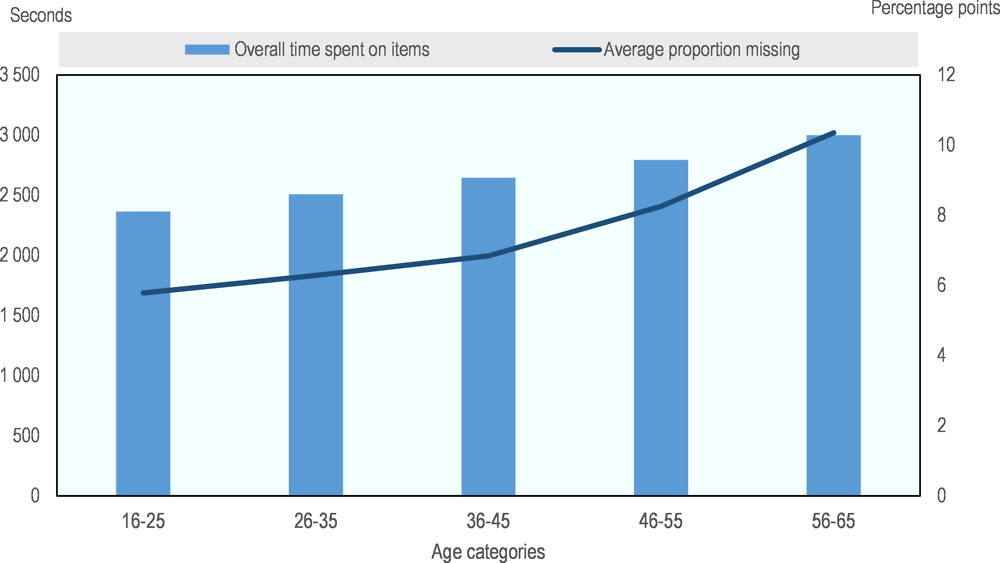
Note: The sample includes only participants to the computer-based assessment who were assigned to the literacy and numeracy modules.
Source: OECD (2017[1]), Programme for the International Assessment of Adult Competencies (PIAAC), Log Files, https://doi.org/10.4232/1.12955.
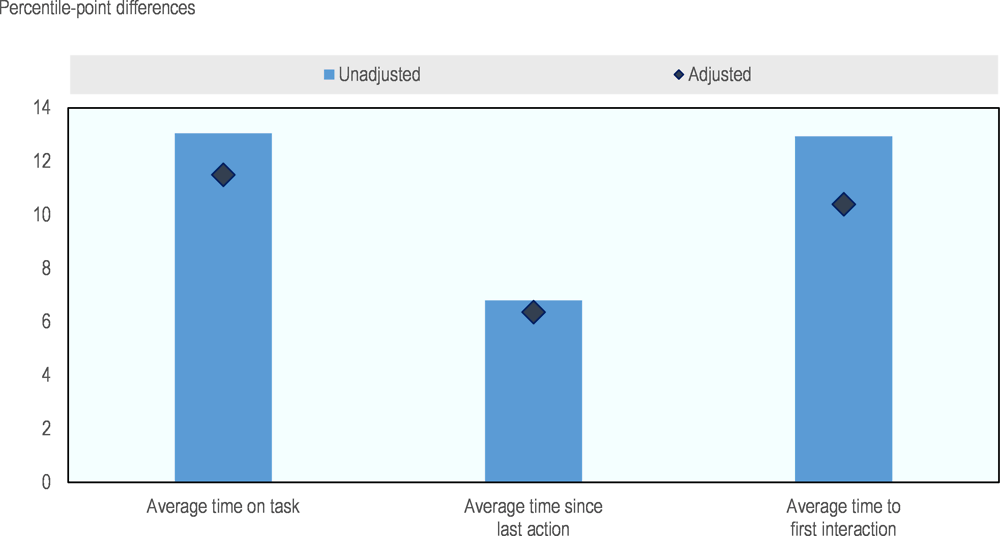
A similar pattern emerges when analysing the other timing indicators, such as time to first interaction and time since last action. A summary measure of age effects (i.e. the difference between respondents aged 55-65 and respondents aged 25-34) is presented in Figure 3.10.

Note: Difference between respondents aged 55-65 and 25-34 (age 25-34 being the reference category). Adjusted differences account for education, employment status, familiarity with ICT, gender, time spent on the background questionnaire, presence of another person and readiness to learn. The sample includes only participants to the computer-based assessment who were assigned to the literacy and numeracy modules.
Source: OECD (2017[1]), Programme for the International Assessment of Adult Competencies (PIAAC), Log Files, https://doi.org/10.4232/1.12955.
Education differences
In terms of overall time on task in the literacy and numeracy assessment, differences by highest level of education are also relatively large. Respondents whose highest attainment is an upper secondary degree took about 2.6 minutes more than respondents whose highest level of attainment is primary education or below, and respondents with a tertiary degree spent 1.7 minutes more than respondents with an upper secondary degree. The magnitude of these differences is only marginally reduced after taking account of the usual set of observable characteristics.
When looking at the share of missing answers, however, the pattern is reversed (contrary to what happens in the case of age-related differences). The share of items which were not answered was as high as 9% for respondents with primary education, 7% for respondents with upper secondary education and as low as 4% for respondents with tertiary education.
Figure 3.11 shows that tertiary-educated respondents tend to take slightly more time on the timing indicators analysed and primary-educated respondents a bit less time than the reference group of respondents with upper secondary education. Time to first interaction is a partial exception, as tertiary-educated adults do not differ from those with upper secondary education. But the differences are small in magnitude and, for the most part, they become even smaller after controlling for observable characteristics.
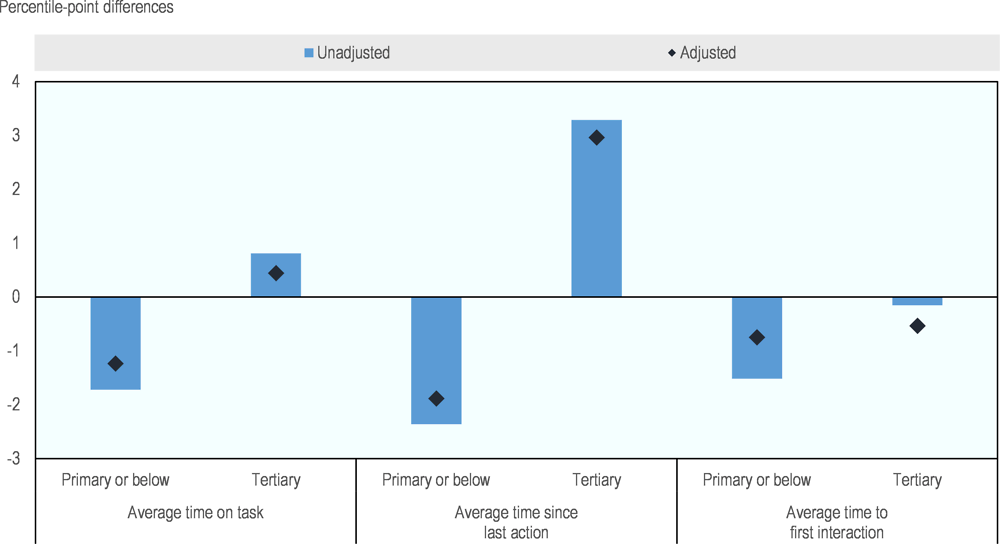
Note: The reference category is respondents who attained upper secondary education. Adjusted differences account for age, employment status, familiarity with ICT, gender, time spent on the background questionnaire, presence of another person and readiness to learn. The sample includes only participants to the computer-based assessment who were assigned to the literacy and numeracy modules.
Source: OECD (2017[1]), Programme for the International Assessment of Adult Competencies (PIAAC), Log Files, https://doi.org/10.4232/1.12955.
Differences related to familiarity with ICT
A certain degree of familiarity with ICT devices and applications was a requirement for participation in the computer-based version of the PIAAC assessment. Adults who proved not to possess a minimum level of ICT proficiency were directed to the paper-based version of the assessment.
Familiarity with ICT was not part of the skills PIAAC intended to test as part of the literacy and numeracy assessment. In other words, a respondent’s ICT skills are not supposed to exert a direct effect on his/her performance in the literacy and numeracy assessment. On the other hand, familiarity with ICT could well affect the speed at which respondents manage to solve the items (which is, by the way, an argument in favour of not incorporating timing information in the scoring of PIAAC).
The PIAAC background questionnaire contained a number of questions on the frequency at which respondents undertake various activities with ICT. From such questions, it is possible to construct a scale of ICT use.
Figure 3.12 shows the gap in the various timing indicators according to the index of ICT use, comparing respondents who scored in the top quartile of the scale with respondents who scored in the bottom quartile.
On average, respondents who are more familiar with ICT spend less time on items, although the difference shrinks to zero once account is taken of differences in other observable characteristics. Similarly, familiarity with ICT is associated with less time to first interaction, although the gap is halved after controlling for observable characteristics. However, respondents who are more familiar with ICT appear to take more time before confirming their final answer (time since last action), with an adjusted gap of about 1 percentile point.

Note: Differences between respondents who are in the top and bottom quartile of the distribution of the index of familiarity with ICT. Respondents in the bottom quartile are the reference category. Adjusted differences account for age, employment status, gender, time spent on the background questionnaire, presence of another person and readiness to learn. The sample includes only participants to the computer-based assessment who were assigned to the literacy and numeracy modules.
Source: OECD (2017[1]), Programme for the International Assessment of Adult Competencies (PIAAC), Log Files, https://doi.org/10.4232/1.12955.
As timing indicators are also available for the background questionnaire, it is interesting to see to what extent there is a relationship between the time spent on these two components of the assessment.
An important difference between the background questionnaire and the assessment should be kept in mind. The background questionnaire was administered as a computer-assisted-personal-interview (CAPI). This means that an interviewer went through the various questions with the respondent and entered the answers on the computer, while the respondent was in control of the computer during the direct assessment. As a result, the timing indicators for the background questionnaire capture not only the speed at which the respondent gave his/her answers, but also the speed at which the interviewer asked the questions and filled in the answers.
Note: Differences between respondents in the top and bottom quartile of the distribution of time spent in Section I of the background questionnaire. Respondents in the bottom quartile are the reference category. Adjusted differences account for age, employment status, familiarity with ICT, gender, presence of another person and readiness to learn. The sample includes only participants to the computer-based assessment who were assigned to the literacy and numeracy modules.
Source: OECD (2017[1]), Programme for the International Assessment of Adult Competencies (PIAAC), Log Files, https://doi.org/10.4232/1.12955.
Figure 3.13 compares respondents in the top and bottom quartile of the distribution of time spent on Section I of the background questionnaire (the only section that was administered in its entirety to all respondents). The different indicators are related. Respondents who spent more time on Section I in the background questionnaire also tended to spend more time on the assessment. Adjusting for individual observable characteristics changes the size of the gap only marginally. It should be noted, however, that the relationship between time spent on the assessment and time spent on the background questionnaire is rather weak. Respondents separated by 50 percentile points in the distribution of time spent on Section I are separated on average by between 7 and 13 percentile points (depending on which indicator is analysed) in the distribution of time spent during the assessment.
Differences related to proficiency
The relationship between timing indicators and performance on the assessment (captured by the final proficiency scores) is difficult to interpret, because the two are intimately related. More skilled individuals are likely to need less time to solve assessment items, but the adaptive nature of the test implies that more skilled respondents are assigned more difficult (and probably longer) items. Moreover, causality could run in both directions, as spending more time on an item is likely to increase the chance of giving a correct answer.
While these issues are discussed and analysed more formally and in greater depth in Chapter 4, Figure 3.14 summarises the descriptive evidence on the relationship between timing indicators and literacy proficiency.
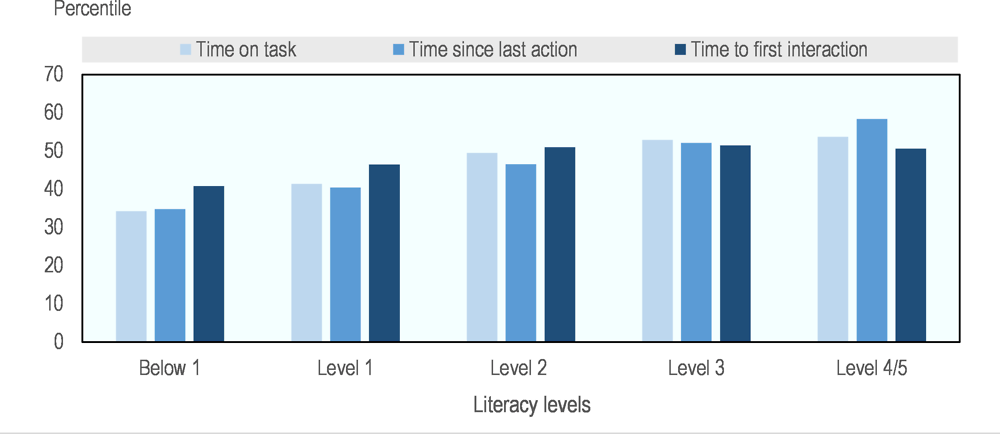
Note: The sample includes only participants to the computer-based assessment who were assigned to the literacy and numeracy modules.
Source: OECD (2017[1]), Programme for the International Assessment of Adult Competencies (PIAAC), Log Files, https://doi.org/10.4232/1.12955.
Consistent with the country-level analysis presented in Figure 3.7, performance in literacy is positively related to time spent on the assessment, irrespective of which indicator is analysed. Respondents scoring at Level 4 or Level 5 position themselves about 10 percentile points higher in the distribution of time to first interaction, and about 20 percentile points higher in the distribution of time on task and time since last action, than respondents scoring below Level 1.
Conclusions
This chapter has analysed three timing indicators (time on task, time since last action, and time to first interaction), as well as the share of missing answers, at both country and individual levels.
At the country level, the three indicators (with the partial exception of time since last action) deliver a rather consistent picture across assessment domains. In particular, respondents in countries like England/Northern Ireland (United Kingdom), Italy and Spain consistently spent much less time than respondents in Austria, Denmark, Finland, or Norway.
Not surprisingly, time spent on the assessment was found to be negatively correlated with the proportion of missing answers and positively correlated with performance on the assessment.
At the individual level, it was found that older respondents tended to spend more time on the assessment, even though they displayed a higher propensity to skip items without giving a response.
More educated adults typically spent more time on the assessment than those with less education and also displayed a higher propensity to provide answers to the items. However, the differences are rather small in magnitude, as are differences related to respondents’ gender.
Respondents who have greater familiarity with ICT tended to take more time before confirming their final answer. On overall time on task, they tended to be faster, although the gap disappears after controlling for observable characteristics. Familiarity with ICT is also associated with faster time to first interaction.
Finally, the data show a positive relationship between the timing indicators and literacy proficiency, although it is particularly hard in this case to assess the direction of causality.
References
[3] He, Q., F. Borgonovi and M. Paccagnella (forthcoming), “Using process data to understand adults’ problem-solving behaviours in PIAAC: Identifying generalised patterns across multiple tasks with sequence mining”, OECD Education Working Papers, OECD Publishing, Paris.
[2] He, Q. and M. Von Davier (2015), “Identifying feature sequences from process data in problem-solving items with n-grams”, in van der Ark, L. et al. (eds.), Quantitative Psychology Research The 79th Annual Meeting of the Psychometric Society, Springer, New York, NY, https://doi.org/10.1007/978-3-319-19977-1_13.
[4] He, Q. and M. von Davier (2016), “Analyzing process data from problem-solving items with n-grams: Insights from a computer-based large-scale assessment”, in Y. Rosen, S. Ferrara and M. Mosharraf (eds.), Handbook of Research on Technology Tools for Real-World Skill Development, Hershey, PA: IGI Global, https://doi.org/10.4018/978-1-4666-9441-5.ch029.
[1] OECD (2017), Programme for the International Assessment of Adult Competencies (PIAAC), Log Files, GESIS Data Archive, Cologne, https://doi.org/10.4232/1.12955.
Note
← 1. For different approaches that exploit the richness of interactions contained in PSTRE items using techniques borrowed from text-mining analysis, see He and von Davier (2015[2]), He and von Davier (2016[4]) and He, Borgonovi and Paccagnella (forthcoming[3]).