
copy the linklink copied!1. Skills of the Canadian workforce
This chapter provides an overview of the labour market context in Canada, and discusses challenges related to changing demand for skills as a result of globalisation, technological change and population ageing. It provides an overview of Canada’s system of adult learning.
copy the linklink copied!Introduction
Canada’s economy has seen robust employment growth in recent years. Linked to this growth, the job vacancy rate has hit record highs and the unemployment rate has hit record lows. Furthermore, the demand for skills is changing as a result of technological progress and globalisation. Population ageing is also putting significant pressure on the labour supply and several groups are under-represented in the labour market.
While Canada’s adult population is highly educated, skills requirements are changing as the nature of work evolves. Adult learning can help adults to adapt to the changing demand for skills so that they continue to remain employable over their working lives. Investing in employees’ skills is smart business for firms, as it helps to address growing skills shortages and reduce employee turnover.
This chapter describes the labour market context in Canada and the key challenges the country faces in responding to changing demand for skills. It provides an overview of the current skills of the adult population in Canada, and how the adult learning system performs in comparison to other OECD countries.
copy the linklink copied!Labour market context
Tight labour market conditions in Canada
Canada’s economic growth has supported strong employment growth in recent years, with the employment rate well above the OECD average and just below the level in the United States (Figure 1.1, Panel A). Fuelled by growth, the unemployment rate reached a near-record low of 5.7% in 2019 (Figure 1.1, Panel B).
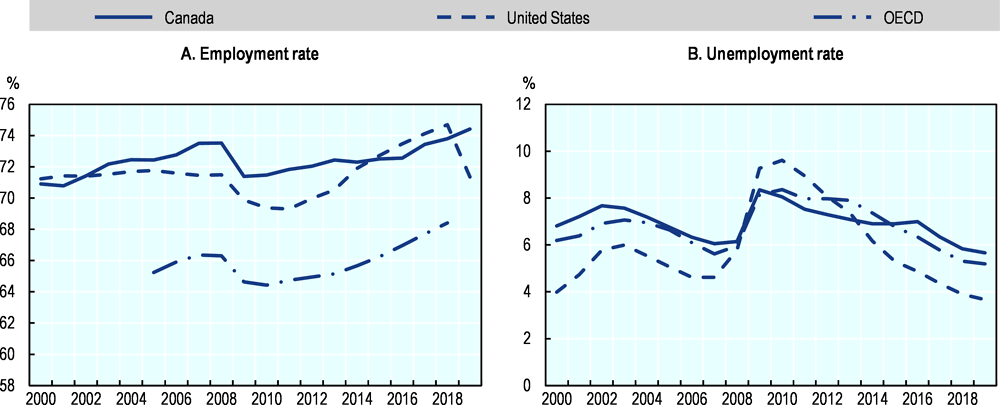
Note: Employment rate as percentage of population aged 15-64, seasonally adjusted; harmonised unemployment rate.
Source: OECD labour force statistics, https://stats-1.oecd.org/index.aspx?DatasetCode=STLABOUR.
Several additional indicators suggest tightening labour market conditions in Canada in recent years. There were 3.6 unemployed persons per vacant position (the unemployment-to-vacancy ratio) in 2016, while that ratio was down to 2.2 in 2018. Strong demand for workers is also evident from the share of firms who report labour shortages that restrict their ability to meet demand. At 31%, this share is above the historical average (Figure 1.2). The Manpower Talent Shortage Survey also tracks a rise in the share of Canadian employers reporting hiring difficulties, from 31% of employers to 41% between 2008 and 2018 (Manpower, 2018[1]), though this remains below the global average (45%). Employers in the Manpower Talent Survey cited three top reasons for their hiring difficulties: not enough applicants (26%), applicants lack experience (19%), and applicants lack required hard skills (17%). In a more general survey conducted by the Labour Market Information Council asking employers about their top HR challenges, the most common response was difficulty retaining employees (39% of employers reported this challenge). Finding qualified or skilled workers came in second (35%), followed by offering competitive wages (32%).
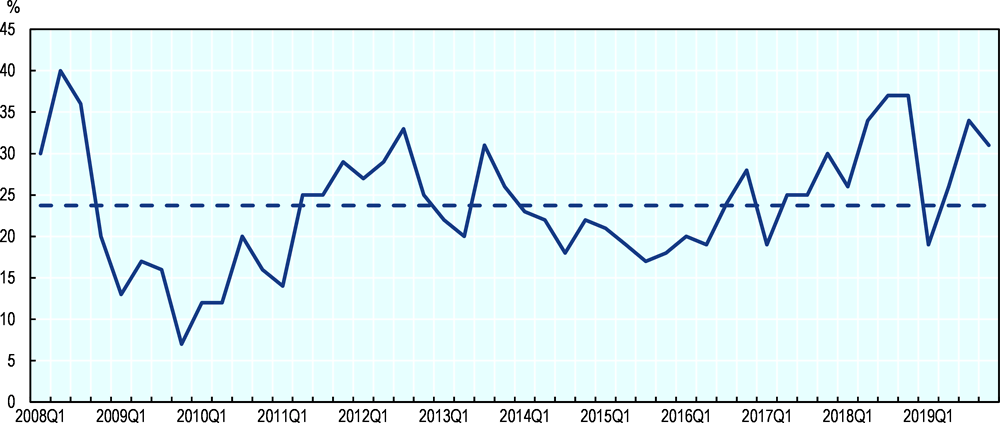
Note: The dotted line represents the historical average since 2008Q1.
Source: Bank of Canada (2020[2]), Business Outlook Survey Winter 2019-20, https://www.bankofcanada.ca/2020/01/business-outlook-survey-winter-2019-20/.
Some segments of the labour force are under-represented in the labour market, particularly those with a low level of education (high school or less) and persons with disabilities (Figure 1.3). Immigrants and Indigenous persons also have below-average participation rates and high unemployment rates. Removing barriers to labour force participation for under-represented groups is not only important from a well-being perspective, but also to ensure that employers have a sufficient pool of candidates to hire from in the current context of tight labour market conditions.
There is also significant variation in unemployment rates across regional labour markets (Figure 1.4): Newfoundland and Labrador (11.9%), Prince Edward Island (8.8%), and New Brunswick (8.0%) had the highest unemployment rates in 2019, while British Columbia (4.7%), Quebec (5.1%) and Manitoba (5.3%) had the lowest. In Canada’s energy-intensive provinces (Alberta, Saskatchewan) unemployment rates have not yet recovered fully from the fall in oil prices in 2014.
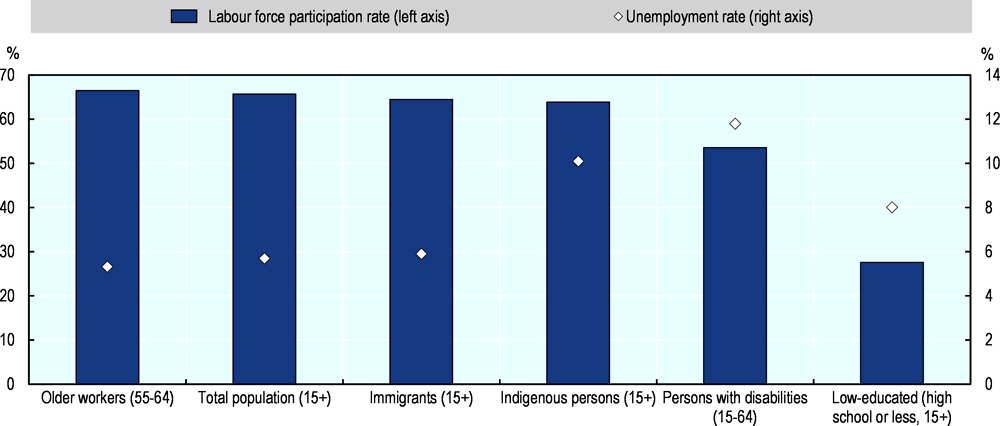
Note: * Data on persons with disabilities is from 2012. Labour force participation rate of older workers is from 2018.
Source: Statistics Canada (https://wwwstatcan.gc.ca): Table 14-10-0359-01 (Indigenous persons), Table 13-10-0348-01 (Persons with disabilities), Table 14-10-0020-01 (total population and by education level), Table 14-10-0089-01 (immigrants). OECD (https://doi.org/10.1787/8a801325-en) for labour force participation rate of older workers.
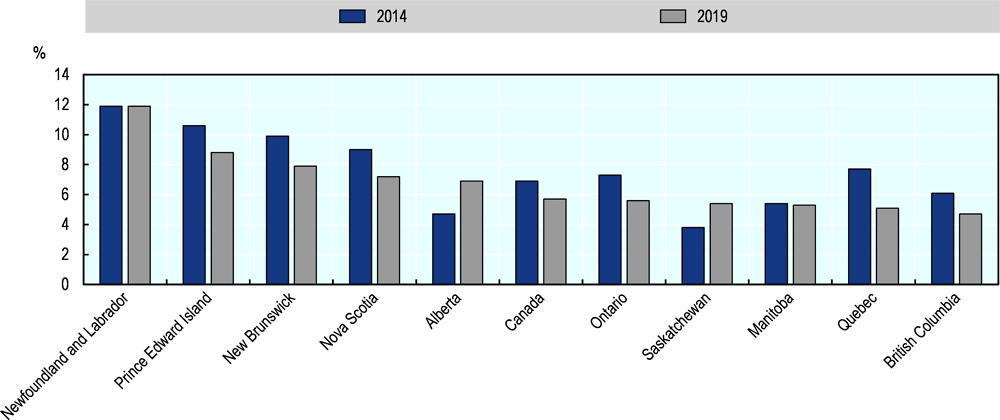
Note: Population aged 15+. Data does not include the territories.
Source: Statistics Canada. Table 14-10-0020-01, https://www150.statcan.gc.ca/t1/tbl1/en/tv.action?pid=1410002001.
Skills needs are changing
On top of tight labour market conditions due to economic growth, global trends such as globalisation, technological progress and population ageing are changing the types of skills that are in demand. These trends may lead to changes in the task content or even the destruction of some jobs, but also to the creation of new jobs that require different skills. Recent OECD research suggests that 29% of jobs in Canada are likely to see significant change in task content if current cutting-edge technology becomes widespread, and an additional 14% could be completely automated in the next 15-20 years (OECD, 2019[3]). Many Canadians could see their employability threatened unless they acquire new skills.
In terms of skill level, the new jobs are very different from those that are disappearing. Over the last two decades, OECD countries on average have seen a decline in the share of employment in middle-skilled jobs, while the share of employment in low-skilled and high-skilled jobs has risen (Figure 1.5)1. The phenomenon of polarisation is often explained by skill-biased technological change and a rise in demand for services. Looking at the period 1995-2015, Canada experienced a similar degree of polarisation as the United States. However, the decline in oil prices in 2014 resulted in lower demand for low-skilled workers related to the resource sector. Over 1998-2018, Canada actually saw a slight decline in the share of employment in low-skilled jobs (Figure 1.5). The decline in the share of employment in middle-skilled jobs over this period (4.1%) was entirely offset by a rise in the share of employment in high-skilled jobs (4.4%).
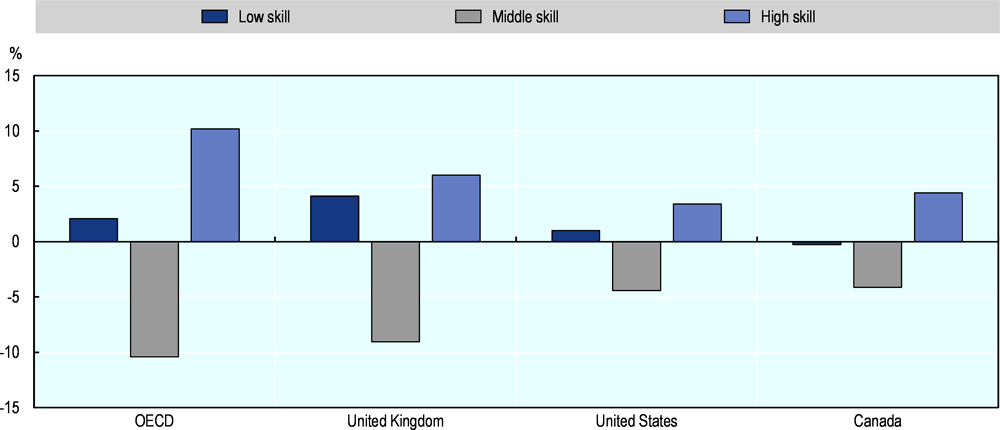
Note: High-skill occupations include jobs classified under the ISCO-88 major groups 1, 2, and 3. That is, legislators, senior officials, and managers (group 1), professionals (group 2), and technicians and associate professionals (group 3). Middle-skill occupations include jobs classified under the ISCO-88 major groups 4, 7, and 8. That is, clerks (group 4), craft and related trades workers (group 7), and plant and machine operators and assemblers (group 8). Low-skill occupations include jobs classified under major groups 5 and 9. That is, service workers and shop and market sales workers (group 5), and elementary occupations (group 9). Skilled agricultural and fisheries workers were excluded from this analysis.
Source: Updated from OECD (2017[4]), OECD Employment Outlook 2017, https://dx.doi.org/10.1787/empl_outlook-2017-en.
Population ageing is having an impact on both the supply of and demand for labour in Canada. Statistics Canada projects that the ratio of working-age Canadians (aged 15 to 64) to every senior (aged 65 and over) will fall from 3.9 in 2018 to 2.4 by 2055 (Department of Finance, 2018[5]). While this ratio is currently on par with the OECD average, the projected decrease over the next 20 years is one of the largest among OECD countries. An ageing population is expected to lead to a reduction in the overall labour force participation rate. This is due both to a decline in the number of working-age Canadians, and to lower labour market participation rates among older workers relative to younger workers. On the demand side, population ageing is likely to reallocate labour and other resources across sectors and occupations as demand shifts away from durable goods and towards services (such as health care).
These trends have contributed to demand for high educational qualifications. Eight of the top ten occupations in shortage in 2018, according to the OECD Skills for Jobs database, either require a post-secondary education or are management occupations (Table 1.1)2. According to projections carried out by Employment and Social Development Canada (ESDC) for the 2019-2028 period (Canadian Occupational Projection System), 36 out of 293 occupations analysed are expected to face labour shortage conditions and nearly all of them required a post-secondary education, apprenticeship training or were management occupations. Some 36% of occupations projected to be in shortage required a college education, compared to 53% a university degree. Only 8 of 293 occupations showed signs of surplus. Most occupations in surplus, according to both ESDC’s projections and the OECD Skills for Jobs, had low qualification requirements (i.e. required no more than a secondary education or on-the-job training).
Global trends also have an impact on the types of skills in demand. The OECD Skills for Jobs database provides an international comparison of skills shortages and surpluses (Figure 1.6). In Canada, shortages are currently observed in cognitive skills including verbal, quantitative and reasoning abilities, but also in certain manual skills, such as fine manipulative abilities, endurance, and physical strength. By contrast, manual skills like these are in surplus across most OECD countries. Shortages for these manual skills in Canada are linked to relatively high shortage pressure in health care and certain technical occupations in natural resources, agriculture and related production which use these skills intensively. Canada’s natural resource sector continues to be large despite the fall in oil prices, and represented 11.3% of total GDP in the first quarter of 2019.
To integrate with global markets and to thrive in the digital workplace, workers need not only strong digital and cognitive skills, but also social and emotional skills, such as management, communication, and self-organisation skills (OECD, 2017[6]; OECD, 2019[7]). Social skills – including coordination, instructing, negotiating, persuasion, service orientation and social perceptiveness – are found to be in shortage in Canada according to the Skills for Jobs database. This is consistent with a domestic analysis of online job postings. It found that employers looking for digital skills are generally also looking for a candidate with strong “soft” skills, including communications and organisational skills, interpersonal skills, and writing skills (Vu, Lamb and Willoughby, 2019[8]). Similarly, the top three skill groups employers were looking for in a separate study of online job vacancies were business management, leadership and oral communication – all social and emotional skills (LMIC, 2019[9]).
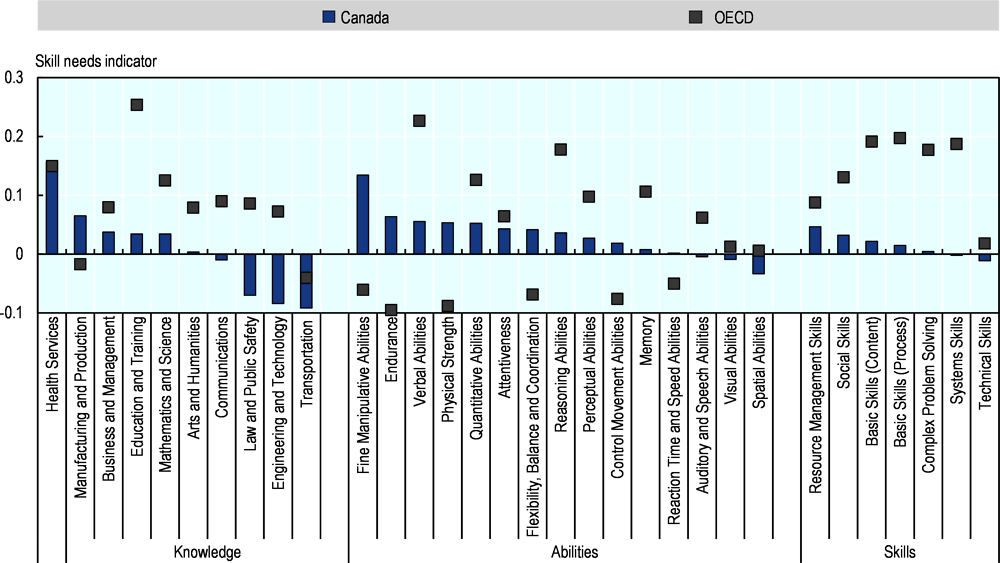
Note: Positive values indicate shortages while negative values indicate surpluses. The indicator is rescaled to have a maximum value of one across skill types and OECD countries. The indicator is a composite of five sub-indices: wage growth, employment growth, growth in hours worked, unemployment rate and growth in under-qualification. Data on unemployment by previous occupation are not available for Canada, and hence the indicator is based on only four sub-indices. The OECD average refers to the latest available year.
Source: OECD Skills for Jobs database, www.oecdskillsforjobsdatabase.org.
copy the linklink copied!Skills of the adult population
Most adults have a tertiary education, but many have low literacy or numeracy skills
Canada has the highest share of tertiary-educated workers across the OECD: 58% of Canadian adults aged 25-64 had a tertiary education in 2018, compared with the United States at 47%, and the OECD average at 37%. These figures result from the large number of students graduating from college programmes in Canada (26% of adults in 2018, compared with 11% in the United States and 7% across the OECD)3. Canada performs closer to the OECD average in university-level educational attainment (a bachelor’s degree or higher) (Figure 1.7).
Note: Data for Chile is for 2017.
Source: OECD (2019[10]), Education at a Glance 2019: OECD Indicators, https://dx.doi.org/10.1787/f8d7880d-en.
Canada is above average, but below top performers, in the skills assessed by the OECD Survey of Adult Skills: literacy, numeracy and problem solving in technology-rich environments. A sizeable share of Canada’s adults – 27% – have low performance in either literacy or numeracy, scoring at Level 0 or 1 (Figure 1.8). Canada’s large foreign-born population (22% of the population were not born in Canada) may help to explain why this share is so high. While foreign-born adults in Canada are highly educated, quite often their first language is neither English nor French. They tend to have lower proficiency in the language of survey assessment (English or French) relative to Canadian-born adults. Indeed, 39% of foreign-born Canadians score at Level 0 or 1 in literacy or numeracy compared to only 21% for the native-born population. This disadvantage also makes it harder for foreign-born adults to integrate into the Canadian labour market.
Source: OECD Survey of Adult Skills (PIAAC, 2012, 2015). Twenty-four countries, including Canada, participated in the first round of the Survey of Adult Skills in 2012. Nine countries took part in the second round in 2015.
Mismatch by qualifications, field of study, and skills
While most university graduates work in jobs that require a university education, a portion do not. One measure of over-qualification is the share of graduates who are not working in occupations usually requiring their highest level of educational attainment. In Canada, 16% of individuals (15-64) were over-qualified for their job in 2016, on par with the OECD average (OECD Skills for Jobs database). A similar share of adult workers (18%) self-reported being over-qualified in the 2016 General Social Survey. Immigration plays a role in explaining over-qualification in Canada. University-educated immigrants – especially those who did not graduate in Canada or the United States – are significantly more likely than Canadian-born graduates to report being over-qualified (Uppal and Larochelle-Côté, 2014[11]). Lower English and French language skills, difficulties assessing foreign credentials and lack of Canadian work experience are part of the explanation, but discrimination may also be a factor. A Statistics Canada study (Larochelle-Côté and Hango, 2016[12]) shows that over-qualified university graduates tend to employ their literacy, numeracy and digital problem-solving skills less in the workplace than their well-matched counterparts.
Field of study mismatch occurs when workers who were educated in a particular field work in a different one. According to the 2016 General Social Survey, about 36% percent of Canadian adults are working in a field different from the one in which they studied (very close to the 37% reported by adults in the 2012 Survey of Adult Skills). Field of study mismatch is the result of both labour supply and demand factors. These include the degree of saturation of a particular field in the labour market and the level of transferable skills offered by a particular field of study. While field of study mismatch is lower in Canada relative to the average (39%) (Montt, 2015[13]), it may be costlier: 42% of adults who are mismatched by field of study are also overqualified for their jobs (above the average of 33%) (Montt, 2015[13]). Field of study mismatch generally only leads to costs for economies when combined with over qualification.
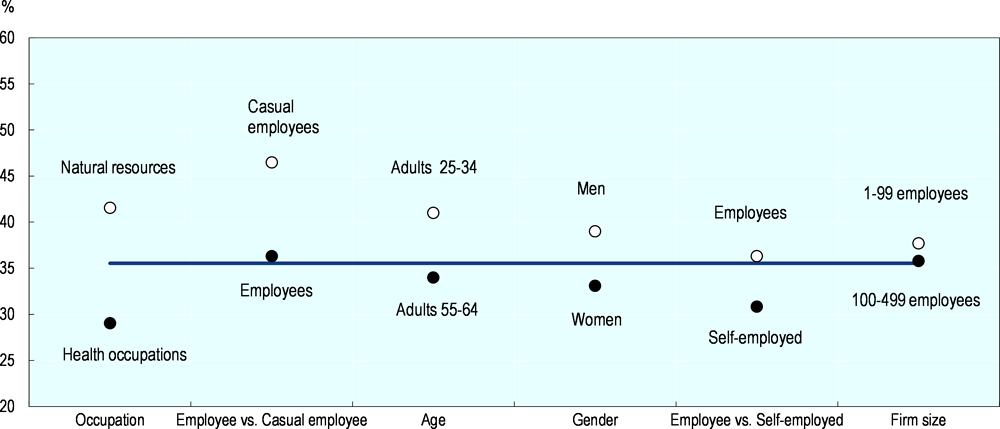
Note: Population of employed adults aged 25-64. This chart shows the groups with the highest and lowest rates of over-skilling by category. The rates of over-skilling by education, immigration status and union status are not shown. There was very little variation between these groups. Casual employees also includes on-call employees.
Source: 2016 General Social Survey. Author’s calculations using the public-use micro-data file.
Some 43% of Canadian adults report a poor match between their job and skills. A large share (35.5%) of Canadian adults report that they have the skills to cope with more demanding duties in their job, i.e. they are over-skilled (Figure 1.9). Only 7.5% report that they are under-skilled and require training to cope with their current duties. The incidence of over-skilling is higher among certain groups: men, younger adults aged 25-34, and casual or on-call employees. As adults age and become better matched to their roles, the rate of over-skilling declines. Being self-employed is also associated with lower rates of over-skilling. The rate of over-skilling does not vary significantly by education, union status or immigration status. The highest rates of over-skilling are in natural resources, agriculture and other production occupations, as well as sales and service occupations. Individuals working in health occupations display the lowest rate of over-skilling.
copy the linklink copied!Adult learning policy context and performance
How well individuals, firms and economies adapt to the changing world of work described above critically depends on the readiness of a country’s adult learning system to help people develop and maintain relevant skills over their working careers. This section provides an overview of Canada’s adult learning system.
This report focuses on the population of potential adult learners aged 25-64. Adults in this age group have generally completed initial education and have begun their working lives. Adult learning can be classified as formal education, non-formal education or informal learning.
Formal education: institutionalised learning activities (e.g. seminars, courses, on-the-job training, open and distance education) which are a minimum of one semester and which are recognised as programmes by the relevant education or equivalent authorities.
Non-formal education: institutionalised learning activities which are either of short duration (less than one semester of full-time equivalent) or are not recognised by the relevant education or equivalent authorities.
Informal learning: non-institutionalised learning activities that are unstructured (e.g. no student/teacher interaction) and can take place anywhere, e.g. learning while doing.
Source: Eurostat (2016[14]), Classification of Learning Activities Manual, https://dx.doi.org/10.2785/874604.
Overview of Canada’s adult learning system
Education in Canada is primarily a provincial and territorial responsibility, and there is no single pan-Canadian approach to adult learning. Provincial and territorial ministries responsible for education plan and implement policies for adult learning and skills development with financial support from the federal government, and often in consultation with other government sectors, non-governmental organisations, or the private sector. The federal government also plays a strong role in skills development to support Canada’s labour market competitiveness
While provision of adult learning varies by jurisdiction, Table 1.2 provides an overview of the general types of programmes available in Canada and the institutions that offer them. Programmes include literacy and essential skills programmes for adults, English or French as a second or additional language, vocational education and training, apprenticeships, higher education, adult liberal education (i.e. hobby courses) and workplace training. Programmes are delivered by a wide range of agencies, organisations and institutions including school boards, colleges, cégeps4, vocational centres, universities, adult learning centres, Indigenous owned-and-operated post-secondary institutions, community groups, non-profit and volunteer groups, employers, unions, associations, private companies, and special groups serving specific types of learners (e.g. Indigenous learners, immigrants, women, prisoners, low-income and unemployed individuals).
Many universities and colleges have special admission processes for mature students (adults who have been out of school for at least one year). Universities and colleges often make allowances for mature students to carry out part or all of their degree or diploma requirements on a part-time or evening basis, by distance or online. In 2017/18, there were 691 000 adults (age 25+) enrolled in post-secondary programmes. The most common post-secondary programmes that adults enrolled in were degrees (45% of adult post-secondary learners), followed by diplomas (17%), followed by certificates (13%)5.
Unemployed individuals access employment and training services by registering with the provincial public employment service. One of the programmes available to registered jobseekers is skill development. The objective of the skill development programme is to assist active and former Employment Insurance claimants in obtaining the skills they need for employment (ESDC, 2017[16]). Funded programmes include essential skills training, adult basic education, English or French as a second language, and occupational skills training. New federal legislation enables unemployed adults to continue receiving employment insurance benefits while pursuing full-time training.
There are no pan-Canadian budget indicators of overall spending on adult learning. But the federal government invests close to CAD 7.5 billion annually in skills development for Canadians, and CAD 3 billion of this is delivered in partnership with the provinces and territories (Department of Finance, 2019[17]). These transfers fall under two major bilateral agreements: the Workforce Development Agreements6 (WDA) and the Labour Market Development Agreements (LMDA). WDAs support skills upgrading, work experience programmes, and assistance setting up a new business. LMDAs support programmes to help unemployed people find work and to ensure a skilled labour force that meets the needs of employers. The design and delivery of the programmes and services funded under these agreements are the responsibility of provinces and territories. They do not need to be approved by the federal government.
The federal government also invests in skills development for adults outside of its partnerships with the provinces and territories. This includes direct support to learners through targeted training programmes for Indigenous persons, persons with disabilities, and recent immigrants. It also includes student financial assistance. In the 2018/19 fiscal year, the federal government invested over CAD 3.5 billion in loans and CAD 1.6 billion in non-repayable grants. Student financial assistance is available to all students, regardless of age.
The 2019 budget report announced a new financial incentive to promote adult learning participation. The Canada Training Benefit fills a gap identified by the 2018 Horizontal Skills Review which found that unemployed Canadians receive a broad range of supports to acquire or develop new skills but that working adults in mid-career could benefit from more support (Department of Finance, 2019[17]). The Canada Training Benefit includes a refundable tax credit up to CAD 5 000 to offset tuition costs and related fees, as well as an Employment Insurance Training Support Benefit to compensate income lost while training. It also includes leave provisions for federally regulated workers to take time away from work for training while maintaining their job security.
Canada’s performance on adult learning
The OECD Priorities for Adult Learning (PAL) dashboard facilitates cross-country comparisons on the future-readiness of adult learning systems (Figure 1.10).
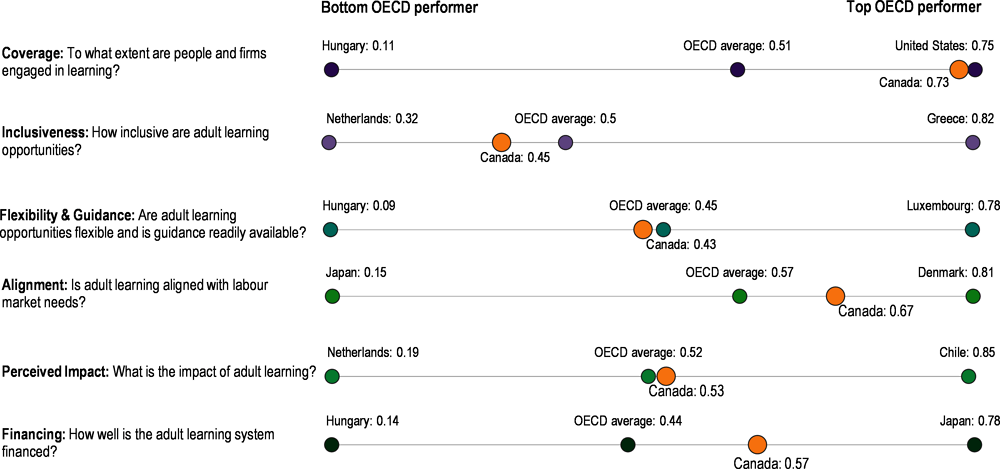
Source: Priorities for Adult Learning dashboard, http://www.oecd.org/employment/skills-and-work/adult-learning/dashboard.htm.
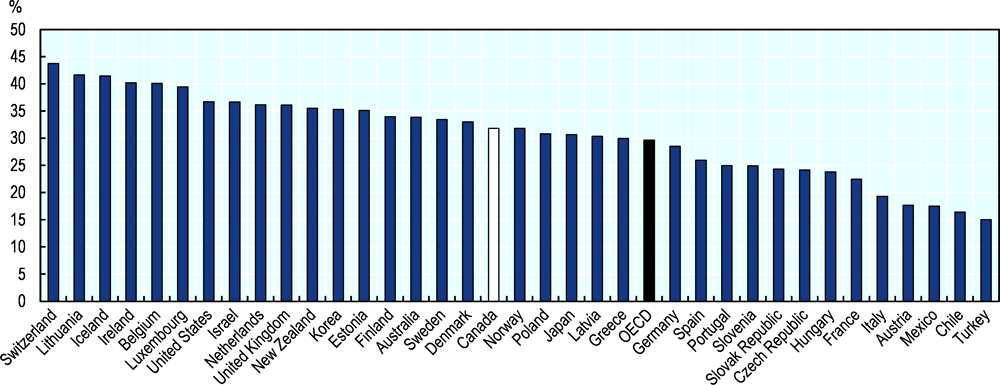
Canada performs above the OECD average in two areas: alignment of training with labour market needs and coverage. Aligning training with labour market needs depends on high quality labour market information. Canada invests in an array of initiatives to generate information about labour and skills needs. The Labour Market Information Council was established in 2017 to improve the timeliness, reliability and accessibility of labour market information. Canada also performs well on coverage, i.e. the share of Canadian adults and employers who participate in job-related training. Just over half (52%) of the working-age population participated in at least one job-related training activity within the previous 12 months, according to the 2012 OECD Survey of Adult Skills (Figure 1.11). This compares with an OECD average of only 41% of adults. According to the 2016 General Social Survey, two-thirds (66%) of adult Canadians received some type of training (not limited to job-related training) in 2016.
Despite having high coverage in adult learning compared to other countries, Canada performs relatively poorly in inclusiveness. In particular, participation rates are low among low-skilled workers, low-waged workers, older workers, the unemployed, those working in small and medium-sized enterprises (SMEs) and those in temporary work7.
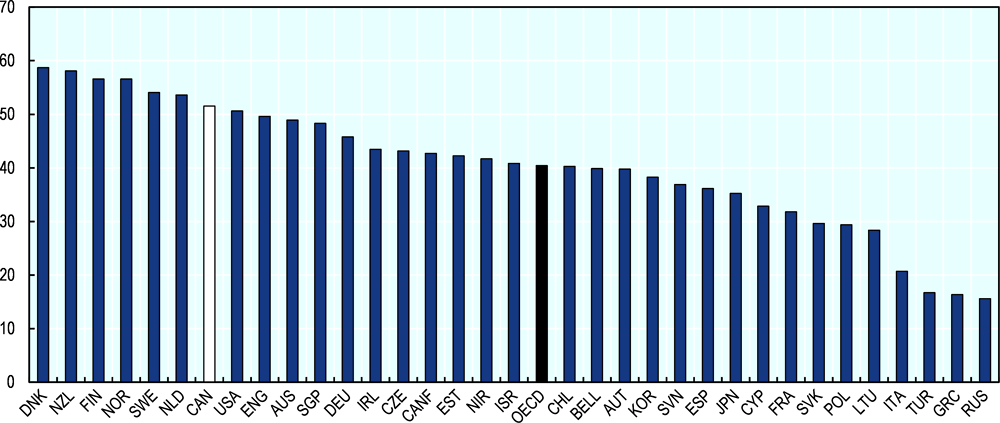
Note: Job-related training includes all forms of skill development that participants identify as being motivated by reasons related to current or future employment. Job-related learning can occur either in the classroom or in the workplace, and it can be sponsored by an employer, government or by the individual learner.
Source: OECD Survey of Adult Skills (PIAAC, 2012, 2015).
Notably, Canada displays one of the largest gaps in participation rates between high/medium-skilled workers and low-skilled workers (Figure 1.12). Across OECD countries, low-skilled workers participate much less than higher-skilled workers in training, but this gap is particularly large in Canada (28 percentage points relative to 23 percentage points). While changes in skills requirements due to technological change affect all workers, the growing demand for high-level cognitive skills and complex social interaction skills suggest that low-skilled workers in jobs that are intensive in repetitive or manual tasks are likely to bear the brunt of these changes (OECD, 2019[3]). Despite having a greater need for upskilling, low-skilled workers receive less training than high-skilled workers.
The participation gap between the prime-age population (25-54) and older adults (55+) is also larger in Canada relative to the average (23 percentage points vs. 21 percentage points). Unless older workers upgrade the skills they acquired in initial education, many are likely to experience skills obsolescence due to technological change. Given the shorter period of time that older workers have to recoup the investment in training before retirement, they tend to receive less training than younger workers. Workforce innovation programmes are testing ways to bridge these gaps and will be discussed in Chapter 2.
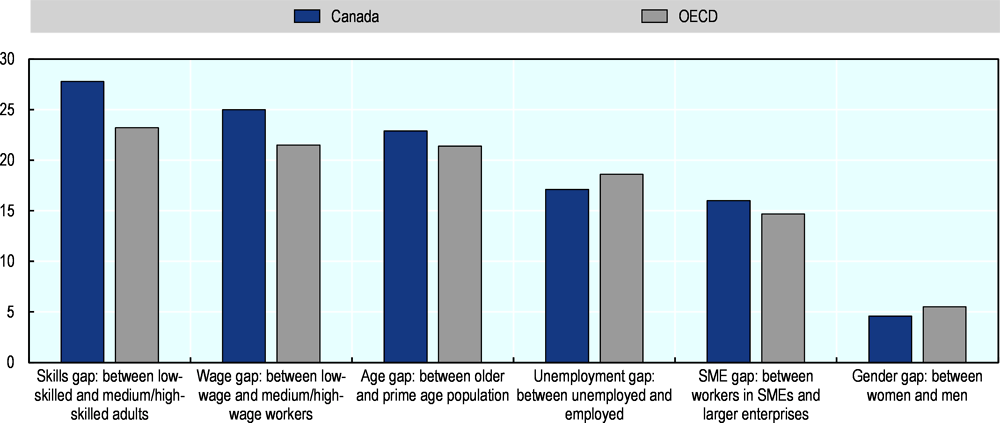
Note: Participation in formal and non-formal job-related education and training.
Source: OECD Survey of Adult Skills (PIAAC, 2012, 2015)
On other dimensions, including flexibility and guidance, Canada performs in the middle of the pack. Do adults have access to guidance about learning opportunities? Are learning opportunities available in flexible formats, including online, distance, modular, part-time or evenings? Flexible modes of training delivery can make training more accessible for adults who struggle to find time to train. Being too busy at work was the main barrier cited by Canadian adults who wanted to train more (30%) (Figure 1.13). Another 17% reported that they did not have time due to childcare and family responsibilities. Some 12% said the course was not offered at a convenient time or place. There are signs that Canadians are making use of flexible modes of training delivery. Some 10% of the population aged 16-65 participated in open or distance education in 2012, on par with the OECD average. The Conference Board of Canada also tracked a shift away from formal classroom training towards informal learning, as an increasing number of employees initiate their own self-paced e-learning (The Conference Board of Canada, 2018[18]).
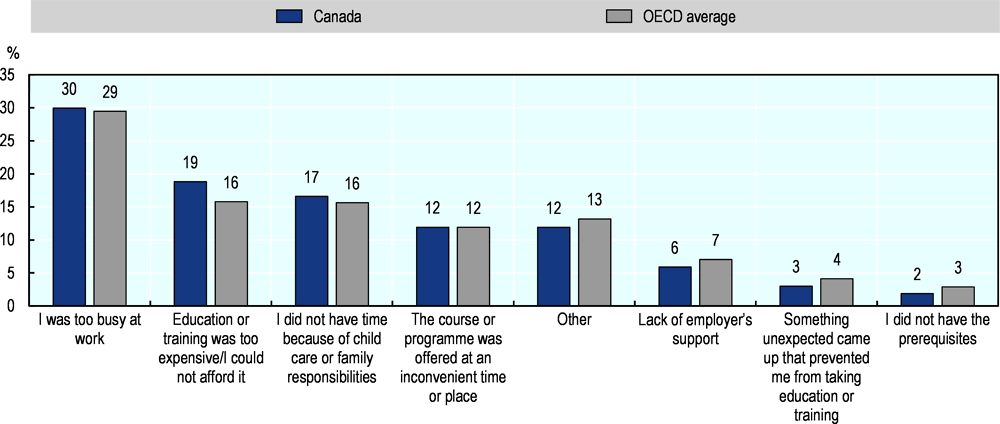
Note: Adults who wanted to participate more in formal or non-formal job-related training over the last 12 months but were unable to do so.
Source: OECD Survey of Adult Skills (PIAAC, 2012, 2015).
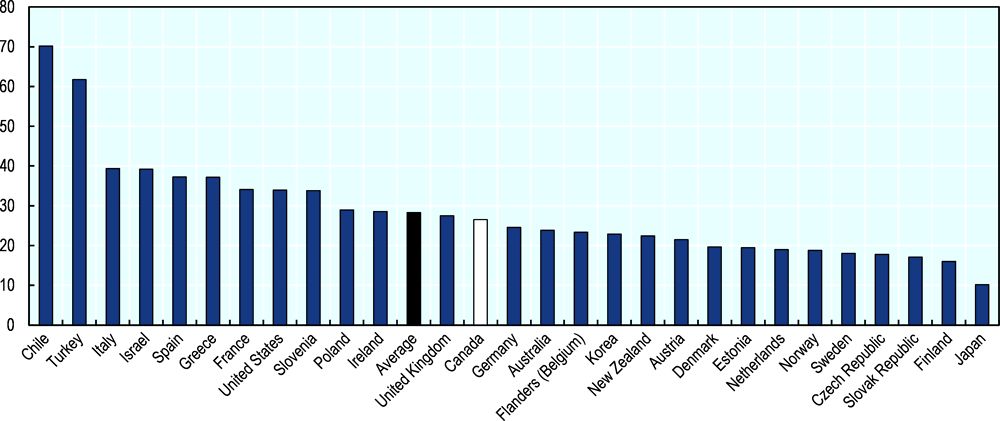
Another area where Canada performs close to average is in financing. In Canada, the personal financial cost of training represents the second most important barrier to participation (Figure 1.13). Some 19% of adults in Canada who wanted to participate more in training did not do so because it was too expensive, which is above the OECD average (16%).
The third area where Canada’s dashboard performance only ranks as average is on the impact of training. To assess whether training has a positive impact on labour market outcomes, the PAL dashboard considers various indicators: wage returns, self-reported usefulness of training, and whether adults have opportunities to use newly acquired skills in the workplace. Wage returns to training in Canada are higher than the OECD average (10% versus 8.5%), though adults in several countries enjoy greater returns to training (Chile, Lithuania, Estonia, Poland, Ireland, United Kingdom). Some 62% of adult learning participants report that at least one training activity was “very useful” for their job (PIAAC). On this measure, Canada outperforms the average (52%), and yet falls behind Denmark (82%) and New Zealand (66%). More recent data from the 2016 General Social Survey suggest stronger performance: 87% of Canadian adults who participated in training in the last 12 months reported that it helped improve job performance. However, a lower share reported that it helped to improve future job prospects (68%). An even lower share said that it improved job security (55%).
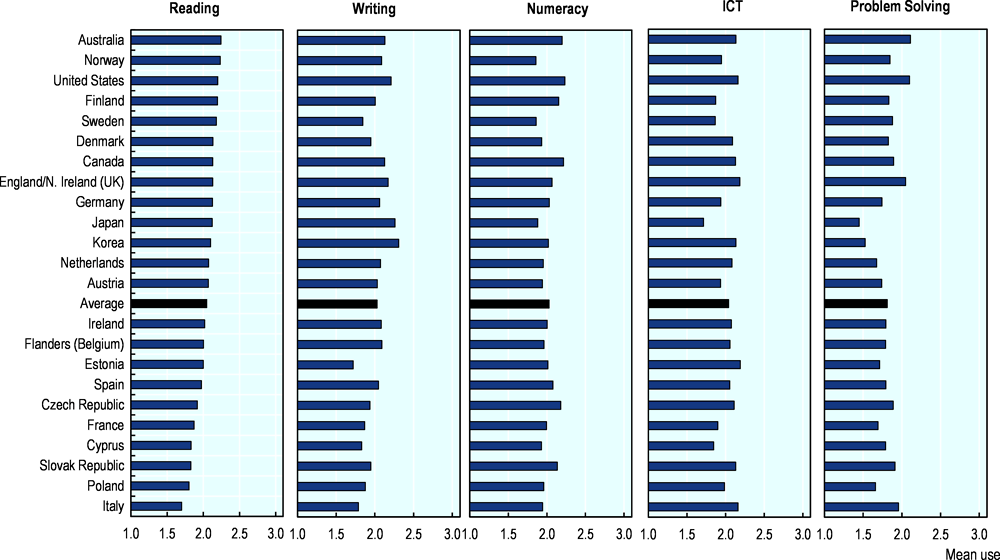
To translate newly acquired skills into higher productivity, job satisfaction and wages, adults need opportunities to deploy their skills in the workplace (OECD, 2016[19]). As noted above, the 2016 General Social Survey suggests that 35.5% of Canadian adults have the skills to cope with more demanding duties in their job. The OECD Survey of Adult Skills asks how often workers use reading, writing, numeracy, information and communication technology (ICT) and problem solving skills at work. Canada generally performs above the OECD average on the use of each type of skill (Figure 1.14). However, both the United States and Australia surpass Canada, suggesting potential to improve. Having opportunities to deploy their skills at work has an impact on employee job satisfaction and as a result, employee engagement. According to Gallup’s Employee Engagement survey with data collected from 2014 to 20168, only 20% of Canadian workers reported feeling engaged at work (Gallup, 2017[20]). This percentage is higher than the global average (15%) but much lower than the United States (33%).
Source: OECD Survey of Adult Skills (PIAAC, 2012, 2015).
Prioritising better skills use benefits in several ways. It not only improves the impact of adult learning, but it also advances the national productivity and innovation agenda (Stone, 2011[21]). Labour productivity growth in Canada lags behind the United States and other G7 countries (Figure 1.15). It has done so since the 1980s (Rao, Tang and Wang, 2008[22]). Analysts offer various explanations for Canada’s puzzling lower productivity, including an insufficient innovation culture, low capital intensity growth, and poorer infrastructure. The United States’ productivity advantage may also arise from the way that American workplaces provide employees with opportunities to use their skills. A skilled workforce does not guarantee actual skills usage. In fact, skills proficiency explains only a small fraction of the variation (OECD, 2019[23]). Dedicated efforts are needed to understand and improve skills use in the Canadian workplace. Policy responses to improve skills use in the workplace will be discussed in Chapter 3.
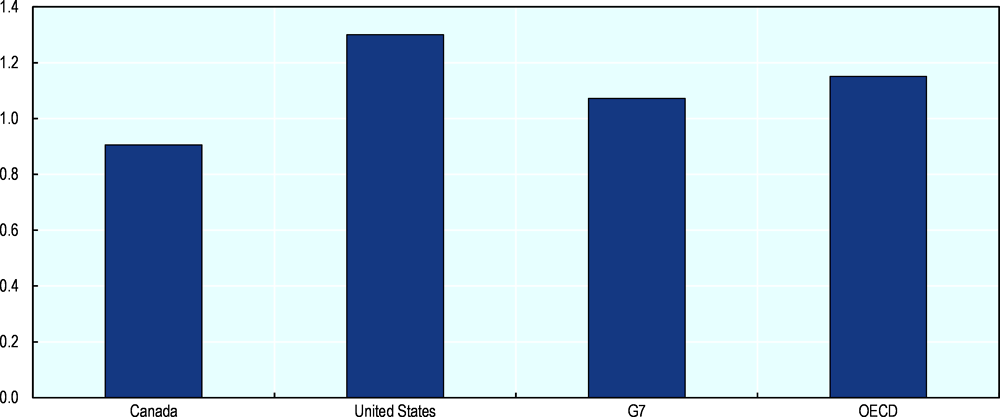
Source: OECD (2019[24]), OECD Compendium of Productivity Indicators 2019, https://dx.doi.org/10.1787/b2774f97-en.
copy the linklink copied!Summary
The skills and qualifications needed in the workplace have been changing considerably as a result of digitalisation, globalisation and population ageing. Middle-skilled jobs make up less of total employment than they once did, while the share of employment in high-skilled jobs has risen. Skills shortages have emerged, especially in jobs requiring a tertiary education, as well as those requiring a combination of digital, cognitive and social skills.
Canada needs to take a critical look at its current adult learning system. Is it well equipped to deal with the pressing challenges associated with changing demand for skills? Workers whose skills have become obsolete with technological change could benefit from retraining in higher-demand skill areas. In addition to supporting transitions from one occupation to another, Canada’s adult learning system should equip adults with the foundational skills needed to weather evolving changes in skills demand, including social skills, verbal, reasoning and quantitative abilities. A sizeable share of the adult population has low English or French literacy skills, and the share is particularly high among the immigrant population. Upgrading these skills could improve the labour market integration of immigrants. In doing so it would address skills shortages by making better use of the skills of immigrants, who are highly educated.
Canada’s adult learning system performs well in international comparison, particularly on coverage and alignment of training with labour market needs. A key challenge will be how to engage workers who typically enjoy lower access to adult learning opportunities, including older and low-skilled workers, . A sharper focus on flexibility, guidance, financing and the impact of training will support these goals.
There have been interesting recent developments in workforce innovation in Canada. The next chapter assesses their potential to improve the future-readiness of adult learning systems with reference to the dimensions above.
References
[2] Bank of Canada (2020), “Business Outlook Survey Winter 2019-20”, Bank of Canada, https://www.bankofcanada.ca/2020/01/business-outlook-survey-winter-2019-20/.
[17] Department of Finance (2019), “Budget 2019: Investing in the Middle Class”, Canadian Department of Finance, Ottawa, https://www.budget.gc.ca/2019/docs/plan/budget-2019-en.pdf.
[5] Department of Finance (2018), “Update of Long-Term Economic and Fiscal Projections”, Department of Finance, Government of Canada, https://www.fin.gc.ca/pub/ltefp-peblt/2018/report-rapport-eng.asp.
[15] Desjardins, R. (2017), “Political economy of adult learning systems: Comparative study of strategies, policies and constraints”, International Review of Education, Vol. 64/2, pp. 265-267, https://doi.org/10.1007/s11159-017-9670-1.
[16] ESDC (2017), Evaluation of the Labour Market Development Agreements: Synthesis Report, Employment and Social Development Canada, Ottawa, https://www.canada.ca/en/employment-social-development/corporate/reports/evaluations/labour-market-development-agreements.html.
[14] Eurostat (2016), “Classification of learning activities (CLA) manual: 2016 edition”, European Union, Luxembourg, https://doi.org/10.2785/874604.
[20] Gallup (2017), “State of the Global Workplace”, Gallup Press, http://file:///C:/Users/Mullock_K/Downloads/State%20of%20the%20Global%20Workplace_Gallup%20Report%20(1).pdf.
[12] Larochelle-Côté, S. and D. Hango (2016), “Overqualification, skills and job satisfaction”, in Insights on Canadian Society, Statistics Canada, Ottawa, https://www150.statcan.gc.ca/n1/en/pub/75-006-x/2016001/article/14655-eng.pdf?st=sALLE4ge (accessed on 16 December 2019).
[9] LMIC (2019), Insights into skills and jobs advertised on LinkedIn in 2018, Labour Market Information Council, https://lmic-cimt.ca/wp-content/uploads/2019/03/LMIC_LinkedIn-LMI-Insights-No-10.pdf (accessed on 26 September 2019).
[1] Manpower (2018), Solving the Talent Shortage: Build, Buy, Borrow and Bridge, Manpower Talent Shortage Survey, https://manpowergroup.ca/campaigns/manpowergroup/talent-shortage/pdf/canada-english-talent-shortage-report.pdf (accessed on 16 December 2019).
[13] Montt, G. (2015), “The causes and consequences of field-of-study mismatch: An analysis using PIAAC”, OECD Social, Employment and Migration Working Papers, No. 167, OECD Publishing, Paris, https://dx.doi.org/10.1787/5jrxm4dhv9r2-en.
[10] OECD (2019), Education at a Glance 2019: OECD Indicators, OECD Publishing, Paris, https://dx.doi.org/10.1787/f8d7880d-en.
[24] OECD (2019), OECD Compendium of Productivity Indicators 2019, OECD Publishing, Paris, https://dx.doi.org/10.1787/b2774f97-en.
[3] OECD (2019), OECD Employment Outlook 2019: The Future of Work, OECD Publishing, Paris, https://dx.doi.org/10.1787/9ee00155-en.
[7] OECD (2019), OECD Skills Outlook 2019 : Thriving in a Digital World, OECD Publishing, Paris, https://dx.doi.org/10.1787/df80bc12-en.
[23] OECD (2019), OECD Skills Strategy 2019: Skills to Shape a Better Future, OECD Publishing, Paris, https://dx.doi.org/10.1787/9789264313835-en.
[4] OECD (2017), OECD Employment Outlook 2017, OECD Publishing, Paris, https://dx.doi.org/10.1787/empl_outlook-2017-en.
[6] OECD (2017), OECD Skills Outlook 2017: Skills and Global Value Chains, OECD Publishing, Paris, https://dx.doi.org/10.1787/9789264273351-en.
[19] OECD (2016), OECD Employment Outlook 2016, OECD Publishing, Paris, https://doi.org/10.1787/empl_outlook-2016-en.
[22] Rao, S., J. Tang and W. Wang (2008), “What Explains the Canada-US Labour Productivity Gap? on JSTOR”, Canadian Public Policy, Vol. 34/2, pp. 163-192, https://www.jstor.org/stable/25463606.
[25] Skolnik, M. (2018), “Factors Contributing to Canada’s Number One International Ranking in the Proportion of Adults Who Have Attained a Community College Credential”, Centre for the Study of Canadian and International Higher Education, http://www.oise.utoronto.ca/cihe (accessed on 27 January 2020).
[21] Stone, I. (2011), “International approaches to high performance working. Project Report.”, UK Commission for Employment and Skills, London, http://www.ukces.org.uk/publications/er37-international-approaches.
[18] The Conference Board of Canada (2018), Canadian Employers’ Investment in Employee Learning and Development Continues to Rise, https://www.conferenceboard.ca/press/newsrelease/2018/01/31/canadian-employers-investment-in-employee-learning-and-development-continues-to-rise?AspxAutoDetectCookieSupport=1.
[11] Uppal, S. and S. Larochelle-Côté (2014), “Overqualification among recent university graduates in Canada”, http://www.statcan.gc.ca, (accessed on 25 November 2019).
[8] Vu, V., C. Lamb and R. Willoughby (2019), “I, Human: The digital and soft skills driving Canada’s labour market”, https://brookfieldinstitute.ca/report/i-human-the-digital-and-soft-skills-driving-canadas-labour-market/.
Notes
← 1. Estimates of labour market polarisation are sensitive to the methodology used to define low-, middle-, and high-skilled occupations. The skill level of occupations can be approximated in different ways, including by educational requirements, complexity of tasks, and wages. The OECD methodology divides occupations into skill categories based on their ISCO-88 major group. High-skill occupations include jobs classified under the ISCO-88 major groups 1, 2, and 3. That is, legislators, senior officials, and managers (group 1), professionals (group 2), and technicians and associate professionals (group 3). Middle-skill occupations include jobs classified under the ISCO-88 major groups 4, 7, and 8. That is, clerks (group 4), craft and related trades workers (group 7), and plant and machine operators and assemblers (group 8). Low-skill occupations include jobs classified under major groups 5 and 9. That is, service workers and shop and market sales workers (group 5), and elementary occupations (group 9). Skilled agricultural and fisheries workers were excluded from this analysis.
← 2. The remaining two occupations in shortage are sales-related occupations, which have low educational and skill requirements. These occupations are considered to be facing shortage pressure due to their above-average growth in wages and hours worked in recent years.
← 3. Skolnik (2018[25]) observes that Canada’s high rate of attainment of short-cycle tertiary education is due to its emphasis on the role of non-university post-secondary institutions – colleges and institutes – in the provision of programmes of two or three years’ duration.
← 4. A cégep (Collège d’enseignement général et professionnel) is a publicly-funded post-secondary education pre-university technical college exclusive to the province of Quebec.
← 5. Statistics Canada, Table: 37-10-0015-01, Postsecondary enrolments, by credential type, age group, registration status, programme type and gender.
← 6. The Workforce Development Agreements consolidate the former Canada Job Fund Agreements and the Labour Market Agreements for Persons with Disabilities.
← 7. Based on a derived variable of disability status in the 2016 General Social Survey, Canadian adults with a disability were equally likely to participate in learning opportunities as adults without a disability.
← 8. Gallup’s overall engagement measure is based on survey responses to questions about overall satisfaction at work, clarity of expectations, adequate materials and equipment, opportunity to do what one does best, recognition of good work, having someone at work who cares, feeling that one’s opinions count, clarity about organisational mission or purpose, and having opportunities to learn and grow.
