Chapter 1. How far are OECD countries from achieving the SDG targets?
Achieving the SDGs requires understanding where countries stand today, in order to plan how to reach the targets set for 2030. This chapter uses the UN Global Indicator List, supported by OECD and UN data, and a unique methodology in order to assess how far countries are from achieving the 2030 targets. It shows the distance from the targets for the OECD area as a whole, and how much of the 2030 Agenda currently remains unmeasurable. It also analyses changes in performance over the recent past, to assess whether countries are moving towards the targets, or away from them. In addition, it presents an analysis of transboundary aspects of the SDGs based on the indicators in the UN Global List that are currently available to measure these.
1.1. Introduction
The 17 Sustainable Development Goals (SDGs) are far-reaching global objectives adopted by all UN Member States in 2015 (Figure 1.1). The goals encompass five broad areas: People, Prosperity, Planet, Peace and Partnerships (the “5Ps”). The core aim of the 2030 Agenda, to improve people’s lives now and in the future, is shared by the OECD in its work on promoting better policies for better lives, and particularly in defining and measuring well-being and sustainability (OECD, 2017[1]).
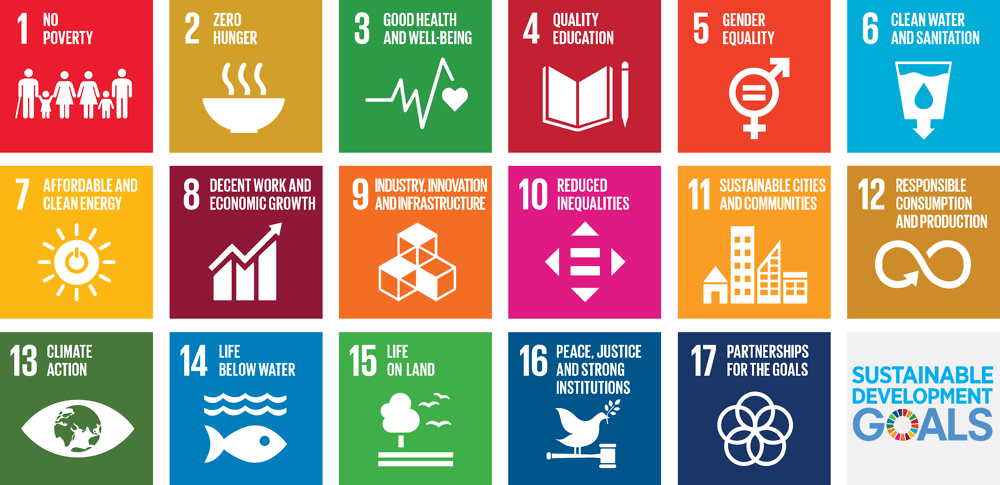
Source: (United Nations, 2019[2]), Sustainable Development Goals Communications Materials, www.un.org/sustainabledevelopment/news/communications-material/ (accessed on 10 April 2019).
Since 2015, countries around the world have been translating the SDGs into national plans and policies, and designing national implementation strategies and monitoring systems. This Study aims to support these processes, providing a high-level overview of performance that helps countries identify their key strengths and weaknesses across the goals and targets from an international comparative perspective. The assessment is based on the UN official list of SDG indicators (United Nations, 2017[3]) and in accordance with the level of ambition agreed by Member States when setting the 2030 Agenda. The Study highlights critical data gaps that need to be addressed in order to provide a more complete picture of where countries stand. These data gaps are unevenly distributed across the goals and targets, and place important limits on the conclusions that can be drawn so far.
This edition of the Study builds on earlier versions from 2016 and 2017 (OECD, 2017[4]), deepening the analysis by looking at whether countries have been moving towards or away from the targets. It also considers the indicators available to assess transboundary aspects of the 2030 Agenda – i.e. the contribution that individual countries make to whether targets are met at the global level. Finally, an assessment of how missing data could affect the findings shows the degree of uncertainty around countries’ performance in relation to each goal.
This report is organised as follows. Section 1.2 provides the context for the Study, with background information about SDGs follow-up at the UN, global and national levels. Section 1.3 presents the Study’s key findings, including a first assessment of changes in countries’ performance over time and transboundary issues; Section 1.4 concludes and Annex 1.A reviews the metadata for the indicators used in the Study.1 Chapter 2 presents country-level summary results, while Chapter 3 presents the methodology developed for the Study, including for measuring change over time and transboundary aspects.
1.2. This Study’s contribution to global SDG monitoring
On 25 September 2015, world leaders gathered in New York and adopted United Nations Resolution 70/1, “Transforming our World: the 2030 Agenda for Sustainable Development” (UN-DESA, 2018[5]). The Agenda is “a plan of action for people, planet and prosperity [which]… also seeks to strengthen universal peace in larger freedom”. The core of the Agenda is a set of 17 Sustainable Development Goals (SDGs) comprising 169 targets that draw on a large number of previous international agreements, especially concerning development, environment and human rights. The goals are presented as “integrated and indivisible, global in nature and universally applicable”. The Agenda presents them as addressing the 5Ps: People (broadly corresponding to goals 1-5), Planet (goals 6, 12, 13, 14 and 15), Prosperity (goals 7-11), Peace (goal 16) and Partnership (goal 17).
Partly because the 2030 Agenda was politically driven, rather than based on a conceptual framework, its 169 targets are heterogeneous. About one third of them are “means of implementation”, while the others are located at various points along the input-process-output-outcome-impact chain – for example, targets include healthcare financing (inputs, targets 3.8 and 3.c), development of vaccines (outputs, target 3.b) or reducing premature mortality (outcomes, target 3.4). This mix of different types of objectives and the consequent need to resort to different types of data to measure progress present a substantial challenge for implementation and evaluation (Kanbur, Patel and Stiglitz, 2018[6]).
In agreeing on the 2030 Agenda, governments around the world committed to implementing the SDGs in their national settings. The Agenda states that “Targets are defined as aspirational and global, with each government setting its own national targets guided by the global level of ambition but taking into account national circumstances” (UN-DESA, 2018[5]). This wide scope for countries in setting their national targets and implementing the SDGs means that each country must decide for itself on national targets and then integrate these into national processes. The Agenda also leaves the means of review of national progress to each UN Member State to determine.
The 2030 Agenda is more explicit regarding global reviews and monitoring, and has set up a process that includes an annual report by the UN Secretary-General and regular reviews by the High-Level Political Forum on Sustainable Development (HLPF). The HLPF is organised annually under the auspices of UN Economic and Social Council and once every four years under the UN General Assembly; this forum provides the setting for countries to present their Voluntary National Reviews (VNRs) as well as for the thematic reviews of the SDGs.
1.2.1. The global framework for SDG follow-up and review
The main institutional structure for global SDG monitoring was set up prior to the adoption of the 2030 Agenda, with the creation of the Inter-Agency and Expert Group on SDG Indicators (IAEG-SDGs) in March 2015.2 The IAEG-SDGs’ task was to develop and implement a global indicator framework for the goals and targets of the 2030 Agenda (henceforth, the UN Global Indicator List). The framework, composed of 244 indicators,3 was finalised at the UN Statistical Commission session held in March 2017, and subsequently adopted by the UN General Assembly in the Fall of 2017. These indicators align with the 169 targets and 17 goals, but are not distributed evenly: goals have between 5 and 19 targets, and targets have between one (most targets) and five (target 3.3) indicators.
These 244 global indicators were classified into three tiers based on their methodological development and data availability, as follows:
-
Tier I indicators are those that are conceptually clear, based on established methodology and standards, and regularly produced by at least 50% of countries accounting for at least 50% of the population of each region;
-
Tier II indicators are those that are conceptually clear, based on established methodology and standards, but not regularly produced by countries; and
-
Tier III indicators are those that still lack an established methodology or standards (IAEG-SDGs, 2019[7]).
The IAEG-SDGs is regularly revising indicators’ tier classifications as their methodology and data availability evolve. As of February 2019, 101 indicators were identified as Tier I, 84 as Tier II and 41 as Tier III. A further six indicators had multiple tiers (i.e. different components of the indicator are classified into different tiers). The average tier level of indicators varies across the goals, with some areas more advanced, such as goals relating to People, and other less, such as goals relating to Planet. This is reflected in the data available for this Study, as detailed in Section 1.3.1.
The IAEG-SDGs has recently presented a report outlining the methodological development of Tier III indicators, including the timeline for a comprehensive review of the UN Global Indicator List in 2020, also highlighting the work on data disaggregation (UN-ECOSOC, 2019[8]). Additionally, draft guidelines on data flows (IAEG-SDGs, 2018[9]) were agreed at the IAEG-SDGs November 2018 meeting, and discussed at the United Nations Statistical Commission meeting in March 2019. The guidelines state that global monitoring should primarily rely on country data produced by National Statistical Offices (NSOs). To support the development and compilation of these data, the IAEG-SDGs has identified custodian agencies for each indicator. These custodian agencies are responsible to help ensure international comparability, compute regional and global aggregates, and provide data for the UN Global SDG Indicators Database (UN Statistics Division, 2018[10]); henceforth, the UN Global Database.
The annual UN Secretary-General’s report (UN-DESA, 2018[5]) and UN-DESA’s Sustainable Development Goals Report (UN-ECOSOC, 2018[11]) are both based on the data available in the UN Global Database. This database provides access to data compiled by the UN system and other custodian agencies, and currently contains data for 153 individual indicators of the 232 unique indicators (244 including recurring indicators) in the UN Global Indicator List.4 However, these indicators vary widely in country coverage. For example, only half of them have comparable data available for at least 20 OECD countries, covering both EU and non-EU members, which is the minimum criterion regarding country coverage set for this Study. Many other studies have responded to the dearth of data on the UN Global Indicator List by limiting the targets covered, or by using other indicators (see Box 1.1).
Since 2015, many international, governmental and non-governmental initiatives have been launched to assess SDG performance at all levels of monitoring (Sachs et al., 2018[12]; Kharas, 2018[13]; UN-ECOSOC, 2018[11]).
The UN’s annual global reports (discussed above) are complemented by those by UN Regional Commissions, who play a key role in promoting SDG follow-up adapted to regional needs and interests. For example, the UN Economic Commission for Africa, in co-operation with other regional actors, publishes annual SDGs reports tackling issues such as the transition from the Millennium Development Goals to the SDGs (UNECA, 2016[14]). Reports by the Economic Commissions for Latin America and the Caribbean (ECLAC) and for Asia and the Pacific (ESCAP) set out regional progress in SDG implementation, with ECLAC identifying critical links across goals (UNECLAC, 2018[15]) and ESCAP focusing on key strengths and weaknesses (UNESCAP, 2018[16]). The Economic Commission for Europe (ECE) has published a comprehensive Road Map on Statistics for SDGs to help countries meet the data challenges of the Agenda (UNECE, 2017[17]).
In the European Union, sustainable development was mainstreamed in 2010 into the Europe 2020 Strategy (European Commission, 2016[18]), which addresses economic, social and environmental policy areas, similar to the SDGs. With the alignment of the two, Eurostat’s approach to measuring progress on SDGs focuses on existing EU policies and goals identified as relevant for the SDGs (Eurostat, 2018[19]).
The SDG Index and Dashboards Report has been published since 2016 by the Bertelsmann Foundation in co-operation with the UN Sustainable Development Solutions Network (SDSN) (Sachs et al., 2018[12]). The report compiles measures across goals and targets to produce a single aggregate index, and subsequently ranks 193 countries according to their performance on that index. The data are only partially aligned with the UN Global Indicator List, and are sourced from publicly available data from official data providers and international organisations (e.g. World Bank, WHO, ILO, OECD) as well as from research centres and non-governmental organisations, with varying levels of country coverage.
UN-Habitat estimates that 23% of all SDG indicators have a local or urban component, and can be measured at the local level. To capture this sub-national dimension, UN-Habitat proposes that national governments and local authorities adopt the City Prosperity Initiative (CPI) as a global monitoring platform for all SDGs with an urban component (UN HABITAT[20]). The CPI integrates all the indicators pertaining to goal 11 and a selected number of other SDG indicators referring to different aspects of shared prosperity and sustainability. The OECD’s Programme on A Territorial Approach to the SDGs: A role for cities and regions to leave no one behind, launched at the 2018 HLPF, also aims to support cities and regions to develop, implement and monitor strategies to achieve SDGs (OECD, 2018[21]).
1.2.2. The purpose and approach of this Study
This Study contributes to the OECD Action Plan on SDGs (OECD, 2016[22]), and in particular Action Area 2, which aims to “Leverage OECD data to help analyse progress in the implementation of the SDGs”. A central part of the OECD’s data effort aims to contribute to the global monitoring framework itself, and to the UN’s global reports on SDG progress. As a custodian agency, the OECD directly supplies data to the UN Global Database on official development assistance and other international flows, as well on gender-based legal discrimination through the Social Institutions and Gender Index (SIGI). It also contributes data to other custodian agencies across a range of topics including policy coherence, education, environment and migration (OECD, 2016[22]).
The Study deepens the OECD’s data-related support to member countries by offering a high-level picture of performance right across the goals and targets of the 2030 Agenda. It draws on data aligned with the UN Global Indicator List, and assesses where countries stand in relation to the targets that were agreed by Member States when setting the 2030 Agenda.5 It aims to help countries in both navigating and implementing the SDGs by:
-
identifying available comparative indicators that members could use to set their strategic priorities within the SDG agenda, and to track progress towards them;
-
assessing countries’ current position on each of the targets, and putting this into context through a comparison with the OECD average; and
-
highlighting key data gaps where statistical development will be particularly important, either to track progress or to advance understanding of the policy drivers of SDG targets.
The Study’s methodology is described in detail in Chapter 3. To capture the effort needed to reach the different SDG targets, this Study applies a standardised method that measures the distance between OECD countries’ current performance and where they should be in 2030. Doing so requires identifying suitable data sources for indicators to track the targets and (where this is not specified in the 2030 Agenda itself) defining a desirable level to be achieved by 2030. This methodology distinguishes this Study from other approaches as detailed in Box 1.2.
Identifying suitable data sources
The Study takes the November 2018 edition of the UN Global Indicator List defined by the IAEG-SDGs as its starting point. The following decision rules are then applied:
-
1. Where OECD data aligned with the UN Global Indicator List exist, the Study takes OECD data6 (around 43% of indicators used).
-
2. Where no OECD data sources exist, data are extracted from the UN Global Database (around 33% of indicators used).
-
3. Where neither OECD nor UN Global Database data are in full alignment with the UN Global Indicator List, then OECD data that are considered suitable as close proxies are used (around 24% of indicators used).
As already mentioned, indicators are only included if data are available for at least 20 OECD countries, and not limited to EU countries only.
Setting target levels
The SDGs encompass 169 targets to be achieved by 2030. Measuring distances from these targets requires a degree of precision that the 2030 Agenda does not always provide (Box 1.2, below). In the present Study, a four-step process was followed:
-
1. Wherever possible, target levels explicitly specified in the 2030 Agenda are used. This is typically a fixed value identified in the wording of the target (e.g. maternal mortality ratio below 70 per 100 000 live births for target 3.1) or, in a small number of cases, expressed as a relative improvement (e.g. reduce at least by half the proportion of people living in poverty for target 1.2). This applies to around 40% of the indicators considered in this Study.
-
2. Where no target value is identified in the text of the 2030 Agenda, target levels were drawn from other international agreements (e.g. reduce PM2.5 pollution to less than 10 micrograms per cubic meter, according to the WHO) or based on OECD expert judgment (e.g. water stress is considered to be low if total freshwater abstraction is below 10% of total internal renewable resources (OECD, 2017[23])). This applies to around 16% of the indicators used.
-
3. If no target value can be identified from either the 2030 Agenda or expert sources then the target level is based on current “best performance” among OECD countries. This is defined as the 90th percentile – i.e. the level attained by the top 10% of OECD countries (e.g. a recycling rate of municipal waste). This method is used for just over one quarter of the indicators.
-
4. Finally, for indicators lacking a clear normative direction (e.g. the share of manufacturing in value added), no target level is set and no “distance” is measured in the Study. This applies to around 17% of the indicators used in this Study; for these indicators, performance is shown separately in Section 1.3.
Measuring distance
In order to compare performance across different targets, indicator values are normalised using a modified version of the z-score (i.e. distance is expressed as the number of OECD standard deviations a country is from reaching the target level).7 In the results that follow, this is described as the “standardised difference” between the country’s current position and the target end-value. The higher the distance, the further the country needs to travel to achieve its target. A zero distance means the country has already achieved the 2030 target. Negative scores mean the country already exceeds the target; these negative values are trimmed to zero in the figures reported below.
Approaches to SDG monitoring and reporting vary significantly across countries and international organisations. This partly reflects the different institutional roles of each organisation. National Statistical Offices (NSOs), for example, follow the UN Global Indicator List when collecting data for the UN Global Database. Other units in national administration may use a different set of indicators to align with their own domestic policy agendas and priorities. International organisations and think tanks also use different methodologies and datasets, selected according to their priorities and value judgments.
Selection of indicators and data coverage
Government departments, NSOs and other actors have relied on different sets of indicators for monitoring the SDGs. As mentioned, this OECD Study uses the 244 indicators of the UN Global Indicator List as its starting point, sourcing data from the UN Global Database and OECD data. The annual report on SDGs of the UN Secretary General is based on the data from the UN Global Database, following the UN Global Indicator List, but presents results only at a global level. UN Regional Commissions present results aggregated at the regional level based on the UN Global Indicator List. Similarly, some OECD countries, such as Denmark, Italy and the United Kingdom, have based their monitoring and reporting on the UN Global Indicator List, aiming to report on all SDG targets in the future. Other countries, have selected only nationally relevant indicators from the UN Global Indicator List, for which data are available from the statistical office or other official sources. As mentioned above, Eurostat assesses performance on SDGs in alignment with the 2020 Sustainable Development Strategy. The monitoring framework consists of 100 indicators, of which only 51 are drawn from the UN Global Indicator List. The 100 indicators are distributed evenly across the 17 goals, with results presented for the EU as a whole, together with an assessment of trends (Eurostat, 2018[19]).
In order to measure progress in meeting specific national targets, some countries have developed their own sets of indicators, not aligned with the UN Global Indicator List. For example, Finland started to monitor its progress towards sustainable development soon after the 2030 Agenda was adopted and thus before the UN Global Indicator List was finalised. A similar approach to indicator selection was used in the Czech Republic, where 192 indicators were identified to measure progress towards national targets; the selection of these indicators was based on indicators in the UN Global Indicator List, the indicators used in the 2016 version of the OECD Study and indicators in the Eurostat framework.
Alignment with the SDGs: Goal, target or indicator level
At one end of the spectrum, some studies follow the UN Global Indicator List very closely. For example, this Study adheres to the UN Framework at the goal, target and indicator level, making every effort to include all UN Global Indicator List, and offering the most complete coverage of the 169 targets that can be achieved within data constraints. Similarly, the report of the UN Secretary General (UN-DESA, 2018[5]) uses a selection of indicators drawn from the UN Global Indicator List. At the other end of the spectrum, a number of approaches to SDG monitoring are very loosely aligned with the 2030 Agenda, offering no direct correspondence with the indicators, targets or even goals of the Global Monitoring Framework. For example, the Social Progress Index has been adapted for use as an SDG monitoring tool (Social Progress Imperative, 2018[24]), despite missing several core aspects of the 2030 Agenda, particularly in relation to the Prosperity and Planet goals. Other studies align to the SDGs only at the goal level: for example, the Federal Planning Bureau in Belgium uses two SDG indicators per goal, rather than trying to cover all 169 targets and 244 indicators (Bureau fédéral du Plan, 2016[25]). Eurostat’s report also aligns with SDGs only at goal level, including some indicators from the UN Global Indicator List.
Setting target levels
National, regional and international SDG reports may also show different results due to the methods used for setting the target levels (end values) to be achieved for various indicators. While these levels are sometimes specified in the 2030 Agenda, this is not always the case (see above). A further challenge arises from the need to reconcile the level of ambition set by the 2030 Agenda with other commitments and political processes, such as in the case of the European 2020 Strategy, or the Paris Agreement on climate change. The latter entered into force over one year after the SDGs were agreed in 2015, with ambitions that go beyond those embodied in goal 13 (climate) of the 2030 Agenda.
The Belgian national monitoring system (Bureau fédéral du Plan, 2016[25]) groups targets into two categories: a) well-defined, quantified, time-bound objectives; and b) objectives with desired directions only. Both well-defined targets and desired directions are assessed on a scale of “favourable” (i.e. reached or near/moving in the right direction), “unfavourable” (i.e. not reached/moving in the wrong direction) or “undetermined”. Similarly, Eurostat’s 2018 report (Eurostat, 2018[19]) calculates trends based on compound annual growth rates, differentiating between indicators with clear target levels and those without. According to the pace of change, the report assigns 4 possible assessments of the trends: “significant”, “moderate”, or “insufficient” progress towards the target, and “movement away from the target”. The SDGs Index and Dashboard Report (Sachs et al., 2018[12]) uses the average of the top performers to set the upper bound of each indicator.
Dynamic vs. static analysis
Approaches to measuring performance on SDGs can be either static, i.e. assessing what is the current situation vis-à-vis the 2030 targets, or dynamic, i.e. assessing changes over time, and/or forecasting whether targets are likely to be met by 2030. Dynamic approaches include a recent Brookings Institute report (Kharas, 2018[13]), which estimates the distance of countries from achieving SDG targets using a normalisation method similar to that used in the OECD Pilot, on a 0 to 100 scale. The underlying methodology looks at countries’ trajectories to 2030 extrapolated from observed trends, and extracts distance from targets, which are then normalised.
Other dynamic analyses include the SDGs Index and Dashboard Report (Sachs et al., 2018[12]), which estimates how fast countries have been progressing towards the SDG targets, and whether this pace will be sufficient to achieve them by 2030, as well as the aforementioned Eurostat and Belgian reports. This Study only shows the direction of change for all indicators for which data are available.
Innovations in this edition and future plans
The present Study extends previous editions (2016, 2017) by offering greater indicator and target coverage, more up-to-date data, and closer adherence to the UN Global Indicator List (which has evolved since 2017). It also discusses transboundary effects – i.e. how actions taken in one country might affect the success of other countries, or the world as a whole, in meeting the goals of the 2030 Agenda. Finally, the Study presents a straightforward method for assessing changes over time.
Future work could explore possible extensions of the methodology to non-OECD countries, and enhance the assessment of OECD countries’ transboundary contributions to the achievement of the 2030 Agenda. The Study methodology was also adapted to consider countries’ distance from the SDG targets for specific population groups, starting with children and youth (Marguerit, Cohen and Exton, 2018[26]); an analysis by gender is currently ongoing.
1.2.3. Countries’ use of this Study so far
As part of their national SDGs implementation processes, several member countries have used evidence from the previous Study to:
-
Communicate on SDGs: This includes initiatives to inform internal policy debates, to set priorities and goals for national strategies; to provide an overall picture of countries’ SDG performance as a starting point for a broader public debate; to present data coverage or data gaps in the UN Global Database; and to identify national strengths and weaknesses based on comparative results (e.g. Slovenia, Denmark).
-
Develop national monitoring and reporting systems to select national indicators; to establish starting positions and nationally relevant target values, and to develop dynamic baselines (e.g. Czech Republic, Belgium).
-
Identify policy-relevant areas of action, prioritising their alignment with SDGs (e.g. Slovak Republic, Poland).
Results of the 2016 and the 2017 editions were quoted in Voluntary National Reviews (VNRs) submitted to the UN-HLPF by Belgium, the Czech Republic, Poland, Slovenia, the Slovak Republic and Sweden. In 2018, Slovenia published an update of its 2017 VNR which used the 2017 version of the OECD Study to show progress made in SDGs implementation (United Nations[27]).
Statistics Netherlands issued two reports assessing the country’s performance on SDGs, which both used the OECD Study as one of the main resources for comparative data at country level (Statistics Netherlands, 2017[28]; 2018[29]). Denmark published a statistical report in 2017 aimed at providing an overall picture of the country’s starting point on SDGs to inform public debate (Statistics Denmark, 2017[30]), referencing the OECD Study among other international assessments of countries performance on SDGs. The Czech Republic used the Study results to identify policy gaps in its national implementation plan for the SDGs.
Developing national monitoring systems
Member countries are also using the OECD Study to guide their monitoring processes. Slovenia, Italy, Belgium and the Czech Republic have used the methodology of previous versions of this Study to test the robustness of national indicators, or to develop static and dynamic baselines. In building its national reporting framework, Luxembourg is considering the indicator set used by this Study alongside other national and international indicator sets.
Targeted country support for mainstreaming the 2030 Agenda
As part of a joint project to support implementation of the SDGs, the Slovenian government designed its National Development Strategy around several of the priorities identified by the OECD Study, such as the need to increase trust in institutions and the quality of governance more generally (Slovenian Government, 2017[31]). The elaboration of the National Development Strategy involved several governmental and non-governmental stakeholders, and used evidence from the OECD Study to present the country’s SDG starting positions in a comparative perspective. The Study also contributed to the OECD’s broader work to assist the Slovenian government in setting targets on a number of its key goals.
In addition to the OECD’s work with the Slovenian government mentioned above, the government of the Slovak Republic also engaged with the OECD when preparing its 2030 Agenda roadmap and national strategy. This included the development of an indicator framework, with 2030 targets based on the methodology and data from the OECD Study. Additionally, several countries, both OECD and non-OECD members, expressed interest in the detailed results and further analysis based on this Study.
1.3. How far are OECD countries from the SDG targets? Key findings
This section presents the Study’s key findings at the indicator, target and goal level for the OECD average, while also describing how data gaps affects the interpretation of results. It also discusses the challenges faced when trying to measure the distance to target for those indicators with no clear target level is specified in the 2030 Agenda. Finally, it includes an analysis of changes over time in performance at indicator and goal level, and looks at the transboundary aspects of the 2030 Agenda. Chapter 2 presents detailed country fiches showing key results for individual OECD countries.
1.3.1. How many indicators of the UN Global Indicator List can be measured for OECD countries?
In total, this Study relies on data for 132 of the 244 UN Global Indicator List (or close proxies) that met the selection criteria outlined in the previous section. These indicators cover 105 of the 169 targets. However only 87 targets have at least one indicator with a clear normative direction, thereby allowing measuring distance to targets. Indicator coverage is uneven across the 17 goals, with the goals on Health (3), Infrastructure (9) and Education (4) having the largest share of targets covered by at least one indicator, and Oceans (14) and Sustainable Production (12) the lowest (Figure 1.2).
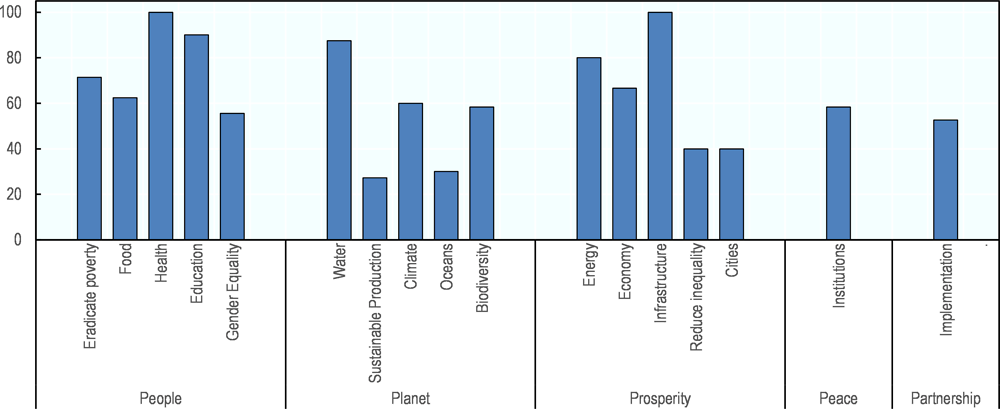
Note: Share of targets covered by at least one indicator in the present study, out of the 169 targets of the 2030 Agenda. Coverage is shown according to the 17 goals and 5Ps.
Source: OECD calculations.
1.3.2. What distance will OECD countries have to travel to achieve the SDGs?
Figure 1.3 shows distances from the 2030 targets for the OECD as a whole by goal and target, with the outer boundary indicating targets that are already achieved today. Distances differ significantly even when considering a specific goal, which suggests that, when seeking to identify strategic priorities for implementing the SDGs, countries should look at performance against targets rather than focusing on average results by goal. For instance, for the goal on Food (2), targets relating to soil quality and breed protection are fairly close to being met, but performance on obesity rates is far from the target level. Similarly, on the Institutions goal (16), most OECD countries perform well on registration of births, but poorly on confidence in national government.
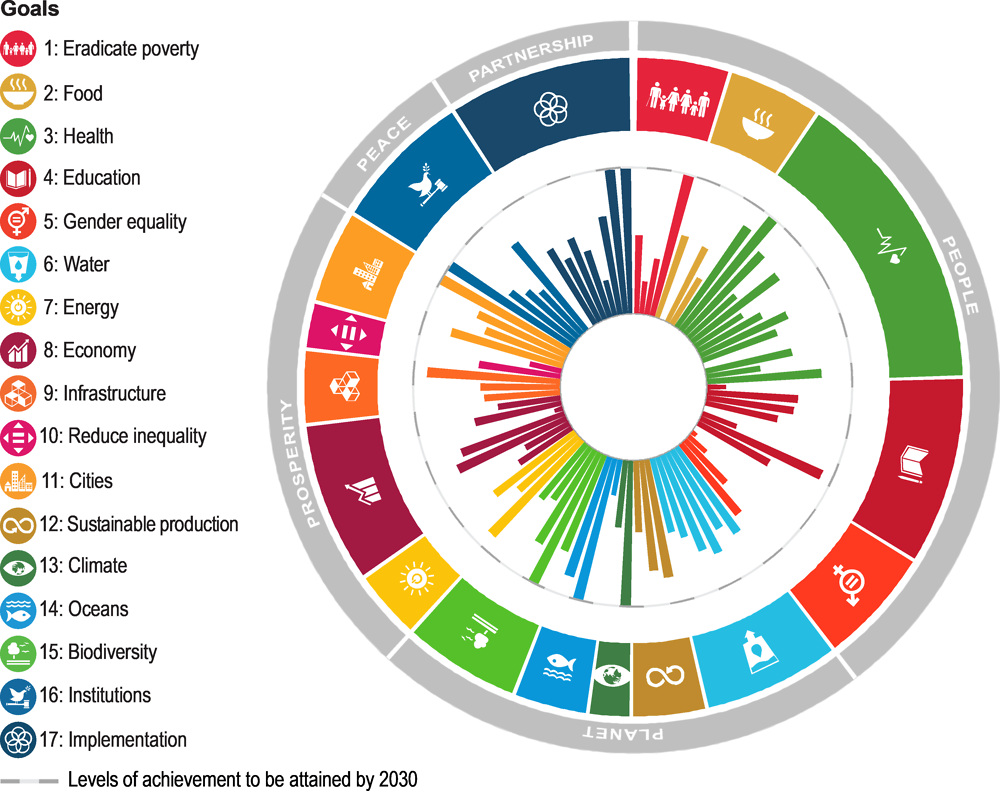
Note: The chart shows how far OECD countries (on average) are from achieving each target for which data are available. The longer the bars, the shorter the distance to be travelled by 2030; target levels are represented by the outer dotted circle. The inner circle (the starting point for the bars) represents a score of 3 or more standardised distances away from target, which most OECD countries have achieved on most targets. Targets are shown by goal, and goals are clustered by the “5Ps” of the 2030 Agenda.
Source: See Annex 1.A for summary metadata, and www.oecd.org/sdd/OECD-Measuring-Distance-to-SDGs-Targets-Metadata.pdf for detailed metadata.
Table 1.1 further highlights these uneven performances. OECD countries are closest to reaching the 2030 targets (Panel A) in several fields that, conversely, remain critically important for less developed countries. For example, all OECD countries have already achieved maternal, infant and neonatal mortality rates far below those required by the 2030 Agenda (indicators 3.1.1, 3.1.2 and 3.2.2); most schools in OECD countries provide access to internet for pedagogical purposes (4.a.1); and almost all OECD citizens have access to electricity and mobile networks (7.1.1 and 9.c.1). On the other hand, Panel B shows where performance in OECD countries lags furthest behind the 2030 targets. This spans a wide range of fields, such as inequalities, education, biodiversity, healthy behaviours, violence and feelings of safety, and human rights. Distances are especially wide for indicators of relative poverty (1.2.1 and 10.2.1), learning disparities among students (4.5.1 and 4.6.1), gender inequality (5.2.1 and 5.5.1), obesity (2.2.2) and tobacco consumption (3.a.1). Overall, Table 1.1 shows that OECD countries’ average strengths and weaknesses are both spread across a wide range of goals and targets.
Despite variations within goals, it is also interesting to look at results at the goal level (Figure 1.4). OECD countries are, on average, closest to reaching targets for the goals on Cities (11), Climate (13) and Energy (7), while also showing relatively strong performances for the goals on Oceans (14), Sustainable Production (12), Biodiversity (15), Means of Implementation (17), Infrastructure (9) and Water (6). Conversely, while the Agenda’s overarching aim is to “leave no one behind”, OECD countries (on average) appear to be furthest from their 2030 targets on Gender Equality (5), Food (2) and Reducing Inequality (10). Targets pertaining to goals on Education (4) and Eradicating Poverty (1) and Economy (8) are also relatively far from being met.
When evaluating countries’ performances at the goal and 5P levels, attention should be paid to uncertainties arising from missing data – while also being mindful of the constraints imposed by the need to adhere closely to the UN Global Indicator List. Figure 1.4 indicates the potential impact of missing data on the distances measured at goal-level by showing (as whiskers) the full range of possible uncertainties (under the two assumptions that the indicators that are currently missing could either have attained their targets level or, conversely, be far away from those levels). The range of uncertainty is largest for most Planet goals, as well as for goals on Cities (11) and Reducing Inequality (10). Conversely, data are available for all UN Global Indicators in goals on Health (3) and Infrastructure (9) for OECD countries. This analysis shows that if data were available to fill these measurement gaps, the ranking of the goals by distance to target could change dramatically.
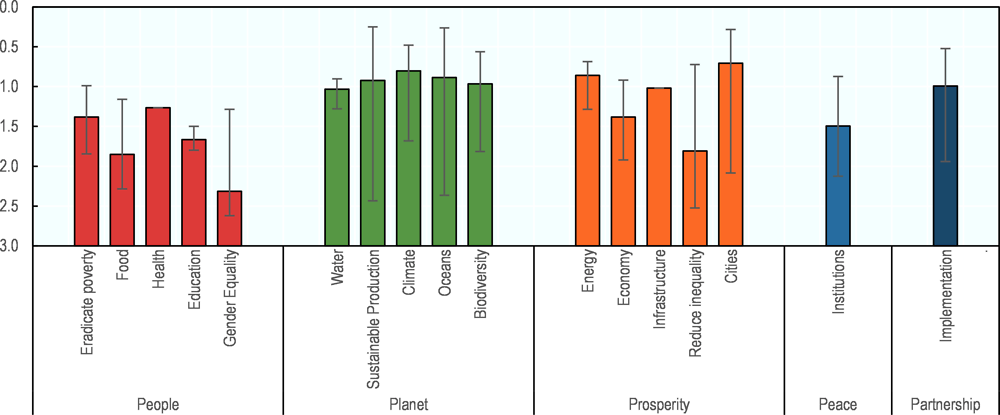
Note: This figure shows the average distance OECD countries need to travel to reach each SDG. Distances are measured in standardised units (see Chapter 3 for details), from 0 indicating that the 2030 level has already been attained, to 3 as most OECD countries have already reached this distance. Bars show OECD countries’ average performance against all targets under the relevant Goal for which data are available. Whiskers show uncertainties due to missing data, based on the alternative assumptions that either missing indicators are 3 standardised distances away from the 2030 target or that they are all already at the target level.
Source: See www.oecd.org/sdd/OECD-Measuring-Distance-to-SDGs-Targets-Metadata.pdf for detailed metadata.
Distances from targets also vary significantly across countries (Figure 1.5). Especially on the goals relating to Reducing Inequality (10), Oceans (14), Gender Equality (5), and Eradicating Poverty (1), some countries are much closer to the 2030 targets than others. On the other hand, performance is more uniform across countries, and generally quite good, for goals relating to Institutions (16), Economy (8), Implementation (17) and Energy (7).
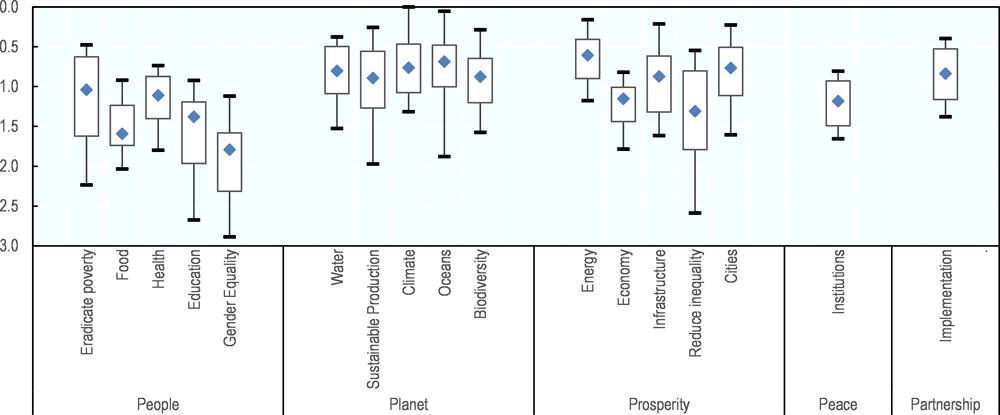
Note: The charts shows the distribution of OECD countries’ distances to targets on the 17 goals; distances are expressed in standardised units. Central diamonds refer to the OECD median distance. Box boundaries indicate the first and third quartiles of the country distribution. Whiskers indicate the 10th and 90th percentiles of the country distribution.
Source: See www.oecd.org/sdd/OECD-Measuring-Distance-to-SDGs-Targets-Metadata.pdf for detailed metadata.
Challenges in measuring distances to targets: indicators on the UN Global Indicator List lacking a clear normative direction
As already noted, countries’ performances on 18 of the 105 targets covered in this Study were not assessed because it was not possible to establish a numerical target level to be achieved by 2030. Thirteen of these targets relate to flows of official development assistance (ODA) in specific sectors. This is because, while there is a clear international benchmark for total ODA provided by donor countries (0.7% of gross national income), the ideal sectoral breakdown of this aid will depend on the needs of each recipient needs and the priorities of each donor (see Box 1.3). In the remaining cases, the UN Global Indicator List includes indicators expressed as a share of GDP (e.g. the share of labour compensation or of manufacturing, of GDP), where no one-size-fits-all target would be appropriate for every country. For all indicators without a target level, it was not possible to measure the distance to target, and they are excluded in the results presented above. However, as these indicators are part of the UN Global Indicator List, their median values, and the top 10th and bottom 90th percentiles are also included in Table 1.2.
1.3.3. Trends: Are OECD countries heading in the right direction?
Previous editions of this Study have focused on countries’ current position vis-à-vis the SDG targets, rather than on the direction or pace of improvement. Yet, even when a country is already at (or near) its 2030 target, it may slip behind without continued effort. Conversely, a country that is still far from its 2030 target might still reach it by maintaining the rapid progress that it achieved in the recent past. Examining OECD countries’ recent historical performance may therefore help to assess the likelihood of reaching the targets by 2030.
Among the indicators used in this Study, time-series are available for 76 indicators to assess changes since 2005; these 76 indicators cover 63 targets (the methodology is detailed in Chapter 3). Table 1.3 shows for each indicator, the number of countries which had been moving towards target, away from target, or for which no trend is visible (either because their historical performance has been broadly stable, or because the time-series is too volatile, or too short to identify a trend data).
Patterns differ across both OECD countries and the indicators and targets considered. One-third or more of OECD countries have been moving towards the targets for 33 indicators, while for 57 indicators at least one third of OECD countries display no visible trend. Finally, for 7 indicators, more than one third of OECD countries have been moving in recent years away from their 2030 targets. These negative developments characterise the targets pertaining to Food (2.2.2 on obesity), Heath (3.b.1 on vaccination coverage), Economy (8.1.1 on GDP growth, 8.2.1 on productivity growth, and 8.5.2 on unemployment), Cities (11.6.1 on material recycling rate) and Biodiversity (15.5.1 on the conservation status of major species groups and extinction risk over time).
These results should, however, be interpreted carefully. Progress towards the target says nothing about whether the pace recently achieved by a country would be sufficient to meet the target level by 2030. The evidence in Table 1.3 should therefore be considered as only a first step towards a more extensive analysis that would allow target-by-target projections of the future trajectories for each country. Such analysis could focus on those indicators that, while not having yet reached their target levels, are moving towards them, and on those that indicators that, while having already reached the targets, have been slipping back in recent years; it could also move beyond “business as usual” scenarios, to consider the effect of policies or other drivers on these trajectories.8
Figure 1.6 summarises the evidence shown in Table 1.3 at the goal level. The overall pattern is one of moderately positive overall changes. In particular, more than one third of OECD countries have been progressing toward the targets for the goals on Health (3), Gender Equality (5), Energy (7), Infrastructure (9), Means of Implementation (17), as well as for all five goals relating to Planet. Conversely, more than half of OECD countries achieved no significant changes for the goals on Eradicating Poverty (1), Food (2), Education (4), Energy (7), Reducing Inequality (10) and Institutions (16). For the Economy goal (8), one third of OECD countries have been moving away from the SDG targets.
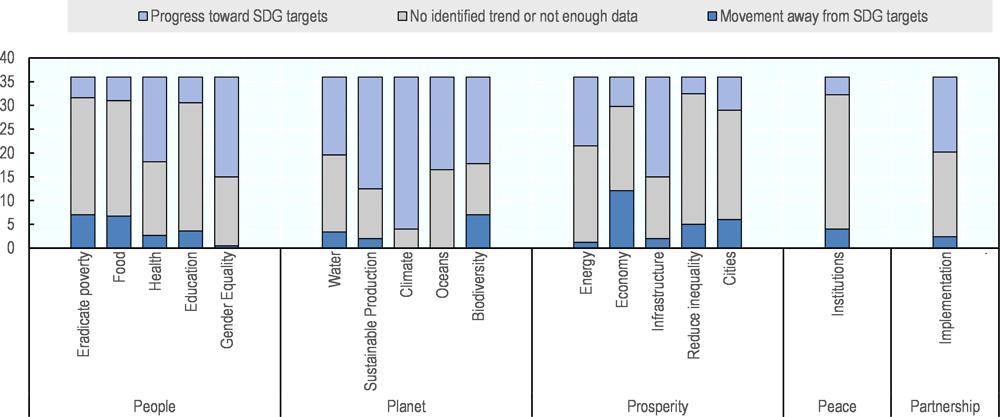
Note: Trends are assessed through the Spearman correlation coefficient between the indicator values in different years and time. The trend is described as “movement away from the SDG target” if the correlation coefficient (corrected for the normative direction of each indicator) is significant and negative; as “progress toward SDG targets” if the correlation coefficient is significant and positive; as “no trend identified or not enough data” when the coefficient is close to 0 or not significant or there are no dataseries available. The figure shows the average number of countries for each type of trend, grouped by goals, as detailed in Table 1.3.
Source: See www.oecd.org/sdd/OECD-Measuring-Distance-to-SDGs-Targets-Metadata.pdf for detailed metadata.
1.3.4. Monitoring the transboundary aspects of the 2030 Agenda
Actions taken in one OECD country can have an important impact on other countries’ ability to meet the SDGs, as well as on global public goods embedded in the 2030 Agenda. It is therefore important to assess the transboundary aspects of the Agenda, i.e. the effect a country achieving the targets may have outside its borders.
Measuring transboundary impacts is a task that can imply different levels of ambition. At one extreme, measuring these effects in a comprehensive way could require a full model describing how every country has an impact on every other country and on global public goods. This is an ambitious undertaking, but also one that goes well beyond what is feasible at the present state of knowledge. The narrower approach adopted here considers the transboundary aspects of the 2030 Agenda by assessing whether achieving each SDG target by one country could have a direct impact on another country or a global public good, as illustrated in Figure 1.7. These impacts include targeted policy actions (such as ODA spending, see Box 1.3), but also countries’ contributions to global public goods (such as the environmental assets covered by several Planet goals), and unintended spill-overs (such as pollution of shared bodies of water). The methodology and specific criteria used by this Study to identify transboundary indicators are discussed in Chapter 3 and in more detail in forthcoming working paper (Shinwell, fortcoming).
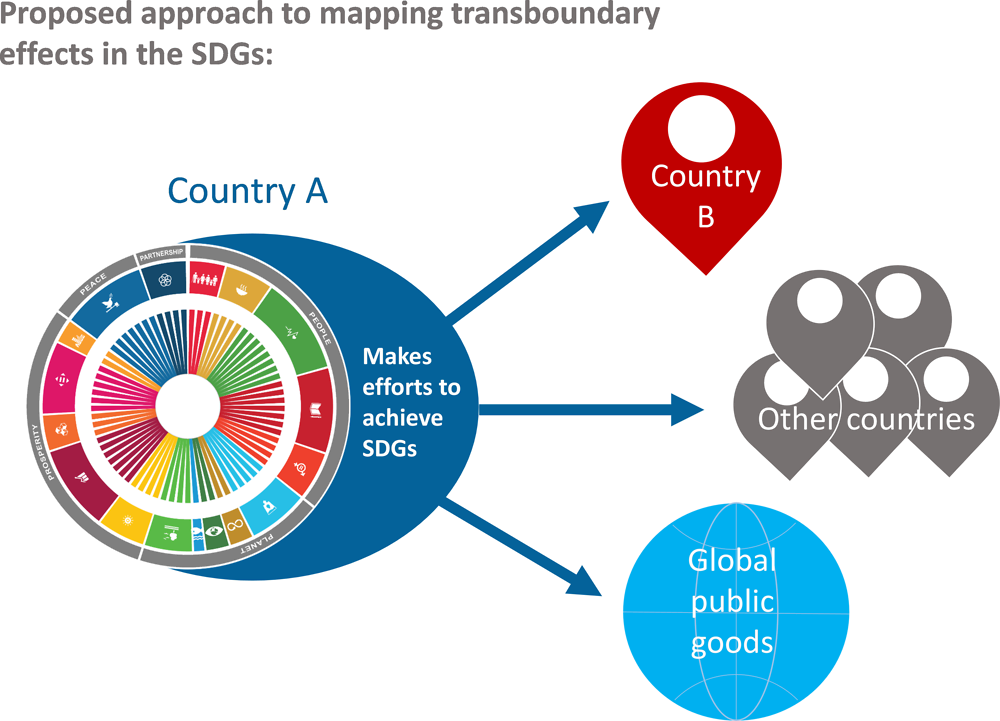
Note: The diagram describes how transboundary effects are defined for the purpose of this Study. SDG targets are identified as having a transboundary aspect if Country A’s actions to achieve the target could impact on another single country (B); other countries in general; and/or global public goods.
The analysis is based on two distinct steps. The first involves identifying SDG targets whose wording (in the 2030 Agenda) explicitly implies actions taken by a country that would have an impact “elsewhere”. The analysis finds that 97 targets can be described as having transboundary elements (57% of all 169 targets); 50 of these are “means of implementation” targets, most of which relate to financing and supporting developing countries in achieving the SDGs. Transboundary targets are heavily concentrated in the Planet goals, where they account for 76% of the total, and in the Implementation goal (95%).
The second step requires identifying, among the indicators included in the UN Global Indicator List for which data are available, those that pertain to these “transboundary targets”. Only 31 of the 97 transboundary targets are covered by 34 indicators used in this Study. However, 13 of these indicators refer to official development aid targeting specific sectors, for which no target (end value) can be established; one additional indicator cannot be assigned a normative direction (17.3.2, i.e. share of remittances of GDP), so that only for 20 indicators “distances to travel” can be assessed. Data gaps in measuring OECD countries’ performance for these transboundary targets are largest for the goals on Sustainable Production (12), Institutions (16) and Means of Implementation (17).
Figure 1.8 provides a mapping of targets between domestic and transboundary and, for the latter (97), a breakdown between targets measured by ODA indicators (14), targets measured by non-ODA indicators (17) and the large majority (66) for which no indicators are currently available.
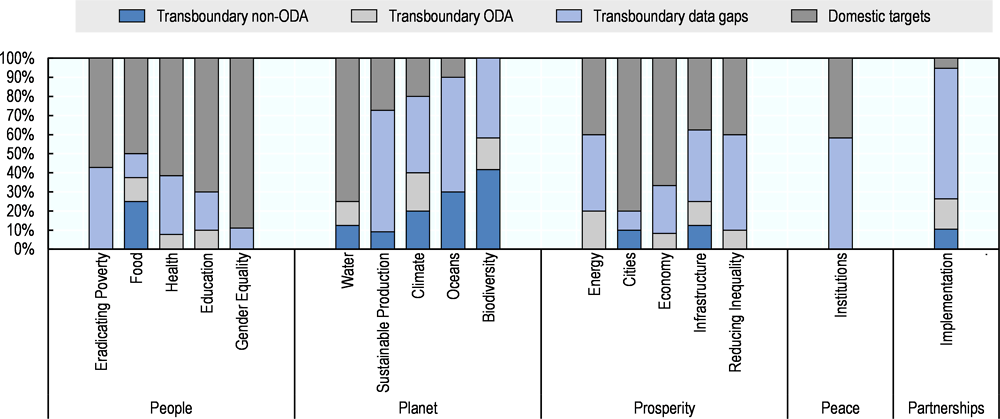
Note: “Transboundary non-ODA” are targets identified as transboundary which are not related to ODA funding, “Transboundary ODA” are targets identified as transboundary which are related to ODA funding, “Transboundary data gaps” are targets identified as transboundary for which there are no available data in this study, and “Domestic targets” are targets which are not identified as transboundary.
Source: Shinwell, forthcoming.
Figure 1.9 shows the distance to target for the 20 indicators for which targets levels to be achieved by 2030 could be defined; these refer to targets relating to Food (2), Energy (7), Infrastructure (9), Cities (11), Means of Implementation (17) and all goals relating to Planet. Figure 1.9 suggests that OECD countries have, on average, already achieved targets for the indicators relating to protected marine areas (14.5.1), forest as a proportion of total land area (15.1.1) and the intensity of forest use (15.2.1). Distances remain significant for the indicators on sustainable fishing (14.4.1), coverage of genetic information for animal breeds (2.5.1) and, to a lesser extent, CO2 emissions (9.4.1). These results should however be considered in the light of the data gaps described above, and of the level of ambition implicit in the target levels.
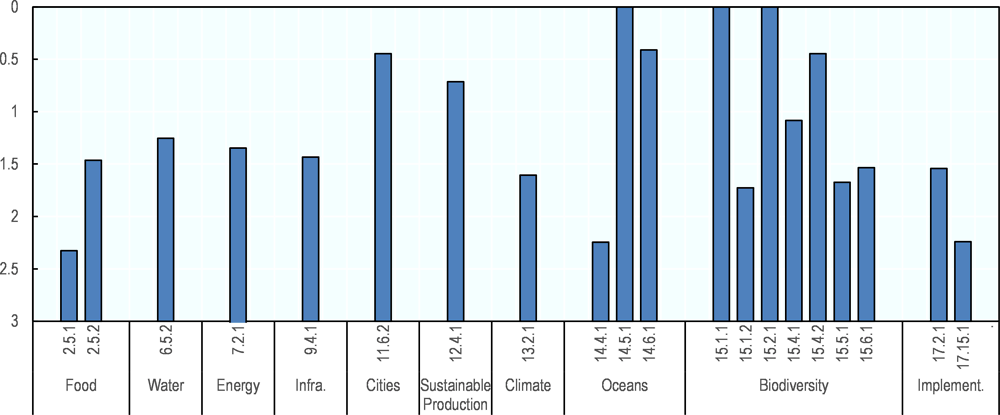
Note: This figure shows the average distance that OECD countries need to travel to reach transboundary targets at the indicator level, limited to those indicators (20) for which target levels to be achieved by 2030 could be set. Distances are measured in standardised distances (see Chapter 3 for details): 0 indicates that the 2030 level has already been attained; 3 is the largest distance (i.e. the one that most OECD countries have already travelled). Indicators are grouped by goals.
Source: See www.oecd.org/sdd/OECD-Measuring-Distance-to-SDGs-Targets-Metadata.pdf for detailed metadata.
The 2030 Agenda recognises the critical role of official development assistance (ODA) in supporting less developed countries to achieve the ambitions of the SDGs. At a global level, the achievement of the SDGs requires greater mobilisation of both public and private resources, from both domestic and international sources, as recognised by countries in the Addis Ababa Action Agenda (United Nations, 2015[32]). The goal on Means of Implementation (17) thus includes an explicit target (17.2) on the total value of ODA that donor countries should provide as a share of their gross national income (0.7% of GNI). OECD countries can hence be assessed in terms of how far away from this ODA target level they currently are.
In addition, however, the UN Global Indicator List also includes 13 measures of ODA in specific domains, spread over 11 goals. For example, under the Health goal, one target (3b) is about supporting research and development of vaccines and medicines in developing countries, monitored through an indicator (3.b.2) referring to total net ODA to medical research and basic health sectors. In these cases, no target level (end value) is specified in the 2030 Agenda, since this would require agreeing on what the desirable distribution of ODA across these sectors should be. Indeed, how ODA is distributed across sectors will generally vary from one donor country to another, as well as across recipient countries. In the absence of a fixed target level (end value), the measuring distance methodology of this Study could not be applied to these indicators, even if they are a core aspect of SDGs monitoring.
Figure 1.10 shows, in panel A, that ODA from countries that are members of the OECD Development Assistance Committee (DAC) – the leading international forum for bilateral providers of development co-operation – has hovered at around 0.3% of GNI over the past three decades, compared with a target of 0.7% first agreed in a UN resolution in 1970 (United Nations, 1970[33]). Panel B shows that, according to the UN Global Indicator List, most ODA goes to less developed countries and to small island developing states; measured under goal 10, and, when looking at distribution across sectors, to goals relating to Climate (goal 13, USD 31 billion), and Trade (goal 8, USD 28 billion). The UN Global Indicator List does not include ODA indicators relating to goals on Eradicating Poverty (1), Gender Equality (5), Cities (11), Sustainable Production (12), Oceans (14) and Institutions (16).
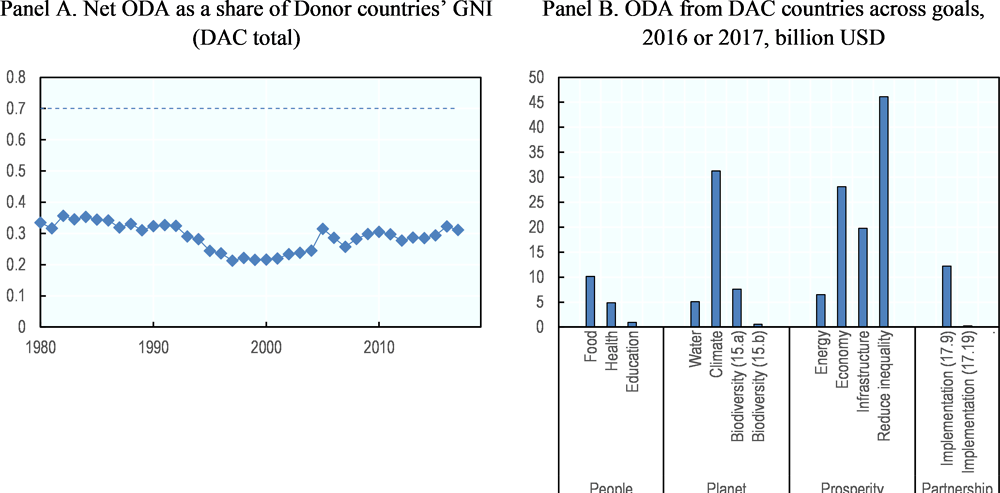
Note: Panel A shows (net) ODA as a share of donor countries’ GNI from 1980 to 2017. Panel B shows ODA by sectors in SDG goals.
Source: (OECD, 2017[34]), “Creditor Reporting System: Aid activities”, OECD International Development Statistics (database), https://doi.org/10.1787/data-00061-en.
1.4. Conclusion
This Study was prepared to help OECD countries navigate the complex data landscape of the SDGs, and to provide information about where they stand in relation to the targets and goals of the 2030 Agenda. The Study adheres as closely as possible to the UN Global Indicator List, and evaluates how far OECD countries are from reaching the SDG targets for which data are currently available. It thus provides a high-level overview of strengths and weaknesses across the individual targets of the 2030 Agenda, as well as across goals grouped under the 5Ps. The Study also clearly identifies the data gaps that should be filled in order to fully understand overall performance on SDGs.
Based on 132 available indicators, covering 105 targets, the Study shows that OECD countries, on average, still have significant distances to travel to meet many of the 2030 targets. On average, OECD countries are closest to reaching the 2030 targets for the goals pertaining to Cities, Climate and Energy, and perform well on goals pertaining to Oceans, Sustainable Production, and Biodiversity. By contrast, OECD countries’ performance lags on several targets in the fields of eradicating poverty, reducing inequality, non-medical determinants of health, and education. The largest data gaps affect targets under the Planet goals, casting a large degree of uncertainty on the overall results.
This chapter also presented new analyses of past trends, with a focus on whether OECD countries have been moving, since 2005, towards or away from the 2030 targets. Overall, on most of the indicators for which time-series are available, most OECD countries are either on a stable or improving path. The most notable exceptions pertain to goals pertaining to Food (obesity), Heath (vaccination coverage), Economy (GDP and productivity growth, as well as unemployment) and Biodiversity (conservation status of major species groups and extinction risks).
A first analysis of transboundary effects in the 2030 Agenda shows that achievement of 97 of the 169 targets could have impacts across borders, including financial transfers, policies with international repercussions, and unintended spill-overs. Most of these 97 targets relate to the Planet goals and to Means of Implementation. However, only 31 of the 97 transboundary targets are measurable using data available in this Study, and these limited data show that while some targets relating to oceans and biodiversity have been achieved, challenges still remain.
This edition of the Study covers OECD members only, and focuses on country average and OECD average results. While this Study presents an initial exploration of performance over time, deeper analysis of trends and forecasts could be considered for future work. Lastly, the Study will continue to provide a cornerstone for engagement with OECD countries in building their national strategic plans and monitoring systems to respond to the 2030 Agenda.
References
[25] Bureau fédéral du Plan (2016), Progrès vers les objectifs de développement durable de l’ONU - Bilan 2016, Task force développement durable, Working Paper No. 7-16, https://doi.org/plan.be/admin/uploaded/201606290703110.WP_1607_11277_F.pdf.
[18] European Commission (2016), Next steps for a sustainable European future European action for sustainability, https://ec.europa.eu/europeaid/sites/devco/files/communication-next-steps-sustainable-europe-20161122_en.pdf.
[19] Eurostat (2018), Sustainable development in the European Union — Monitoring report on progress towards the SDGs in an EU context, https://ec.europa.eu/eurostat/documents/3217494/9237449/KS-01-18-656-EN-N.pdf/2b2a096b-3bd6-4939-8ef3-11cfc14b9329.
[7] IAEG-SDGs (2019), Tier Classification for Global SDG Indicators, https://unstats.un.org/sdgs/files/Tier%20Classification%20of%20SDG%20Indicators_13%20February%202019_web.pdf.
[9] IAEG-SDGs (2018), Guidelines on Data Flows and Global Data Reporting for Sustainable Development Goals, https://unstats.un.org/unsd/statcom/49th-session/documents/BG-Item-3a-IAEG-SDGs-DataFlowsGuidelines-E.pdf.
[6] Kanbur, R., E. Patel and J. Stiglitz (2018), “Sustainable Development Goals and the measurement of economic and social progress”, in For Good Measure: Advancing Research on Well-being Metrics Beyond GDP, OECD Publishing, Paris, https://dx.doi.org/10.1787/9789264307278-4-en.
[13] Kharas, H. (2018), How Many People Will the World Leave Behind? Assessing current trajectories based on the Sustainable Development Goals, http://brookings.edu/wp-content/uploads/2018/09/HowManyLeftBehind.pdf (accessed on 10 December 2018).
[26] Marguerit, D., G. Cohen and C. Exton (2018), “Child well-being and the Sustainable Development Goals: How far are OECD countries from reaching the targets for children and young people?”, OECD Statistics Working Papers, No. 2018/05, OECD Publishing, Paris, https://dx.doi.org/10.1787/5e53b12f-en.
[21] OECD (2018), A Territorial Approach to the SDGs, http://oecd.org/cfe/territorial-approach-sdgs.htm (accessed on 2 January 2019).
[34] OECD (2017), “Creditor Reporting System: Aid activities”, OECD International Development Statistics (database), https://dx.doi.org/10.1787/data-00061-en.
[23] OECD (2017), Green Growth Indicators 2017, OECD Green Growth Studies, OECD Publishing, Paris, https://dx.doi.org/10.1787/9789264268586-en.
[1] OECD (2017), How’s Life? 2017: Measuring Well-being, OECD Publishing, Paris, https://dx.doi.org/10.1787/how_life-2017-en.
[4] OECD (2017), Measuring Distance to the SDG Targets 2017: An Assessment of Where OECD Countries Stand, OECD Publishing, Paris, https://dx.doi.org/10.1787/9789264308183-en.
[22] OECD (2016), Better Policies for 2030: An OECD Action Plan on the Sustainable Development Goals, http://oecd.org/dac/Better%20Policies%20for%202030.pdf (accessed on 24 November 2018).
[12] Sachs, J. et al. (2018), SDG Index and Dashboards Report 2018, Bertelsmann Stiftung and Sustainable Development Solutions Network (SDSN), http://sdgindex.org/assets/files/2018/01%20SDGS%20GLOBAL%20EDITION%20WEB%20V9%20180718.pdf.
[31] Slovenian Government (2017), Slovenian Development Strategy 2030, http://vlada.si/fileadmin/dokumenti/si/projekti/2017/srs2030/en/Slovenia_2030.pdf (accessed on 4 September 2018).
[24] Social Progress Imperative (2018), How the Social Progress Index can help achieve the Sustainable Development Goals, http://socialprogress.org/about-us/sdgs (accessed on 11 November 2018).
[30] Statistics Denmark (2017), Statistical follow-up on the 2030 Agenda - Denmark, http://dst.dk/-/media/Kontorer/01-Befolkning/SDG/Statistical-follow-up-on-the-2030-Agenda-Denmark-(3).pdf?la=en (accessed on 22 October 2018).
[29] Statistics Netherlands (2018), The SDGs: The situation for the Netherlands, http://cbs.nl/en-gb/publication/2018/10/the-sdgs-the-situation-for-the-netherlands.
[28] Statistics Netherlands (2017), Measuring the SDGs: An initial picture for the Netherlands, http://cbs.nl/en-gb/publication/2016/44/measuring-the-sdgs-an-initial-picture-for-the-netherlands (accessed on 15 October 2018).
[20] UN HABITAT (n.d.), City Prosperity Initiative: A platform to measure Urban SDGs, http://cpi.unhabitat.org/platform-measure-urban-sdgs-0 (accessed on 15 October 2018).
[10] UN Statistics Division (2018), United Nations Global SDG Database, United Nations Statistics Division, https://unstats.un.org/sdgs/indicators/database/ (accessed on 12 November 2018).
[5] UN-DESA (2018), The Sustainable Development Goals Report 2018, United Nations Department of Economic and Social Affairs, https://sustainabledevelopment.un.org/content/documents/21252030%20Agenda%20for%20Sustainable%20Development%20web.pdf.
[14] UNECA (2016), MDGs to Agenda 2063/SDGs Transition Report 2016, http://uneca.org/sites/default/files/PublicationFiles/mdg-sdg-report-2016_en_revfeb2017.pdf.
[17] UNECE (2017), Conference of European Statisticians’ Road Map on Statistics for Sustainable Development Goals, http://unece.org/fileadmin/DAM/stats/documents/ece/ces/2017/CES_Road_Map_for_SDGs_First_Edition_final.pdf.
[15] UNECLAC (2018), Second annual report on regional progress and challenges in relation to the 2030 Agenda for Sustainable Development in Latin America and the Caribbean, https://repositorio.cepal.org/bitstream/handle/11362/43439/5/S1800379_en.pdf.
[8] UN-ECOSOC (2019), Report of the Inter-Agency and Expert Group on Sustainable Development Goal Indicators, United Nations Economic and Social Council, https://unstats.un.org/unsd/statcom/50th-session/documents/2019-2-IAEG-SDG-EE.pdf (accessed on 10 December 2018).
[11] UN-ECOSOC (2018), Progress towards the Sustainable Development Goals: Report of the Secretary-General, United Nations Economic and Social Council, https://sustainabledevelopment.un.org/content/documents/18541SG_SDG_Progress_Report_2018_ECOSOC.pdf (accessed on 8 December 2018).
[16] UNESCAP (2018), Asia and the Pacific SDG Progress Report 2017, http://unescap.org/sites/default/files/Asia-Pacific-SDG-Progress-Report-2017.pdf.
[2] United Nations (2019), Sustainable Development Goals Communication Materials, http://un.org/sustainabledevelopment/news/communications-material/ (accessed on 10 April 2019).
[3] United Nations (2017), Global indicator framework for the Sustainable Development Goals and targets of the 2030 Agenda for Sustainable Development, United Nations, https://unstats.un.org/sdgs/indicators/Global%20Indicator%20Framework%20after%20refinement_Eng.pdf.
[32] United Nations (2015), Addis Ababa Action Agenda of the Third International Conference on Finance for Development, United Nations, https://sustainabledevelopment.un.org/content/documents/2051AAAA_Outcome.pdf.
[33] United Nations (1970), Resolution 2626 (XXV), International Development Strategy for the Second United Nations Development Decade, United Nations General Assembly, http://un-documents.net/a25r2626.htm.
[27] United Nations (n.d.), Voluntary National Reviews Database, UN Sustainable Development Knowledge Platform, https://sustainabledevelopment.un.org/vnrs/.
Notes
← 1. See www.oecd.org/sdd/OECD-Measuring-Distance-to-SDGs-Targets-Metadata.pdf for detailed metadata.
← 2. The IAEG-SDGs consists of 27 representatives of National Statistical Offices and the Chair of the UN Statistical Commission and includes regional and international agencies as observers.
← 3. Some of the indicators included in the list pertain to more than one target. Overall, the list includes 232 unique indicators, and a total of 244 indicators covering all 169 targets.
← 4. Based on the UN Global Database (UN Statistics Division, 2018[10]).
← 5. This means that, in some cases, the indicators and target levels adopted in this Study may differ from the approaches used by national governments in their own SDG monitoring, where the level of ambition and selection of indicators can be tailored to the context and ambition of each country.
← 6. As detailed in section 3.2, the Study uses data from OECD databases that are comparable with the UN Global Indicator List definitions when they provide better coverage and precision than the data in the UN Global Database.
← 7. In a standard z-score normalisation, distance is expressed as the number of standard deviations away from the mean score.
← 8. This analysis, while going beyond the scope of this Study update, could be explored in future editions and with interested countries.