9.1. Global value chains
The digital transformation affects all industries – including both manufacturing and services – albeit at different speeds and scales. The extent to which digital-intensive industries are integrated into global value chains (GVCs) can be measured by tracking the origins of value added embodied in final demand. Estimates of foreign value added in domestic demand highlight the importance of production activities abroad in producing final goods and services for domestic consumers, both directly (through imports of final goods and services for consumption) and indirectly (as a component of domestic output consumed locally).
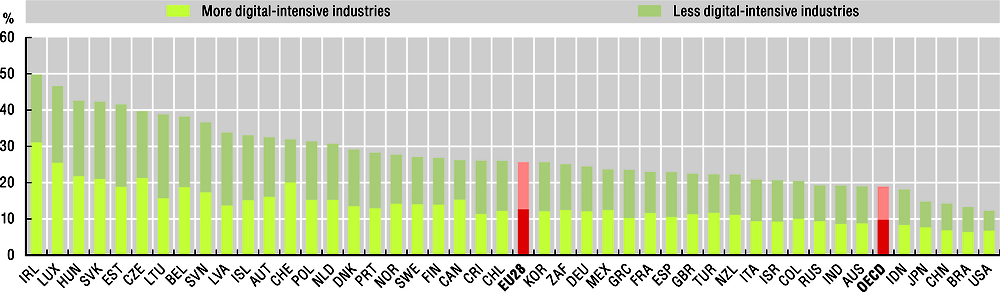
While digital-intensive industries account for about 44% of global production, on average in the OECD, they are the origin of half of the foreign value added needed to satisfy domestic demand. There is some variation across countries, with shares of over 60% in Ireland and Switzerland (representing 31% and 20% of total final demand, respectively), while in Latvia and Lithuania only 40% of foreign value added in final demand comes from more digital-intensive sectors.
Large economies such as Brazil, China, Japan and the United States, have much lower shares of foreign value added in domestic final demand, as they have a greater internal capacity to produce final goods and services (and the necessary intermediate products) to meet domestic demand. However, while the United States has the lowest share of foreign value added in domestic demand of OECD countries (12%), the sheer size of its economy means that in USD terms it is by far the biggest consumer of foreign value added: 2.2 USD trillion, of which, 1.2 USD trillion (55%) comes from more digital-intensive industries.
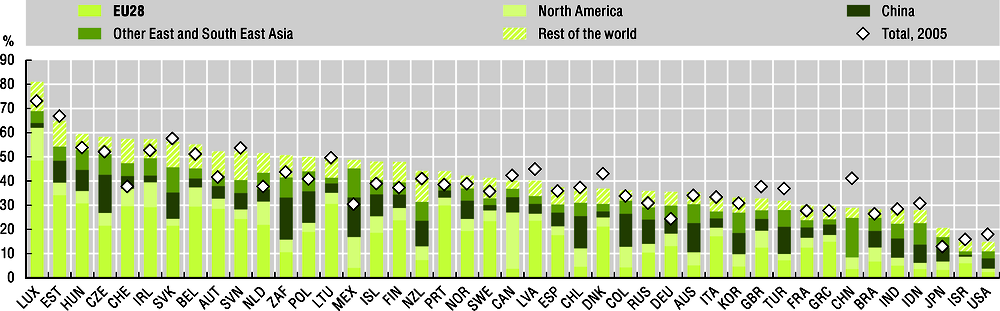
In the specific case of information industries, on average in 2015, 45% of the value of information industry products produced worldwide consisted of foreign value added (compared to 39% in total manufactures and business services). This value ranged from more than 80% in Luxembourg and 60% in Estonia to less than 20% in Israel and the United States. Regional interdependence is clear, especially in EU countries, for which other members are a key source of demand for information industries’ products.
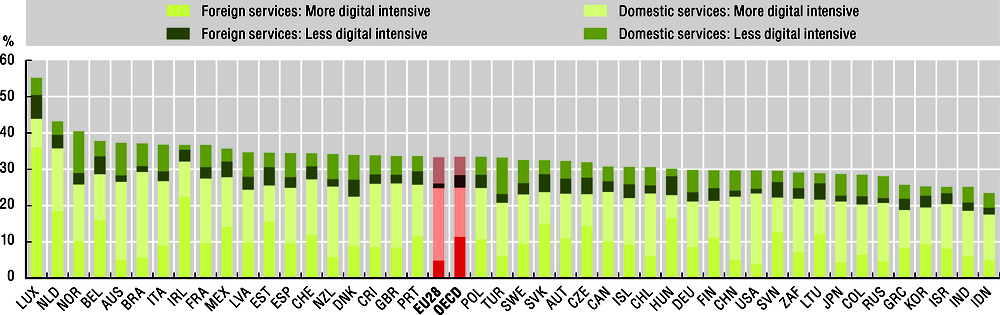
The production of manufactured goods relies on a range of intermediate service inputs, from wholesale and transport to IT, finance and other professional business services. This is reflected in the service content of manufactured exports which, on average, accounted for one-third of the value of manufactured exports in OECD countries in 2015. Of this, 75% came from digital-intensive services activities (both domestic and foreign). In other words, on average, 25% of the value of manufactured exports comes from digital-intensive services industries such as ICT and financial services. For some countries, notably Ireland, Luxembourg and the Netherlands, this share exceeds 30%, while for most large countries the shares range from 18% to 23%.
Digital-intensive services are critical for manufacturing exports. On average, 25% of the value of manufactured exports from OECD countries is value added from digital-intensive services.
Definitions
Value added consists of the value of production, net of the costs of intermediate inputs. In practice, it includes both gross profits and wages, and at an aggregate level is equivalent to GDP.
Sector digital intensity is based on a number of dimensions: ICT investment, use of ICT intermediates, use of robots, online sales and employment of ICT specialists. Industries are then classified into quartiles from most to least digital-intensive. Here the quartiles are summarised as more digital-intensive sectors (upper two quartiles) and less digital–intensive sectors (lower two quartiles). Examples of the former include ICT equipment, transport equipment, ICT services, finance, R&D, marketing, publishing, audiovisual and broadcasting services, public administration and defence, arts and entertainment services. See page 2.9 for more information.
Measurability
The Trade in Value Added (TiVA) database provides indicators on the domestic and foreign origins of value added embodied in exports and in final demand. They are derived from the OECD Inter-Country Input-Output (ICIO) database which estimates the flows of goods and services between 64 countries and 36 industries from 2005 to 2015. Tracing global flows of value added provides insights for the analysis of GVCs that are not always evident from trade statistics.
Estimates of foreign value added content in exports or in final demand are often referred to as “backward linkages” in GVCs, while domestic value added content in partner countries’ exports (or foreign final demand) are referred to as “forward linkages”. Both are used to provide an indication of GVC participation and, given the different perspectives, are best analysed separately. Changes in participation in GVCs not only reflect changes in specialisation towards activities at the beginning or end of value chains, but can also reflect fluctuations in commodity prices. For example, a surge in crude oil prices could result in an increase in import content for many countries. The TiVA indicators become volatile if oil intensive products are traded along multi-country production chains. Thus, care should be taken when interpreting measures of GVC participation over time.
Source: OECD, Trade in Value Added (TiVA) Database, https://oe.cd/tiva, December 2018. See 1. StatLink contains more data.
← 1. Digital intensity is defined according to the taxonomy described in: Calvino et al. (2018).
More digital-intensive industries = Medium-high and high digital-intensive industries.
Less digital-intensive industries = Medium-low and low digital-intensive industries.
EU28 and OECD represent weighted averages of countries’ foreign value added in domestic demand, with intra-regional value added flows between countries considered as foreign value added flows.
Source: OECD, Trade in Value Added (TiVA) Database, https://oe.cd/tiva, December 2018. See 1. StatLink contains more data.
← 1. Information industries cover the following ISIC Rev.4 Divisions: Manufacture of computer, electronic and optical products (26); Publishing, audio-visual and broadcasting activities (58 to 60); Telecommunications (61) and IT and other information services (62 to 63).
North America comprises Canada, Mexico and the United States; Other East and South East Asia consists of Brunei Darussalam, Hong Kong, Indonesia, Japan, Cambodia, Korea, Malaysia, Philippines, Singapore, Thailand, Chinese Taipei and Viet Nam.
Source: OECD, Trade in Value Added (TiVA) Database, https://oe.cd/tiva, December 2018. See 1. StatLink contains more data.
← 1. Digital intensity is defined according to the taxonomy described in Calvino et al. (2018).
More digital-intensive industries = Medium-high and high digital-intensive industries.
Less digital-intensive industries = Medium-low and low digital-intensive industries.
Services are defined according to ISIC Rev.4 Divisions 41 to 98 (i.e. including construction).
EU28 is treated as a single economy (i.e. exports to non-EU countries only and intra-EU value added flows are treated as domestic flows, so that foreign value added is non-EU value added content in EU exports).