
5. The economics of overweight in Brazil
Overweight is a growing public health challenge in Brazil, with over half of the population overweight in 2016. Brazilians have unhealthier food consumption habits than OECD countries, while the prevalence of insufficient physical activity has increased more rapidly in Brazil than elsewhere over the past decades. Brazil has started to address the issue of overweight in a number of policies and interventions, including a food labelling scheme and school-based policies such as the Programa Saúde na Escola. While these are valuable strategies, Brazil could aim for a more ambitious multi-sectoral and comprehensive response. Brazil should better influence lifestyles through information and education programmes such as introducing menu labelling in restaurants, mass media campaigns, and promoting prescription of physical activity by family health teams. Brazil should also pursue food reformulation more actively, developing workplace or transport policies, while regulating food and beverage advertising particularly for children.
Being overweight, including pre-obesity and obesity, is a major risk factor for various chronic non-communicable diseases including diabetes, cardiovascular diseases and certain cancers. The risks associated with obesity were made worse by the COVID-19 pandemic, given that obesity is a recognised risk factor for severe COVID-19 illness.
High consumption of calories-dense food and increasingly sedentary lifestyles have contributed to growing global obesity rates. Similarly, childhood overweight rates have been growing worldwide. Environmental factors, lifestyle preferences, genetic makeup and culture all can cause children to be overweight. Obese children are at greater risk of developing hypertension and metabolic disorders and, psychologically, obesity can lead to poor self-esteem, eating disorders and depression. Further, obesity may act as a barrier for participating in educational and recreational activities.
In this chapter, we explore the current epidemiological landscape of overweight in Brazil in comparison with OECD countries, along with its impact over the health system and the economy. Then, we review the main policies that Brazil has put in place, from population-level initiatives to individual interventions within the health system and other sectors. Subsequently, the chapter outlines a policy framework for overweight control and makes a number of recommendations to be considered in future reforms in Brazil. It finalises by providing evidence about the impact of implementing such policies over population health, the health system and the economy, while discussing some implementation considerations.
5.2.1. Overweight in Brazil is currently below OECD average but the trend is increasingly upwards
In 2016, estimations show that 56.5% of adults in Brazil were overweight, close to the OECD average of 58.4%. However, Brazil showed the fourth largest change in overweight between 2006 and 2016 with an increase of 12.5%, only behind Costa Rica, Japan and Korea, but the latter two countries have substantially lower overweight rates (Figure 5.1).

Note: Overweight considers adults with pre-obesity (BMI 25-30 kg/m2) and obesity (BMI >30 kg/m2).
Source: WHO Global Health Observatory (2020[1]), https://www.who.int/data/gho/data/themes/topics/topic-details/GHO/ncd-risk-factors.
More recently, the National Health Survey 2019 (Pesquisa Nacional de Saúde, PNS) found that 61.7% of the adult Brazilian population was overweight, of which 25.9% were obese. Overweight population was 43.3% in PNS 2002/2003, signalling an increase of 42% in 16 years. Overweight in 2019 reached 60% of adult men and 63.3% of adult women, with 22.8% and 30.2% of obesity, respectively (IBGE, 2020[2]).
Children overweight rates in Brazil and OECD countries tend to be considerably lower compared to rates in adults. In 2016, Brazil had a children overweight rate of 28%, very close to the 28.5% in average amongst OECD countries. Nevertheless, Brazil experienced an increase of 27% between 2006 and 2016, higher than the 15% increase in the OECD. The largest increases were observed in the Slovak Republic, Slovenia and Poland, above 40% (Figure 5.2).

Note: Children between 5-19 years of age.
Source: WHO Global Health Observatory (2020[1]), https://www.who.int/data/gho/data/themes/topics/topic-details/GHO/ncd-risk-factors.
According to PNS 2019, the percentage of overweight adolescents between 15 and 17 years of age was 19.4%. The prevalence was higher among female adolescents (22.9%) than male (16%). Regarding obesity, the percentage was 6.7%, being 8% for females and 5.4% for males (IBGE, 2020[2]).
5.2.2. Dietary and lifestyle habits in Brazil are in worst shape than in OECD countries
Diet and healthy lifestyle are key determinants that contributes to the overall health and well-being, including the development of overweight. In the field of food consumption, individuals who follow a diet rich in fruits and vegetables and low in fat, sugars and salt/sodium are at a lesser risk of developing overweight, one or more cardiovascular diseases and certain types of cancer (Graf and Cecchini, 2017[3]).
In 2018, daily consumption of fruit and vegetables in Brazil was estimated to be under the recommended 400 grammes per person per day, the same as in most OECD countries. Brazilians consumed 85 grammes of fruit per day, lower than the average 115 grammes in OECD countries. Similarly, Brazilians consume 93 grammes of vegetables per person per day, again lower than the OECD average of 137 grammes (Figure 5.3).
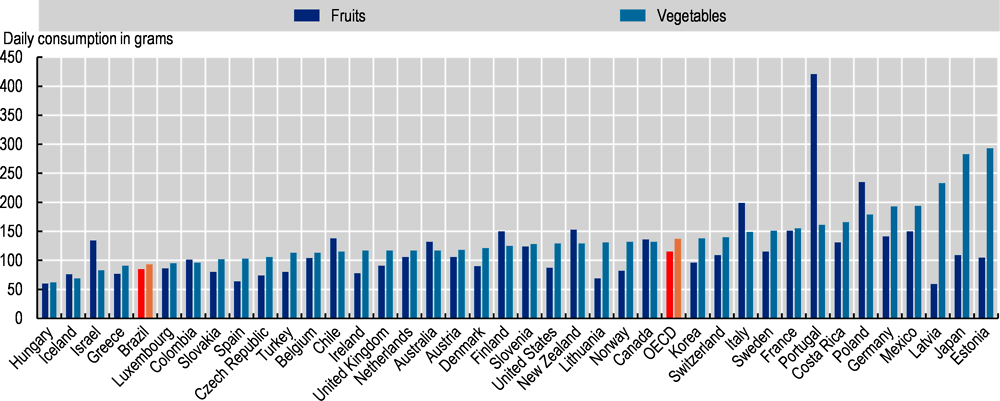
Source: Global Dietary Database, 2018.
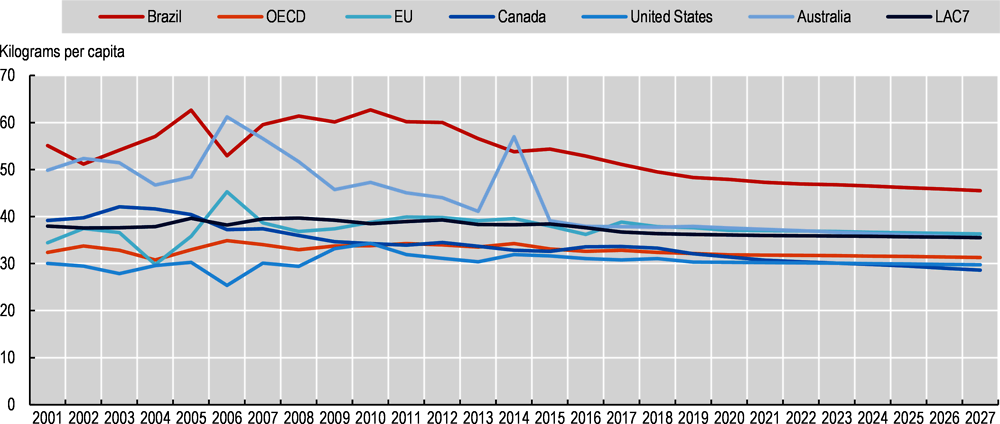
Excessive free sugar consumption is considered a risk factor for overweight (Bray and Popkin, 2014[4]) and its consumption is already high in OECD countries, expecting to grow further in the future. Consumption of sugar through sugary foods, such as grain-based desserts (cakes, cookies, pies) and sodas is very high in Brazil, much higher than in other OECD countries (Figure 5.4).
Regular physical activity, and even light-intensity physical activity, has a number of health benefits, including the prevention of NCDs (such as cardiovascular disease, diabetes, and cancer), hypertension, obesity, depression, and premature mortality (OECD, 2019[5]). Despite these health benefits, in 2016, the prevalence of insufficient physical activity in Brazil was higher than in any OECD country, reaching 47% of the population, while the OECD average stands at 32.8%. As in almost all OECD countries (except for Finland), rates of insufficient physical activity are higher among women compared to men in Brazil. The disparity in Brazil is of almost 13 percentage points, higher than the 7 percentage points in the OECD, and only lower than in Turkey, Costa Rica and the United States (Figure 5.5).
An analysis of trends in physical activity levels between 2001 and 2016 found that insufficient physical activity, defined as not meeting the physical activity recommendations as set out by WHO, increased by more than 15% in Brazil, the largest increase among all the 65 countries with information (Guthold et al., 2018[6]), signalling a substantial public health problem for Brazil.
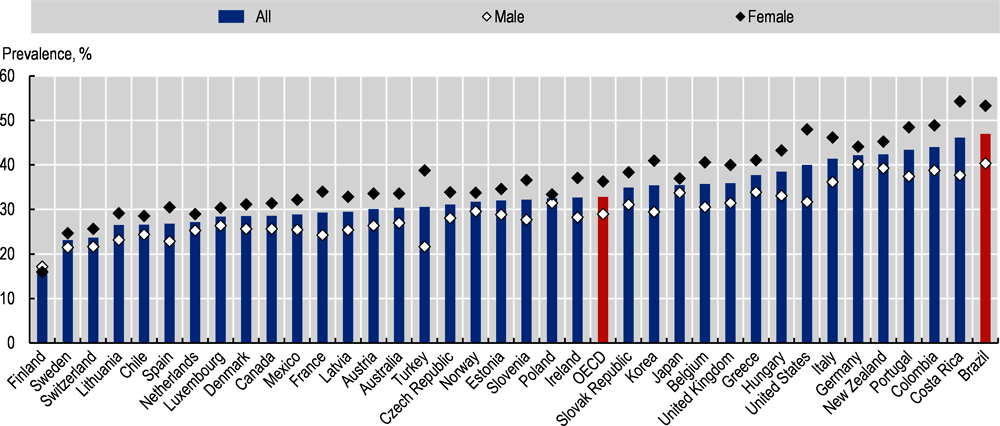
Note: Data unavailable for Iceland and Israel. Data is age-standardised.
Source: WHO Global Health Observatory (2020[1]), https://www.who.int/data/gho/data/themes/topics/topic-details/GHO/ncd-risk-factors.
5.2.3. Overweight seriously damages Brazil’s health and has an adverse economic impact
The annual number of premature deaths that overweight will cause between 2020 and 2050 in Brazil will be high. Around 83 deaths per 100 000 people will occur every year due to overweight, which is well above the OECD average of 61 (Figure 5.6). Premature mortality is lower in countries where the overweight prevalence is low and life expectancy is high, such as Japan and Korea.
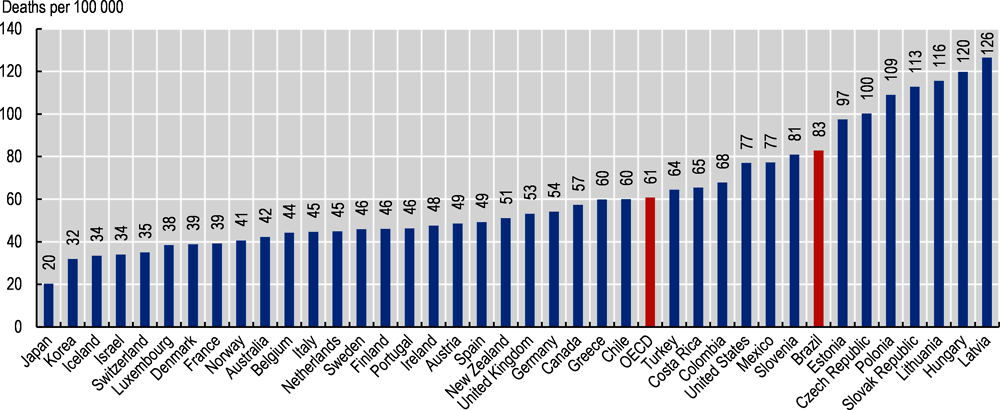
Note: Premature mortality is defined as mortality of people aged 30 to under 70.
Source: OECD (2019[5]), The Heavy Burden of Obesity: The Economics of Prevention, https://dx.doi.org/10.1787/67450d67-en.
The impact of overweight on premature mortality translates into a decrease in overall life expectancy. On average over the 2020-50 period, life expectancy in Brazil is expected to be lower by 3.3 years due to overweight, a higher reduction than the 2.7 years amongst OECD countries (Figure 5.7). Countries with low overweight prevalence will see a smaller impact on life expectancy. Healthy life expectancy – which uses disease disability weights to calculate the number of years lived in perfect health – will be reduced even further, by 3.7 years, again higher than the 3.2 on average in OECD countries.

Note: Decreases in life expectancy are the average across the total population.
Source: OECD (2019[5]), The Heavy Burden of Obesity: The Economics of Prevention, https://dx.doi.org/10.1787/67450d67-en.
On a health financing perspective, since overweight is a major risk factor for several NCDs, on average people with overweight require health care services more often and for more complicated issues. As a result, the per capita health expenditure in the business-as-usual scenario is higher than in the no-overweight scenario. In Brazil, the annual average health expenditure between 2020-50 is projected to be of USD 94.40 per capita, lower than the OECD average of USD 209.50, which can be explained by the magnitude of health expenditure in each country. More importantly, Brazil will require devoting 8.7% of its total health expenditure to overweight, higher than the OECD average of 8.4%, showing that its impact in Brazil’s health financing system will be large (Figure 5.8).
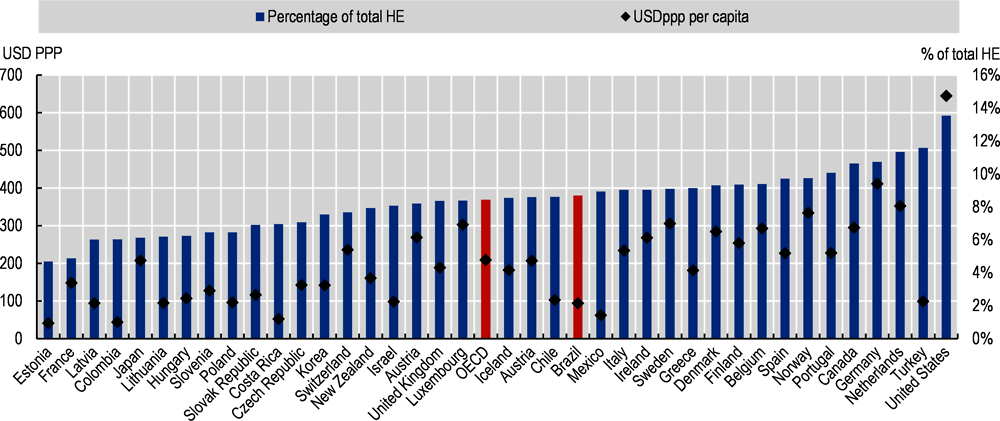
Source: OECD (2019[5]), The Heavy Burden of Obesity: The Economics of Prevention, https://dx.doi.org/10.1787/67450d67-en.
On average in Brazil, GDP will be 5% lower due to the impact of overweight over the next 30 years. This is larger than in all OECD countries, except Mexico. The GDP impact in OECD countries will be of -3.3% on average between 2020 and 2050. Importantly, these results do not take into account that an increase in life expectancy due to no overweight may mean that people will work for longer and retire later. If the retirement age is increased by two-thirds of a year for every year of additional life expectancy, the impact of overweight on GDP would be doubled, with the average going from 5% to 8.2% in Brazil and from 3.3% to 6.8% in the OECD (see Annex 3.A in OECD (2019[5]).
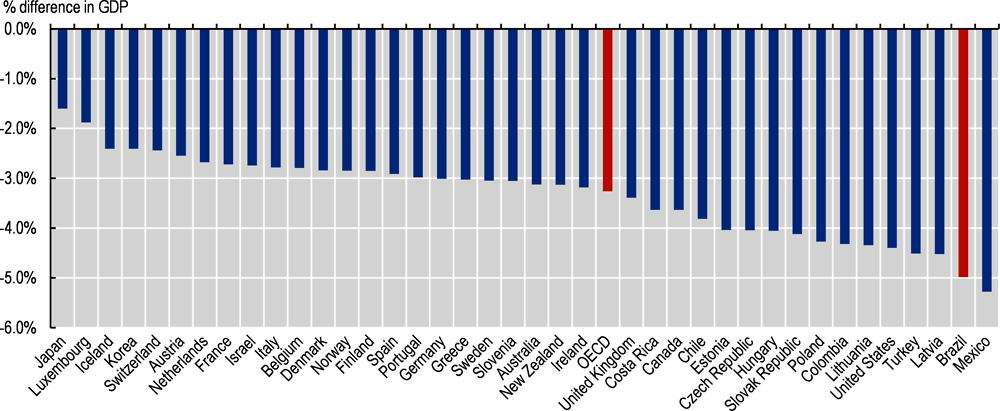
Source: OECD (2019[5]), The Heavy Burden of Obesity: The Economics of Prevention, https://dx.doi.org/10.1787/67450d67-en.
Wages will be also affected in Brazil due to overweight increase. On average, OECD countries will lose USD PPP 863 per capita per year in labour market output due to overweight, while Brazil will lose USD PPP 212 (Figure 5.10). Presenteeism has the greatest economic impact on the labour market, and accounts for nearly half of the lost output in both Brazil and the OECD. Absenteeism and employment rate account for roughly a quarter each.

Source: OECD (2019[5]), The Heavy Burden of Obesity: The Economics of Prevention, https://dx.doi.org/10.1787/67450d67-en.
OECD member countries have implemented a suite of regulatory and non-regulatory initiatives to reduce overweight population rates. Prominent examples include mass media campaigns to promote the benefits of healthy eating; promotion of nutritional education and skills; ‘sin’ taxes on energy-dense food and drink items to discourage consumption; food labelling to communicate nutritional value; and agreements with the food industry to improve the nutritional value of products. Policymakers are also exploring initiatives that address the social determinants of being overweight. Despite these efforts, the overweight epidemic has not been reversed, highlighting the issue’s complexity.
5.3.1. National strategies address overweight as one of the main public health issues in the country
Food was recognised as a right in the Brazilian Constitution in 2010 and as one of the determinants of the population’s health in the law that created SUS. In this line, SUS national directives are responsible for “formulating, evaluating and supporting food and nutrition policies”. The actions of food and nutrition in SUS were institutionalised from the publication of the National Policy on Food and Nutrition (Política Nacional de Alimentação e Nutrição, PNAN) in 1999. In addition, the Intersectoral Strategy for Obesity Prevention and Control (Estratégia Intersetorial de Prevenção e Controle da Obesidade, EIPCO) in 2014 constitutes an important part of the national agendas for overweight control (Bortolini et al., 2020[7]; Pinheiro et al., 2019[8]) (see Box 5.1).
National Policy on Food and Nutrition, PNAN 2011
The National Policy on Food and Nutrition (Política Nacional de Alimentação e Nutrição, PNAN), approved in 1999, integrates Brazil’s efforts to respect, protect, promote and provide human rights to health and food. In partnership with the National Health Council’s Intersectoral Commission on Food and Nutrition (Comissão Intersetorial de Alimentação e Nutrição, CIAN), the Ministry of Health conducted a broad and participative process to update and improve PNAN. In its new edition, finalised in 2011, PNAN aims to improve the conditions of food, nutrition and health of the Brazilian population, through the promotion of appropriate and healthy eating practices, food and nutrition surveillance, prevention and comprehensive care of diseases related to food and nutrition (Ministério da Saúde, 2013[9]).
Intersectoral Strategy for Obesity Prevention and Control, EIPCO 2014
The National Food and Nutrition Security System (Sistema Nacional de Segurança Alimentar e Nutricional, SISAN) takes part in obesity prevention and control actions in Brazil, being instituted in 2006 aiming to guarantee the human right to adequate food and formalising the government’s responsibility. In this context, the Inter-ministerial Chamber of Food and Nutritional Security (Câmara Intersetorial de Segurança Alimentar e Nutricional, CAISAN), also part of the SISAN, co-ordinated the development of the Intersectoral Strategy for Obesity Prevention and Control (Estratégia Intersetorial de Prevenção e Controle da Obesidade, EIPCO) in 2014 (CAISAN, 2014[10]). The EIPCO includes actions to be implemented across 19 governmental sectors responsible for agricultural, educational, health, labour, environmental and international relations policies, among others.
5.3.2. Brazil recently took a significant step forward approving a new front-of-package food labelling policy
Food labels on pre-packaged foods aim to inform consumers about the nutritional value of foods. They can include “informative” labels containing a list of nutrients, usually put on the back, or clearly visible “interpretive” labels providing nutritional information in a more easy-to-understand format, usually put on the front. In addition, front-of-pack (FoP) labels may aim to warn about nutriments that should be consumed in limitation or avoided altogether, e.g. salt, sugar, saturated fats content, or highlight positive aspects such as dietary fibre content (OECD, 2019[5]).
Currently enforced, Brazil has a mandatory back-of-pack nutrition label, applied to packaged food, with the exception of water, alcoholic beverages, salt, vinegar, vegetables and meat in natural forms, spices, coffee, tea, herbs, food additives, technology adjuvants, restaurant food and small packaging (100 cm2) without nutritional claims. It mandates to report on energy value, carbohydrates, dietary fibres, protein, total fat, saturated fat, trans fat, sodium and nutrients targeted in nutrition claims (ANVISA, 2019[11]).
On October 2020, after a process initiated in 2014, ANVISA approved a new mandatory front-of-package label regulation of packaged food in Brazil, which will be enforced 24 months after its publication. The new rules aim to facilitate the understanding of nutritional information and lead consumers to make more conscious food intake decisions. This goes in line with what other OECD countries have done, such as Chile, Finland, Israel and Mexico (Figure 5.11). Box 5.2 summarises the content of the new regulation in Brazil.

Notes: OECD countries in dark blue. * Canadian legislation on mandatory labelling has been proposed but not yet implemented; ** Mandatory FoP label to come into force in 2022.
Source: OECD (2019[5]), The Heavy Burden of Obesity: The Economics of Prevention, https://dx.doi.org/10.1787/67450d67-en and ANVISA (2020[12]), “Anvisa aprova norma sobre rotulagem nutricional”, https://www.gov.br/anvisa/pt-br/assuntos/noticias-anvisa/2020/aprovada-norma-sobre-rotulagem-nutricional.
The Resolution of ANVISA’s Collegiate Board 429 (Diário Oficial da União, 2020[13]) and Normative Instruction 75 (Diário Oficial da União, 2020[14]) published on 9 October 2020, in the Brazilian Official Gazette establishes significant changes about the information that must be displayed to consumers. Under the new regulation, the nutritional labelling must be placed on the front panel of packaged foods using simple and clear icons to emphasise high contents of saturated fat, added sugar and sodium (Figure 5.12). The new model does not include warnings for non-caloric sweeteners.
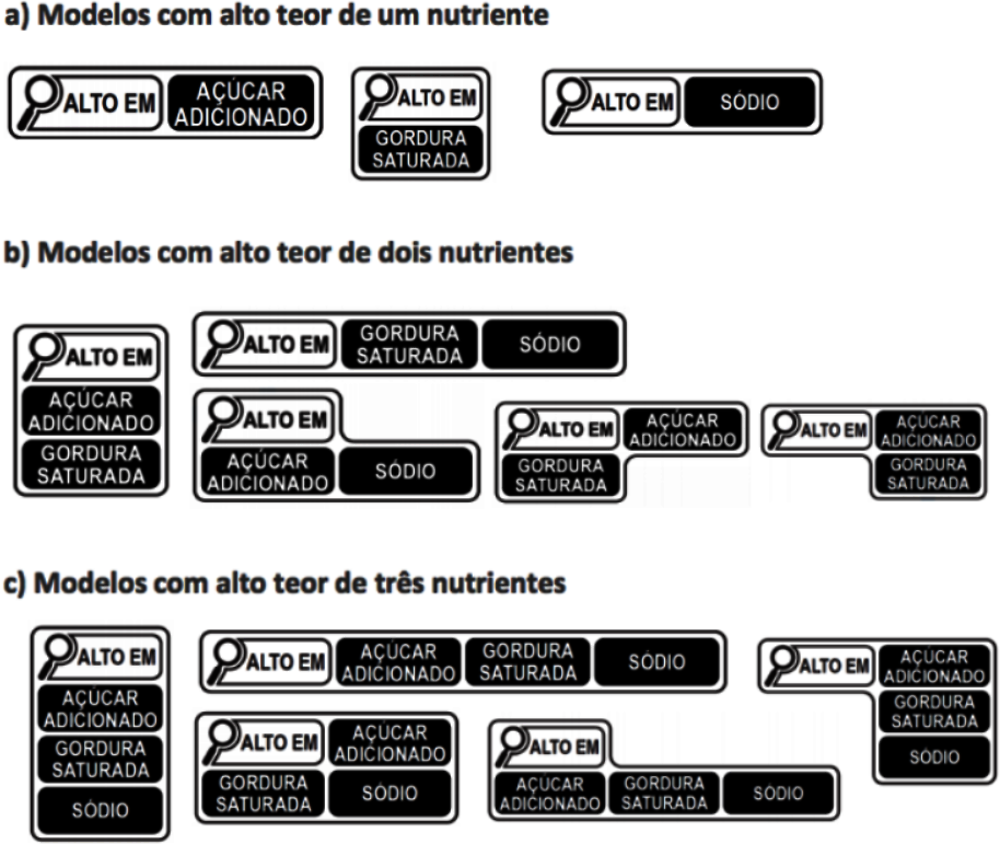
Note: a) Models for high content of one nutrient; b) Models for high content of two nutrients; c) Models for high content of three nutrients. Nutrients: saturated fat, added sugar and sodium.
Source: ANVISA (2020[12]), “Anvisa aprova norma sobre rotulagem nutricional”, https://www.gov.br/anvisa/pt-br/assuntos/noticias-anvisa/2020/aprovada-norma-sobre-rotulagem-nutricional, USDA (2020[15]), “Brazil Approves New Regulations for Food Labeling”.
5.3.3. School-based policies are well-advanced in Brazil
Children in early stages of their lives are only just beginning to develop critical thinking skills and learning to exercise self-control, which makes them particularly vulnerable to outside influences. They share their parents’ diet and acquire exercise-related habits from them. School may affect the food options surrounding children as well. Their choices are also influenced by the broader environment, for example, some communities may provide accessible alternatives to exercise or buy healthy food, while others may be described as “food deserts” or “food swamps” (Saunders, Saunders and Middleton, 2015[16]).
Regarding interventions designed to encourage healthy lifestyles among children, a meta-analysis of studies combining intensive classroom physical activity lessons led by trained teachers, moderate-to-vigorous physical activity sessions, distribution of nutritional education materials and provision of healthful foods, found that such interventions can reduce BMI by an average of 0.3 kg/m2 (Wang et al., 2015[17]). In addition, other reviews found stronger evidence for school-based programmes including the involvement of other family members or a community, compared to the purely school-based ones (Verjans-Janssen et al., 2018[18]; Bleich et al., 2018[19]) .
Some concrete examples of such policies include the EU School Fruit, Vegetables and Milk Scheme (European Commission, 2020[20]), the Co-ordinated Approach to Child Health in the United States (CATCH, 2021[21]), Crunch&Sip® in Australia (Crunch&Sip®, 2021[22]), the “Kids to kids” programme in Slovenia, and the “Contrapeso” programme in Chile (OECD, 2019[23]). Having such programmes entails that countries have school-based nutrition standards, either voluntary or mandatory (see Figure 5.13). Brazil has such nutrition standards, reflected in programmes such as the Health at School Programme (Programa Saúde na Escola, PSE) and the National School Meals Programme (Programa Nacional de Alimentação Escolar, PNAE) (see Box 5.3).

Note: OECD countries in dark blue.
Source: OECD (2019[5]), The Heavy Burden of Obesity: The Economics of Prevention, https://dx.doi.org/10.1787/67450d67-en.
Programa Saúde na Escola
The Health at School Programme (Programa Saúde na Escola, PSE), an intersectoral policy of the health and education sectors, was established in 2007 by the Presidential Decree No. 6.286. The programme aims to provide comprehensive care (promotion, prevention and care) to protect the health of children, adolescents and youth in public schools. The PSE is delivered in partnership with primary health care units bringing together the Family Health Teams and education professionals. Municipalities can adhere by agreeing on commitments every two years. The target audience of PSE are students from all public day care centres and those associated with municipalities, all rural schools, schools with students under socio-educational measures, and schools that have at least 50% of enrolled students belonging to families benefiting from the Bolsa Família Programme. (Ministério da Saúde, 2021[24]).
Programa Nacional de Alimentação Escolar
The National School Meals Programme (Programa Nacional de Alimentação Escolar, PNAE) provides schools with meals and food and nutrition education for students at all stages of public basic education. The federal government transfers to states, municipalities and federal schools supplementary financial amounts made in 10 monthly instalments (from February to November) to cover 200 school days, according to the number of students enrolled in each education network. The PNAE covers students of all basic education (pre-school, primary, secondary and youth and adult education) enrolled in state schools, philanthropic organisations and community organisations (with public authority agreements). Importantly, the school menu is defined by each municipality, but it should be prepared by a nutritionist, respecting local and cultural food habits, meeting specific nutritional requirements. The PNAE also mandate schools to purchase at least 30% of its food to local suppliers (Agricultura Familiar), and its supervison includes representatives of government, education workers and students, civil entities and parents of students (FNDE, 2021[25]).
This section reviews the existing national policy landscape, placing a particular focus on a limited set of policies that are either recognised as particularly innovative, or for which there is a well-developed body of evidence on their effectiveness.
In line with the OECD framework (Sassi and Hurst, 2008[26]), public health policies, including policies to tackle overweight and to promote healthier lifestyles can be categorised into the four broad groups shown in (OECD, 2019[5]):
policies influencing lifestyles through information and education
policies regulating or restricting actions promoting unhealthy choice options, and
While some policies may be very effective, none of them is sufficient in isolation. For example, policy actions aiming to influence lifestyle choices through information or education are important, but not sufficient for someone living in a community where it is difficult to purchase healthy foods, or where exercise options are limited. In such cases, action plans to widen the set of healthy options are essential, such as the provision of certain infrastructure or food retail improvements. Lifestyles can also be influenced by the marketing of calorie-dense and/or ultra-processed foods, regardless of where one lives. Therefore, a certain amount of regulation may be needed, for example in the form of limiting marketing practices (especially advertising targeting children), taxation or even banning certain foods or nutrients (e.g. trans fats). However, even these policies may not be sufficient unless other causes of the recent increase in overweight rates are addressed, such as rising income inequality or poverty. At the very least, such policies should pay particular attention to the needs of the lower socio-economic status groups, who are often the least resilient to the influence of the obesogenic environments in which they live (OECD, 2019[5]).
Public health interventions to reduce overweight can improve the health of the Brazilian people, delaying the development of chronic diseases such as cardiovascular disease, diabetes, and cancer (OECD, 2019[5]). Improvement in population health goes hand in hand with a positive impact on health expenditure. On average, USD PPP 0.99 per capita per year can be saved across 36 countries included in the OECD analysis by implementing menu labelling schemes, the interventions with the biggest impact on health expenditure. The other interventions produce average savings in health expenditure ranging from USD PPP 0.04 to USD PPP 0.97 per capita per year.
5.4.1. Brazil can make further progress in policies influencing lifestyles through information and education to control overweight
Communication-based approaches through the provision of information and education represent a significant share of disease prevention policies put in place by OECD countries, and may take a number of forms. Brazil has made significant progress with its new front-of-package policy, but other policies could be also explored. For instance, restaurant menu labelling, mass media campaigns, use of new technologies and prescription of physical activity by primary health care doctors.
Menu labelling in restaurants could be introduced in Brazil
Menu labelling in restaurants and cafeterias encompasses displaying information on the calorie and other nutrients content, such as salt and sugar, of items on the menu at points-of-purchase. This can be done with or without contextual information like recommended daily calorie intake, or interpretive information such as a traffic light system design. It can also be done with the help of PACE (physical activity calorie equivalent) labels that indicate the number of minutes of exercise needed to burn off the calories consumed.
A systematic review and meta-analysis of mostly mandatory initiatives found that participants who received menus with labels consumed 41 fewer calories per purchase, compared to the control group. The same study also found that contextual or interpretive labels were more effective, by reducing calorie consumption by 81 kcal (Sinclair, Cooper and Mansfield, 2014[27]). Another systematic review assessed the impact of menu labelling on children and adolescents (or their parents), finding that examinations of hypothetical food purchases in artificial environments suggest that menu labelling may be efficacious in reducing calories purchased for or by children and adolescents. Real-world studies are less supportive, although school-based studies were generally positive (Sacco et al., 2017[28]). In addition, menu labelling, besides influencing consumer behaviour, might also encourage restaurants to reformulate their menus by offering lower calorie content. There is evidence in favour (Bleich et al., 2015[29]) and against (Dunford et al., 2010[30]) this assertion, and scientific doubts exist about whether studies focused on calorie changes in chain restaurants are capturing responses to menu labelling legislation rather than responses to other forces encouraging restaurants to change their menus (Bleich et al., 2017[31]).
Mandatory menu labelling initiatives are relatively recent and therefore implemented in a limited number of settings. In the United States, all chain restaurants with at least 20 outlets have been required to show calorie information on their menus since 2018 (Cleveland, Simon and Block, 2018[32]), while these regulations have also covered operators of at least 20 types of vending machines in the United States (Dell, 2018[33]). In Australia, several states introduced legislation between 2011-18 requiring restaurant chains with more than 20 outlets in the state (or more than seven in the Australian Capital Territory), or 50 or more in the whole country, to display the energy content of their menu items (Niven et al., 2019[34]). In Ontario, Canada, all food service chains with at least 20 locations have been required to list calorie counts on their menus since 2017 (Ontario Government, 2019[35]).
In Brazil, a randomised controlled trial with university students in real restaurant settings compared menu labelling information in the form of a traffic light plus guideline daily amounts, an ingredients list plus highlighted symbols (IL+S), and a control group with no menu labelling. Healthy food choices of students who received the menu showing IL+S were significantly higher, while this format positively affected healthy food choices in women, not overweight participants and in participants who often ate out more than twice a week (Oliveira et al., 2018[36]). A qualitative study explored preferences of young adults in Brazil and the United Kingdom about restaurant menu labelling formats. In both countries, participants preferred the ingredients list plus symbols format to make an informed food choice. Organic food and vegetarian symbols were the ones considered most important to appear on restaurant menu labels with ingredients list. However, most participants rejected the information restricted to calories and calories plus nutrients formats, saying that these would not influence their own choices (de Oliveira et al., 2017[37]). This type of studies with Brazilian population are very important for policy design and implementation if Brazil decides to pursue menu labelling in the future.
Channels-wide mass media campaigns are an alternative for expanding Brazil’s actions on overweight control communication
Mass media campaigns (MMC) have the potential to reach many people, while affecting multiple overweight risk factors at the same time. Traditional (TV, radio, newspaper) or new media (online marketing, social media) are used for such campaigns and are often implemented at the national level, although, they can be launched by local authorities.
In Western Australia, the “2&5” MMC (eating two servings of fruit and five servings of vegetables a day) resulted in a population-wide increase in the mean intake of fruit and vegetable servings by about 0.2 servings per day over three years (Pollard et al., 2008[38]). In the United Kingdom, following the introduction of the Change4Life MMC, 58% of people in the treatment group switched to lower-fat dairy products compared to 26% in the comparison group (Wrieden and Levy, 2016[39]). An OECD review of studies assessing MMC to promote an active lifestyle estimated that within one month of the intervention starting, MMC can result in a 60% increase in the number of people who are considered at least moderately active, with the effect disappearing after about three years (Goryakin et al., 2017[40]).
Most, if not all OECD countries, already have, or have had in the past, at least one nationally run MMC to encourage healthier lifestyles. For example, there is almost universal governmental promotion of fruit and vegetable consumption, not only of the well-known “5-a-day” target (e.g. in Chile, Germany, Italy, Mexico, New Zealand, Spain) but also of other types, e.g. “6-a-day” in Denmark or the “2&5” campaign in Western Australia. Governmental programmes also encourage physical activity, such as the “Eat Move” campaign in France or Change4Life campaign in England and Wales (OECD, 2019[5]).
In Brazil, not many MMC targeting overweight exist. One example came from civil society, with the campaign called “You have the right to know what you eat” (Você tem o direito de saber o que come), by the Alliance for an Adequate and Healthy Diet (Aliança pela Alimentação Adequada e Saudável), a network of social organisations that defend the human right to adequate and healthy food. The campaign included pieces on radio, television, digital and print media, focusing on the relationship between overweight and consumption of unhealthy foods (AAAS, 2017[41]). No evaluation was recorded for it.
Should Brazil considers designing and implementing MMC, it might consider a number of challenges. For example, MMC are usually time-limited and not necessarily repeated on a regular basis. In addition, while innovative approaches such as social media are welcome, it is important to make sure that such policies do not create digitally driven inequalities in health. Therefore, the use of more traditional channels, such as television and printed media, should also be maintained. More generally, MMC should be designed while keeping in mind the needs of all people, and especially underprivileged communities. Thus, promotion of healthy lifestyles should go hand in hand with ensuring that sufficient healthy options are available for those wishing to take advantage of them (OECD, 2019[5]).
Mobile apps about food and nutrition exist in Brazil but initiatives can be taken forward to enhance its positive impact
New electronic tools designed to promote various health-related behavioural changes have been developed and adopted in recent years. Among them, mobile phone applications (apps) can help individuals count the numbers of steps they walk in a day, estimate calories consumed, link calorie information to product barcodes that can be scanned by phones; generate charts on trends in calorie consumption and physical activity levels; provide information on nearby health and wellness events/facilities; and promote health behaviours through various rewards programmes (OECD, 2019[5]).
Emerging evidence indicates the potential of such technologies to positively affect health outcomes. A recent systematic review concluded that the use of mobile apps is related to a significant decrease in BMI of about 0.45 kg/m2 and in weight of over 1 kg after 3 to 9 months of follow-up (Islam et al., 2020[42]). Another systematic review found that mobile apps interventions improve nutrition behaviours and nutrition‐related health outcomes, including positive effects on obesity indices, blood pressure and blood lipids (Villinger et al., 2019[43]). Nevertheless, the uptake and usage of most apps can be quite low, which may depend on various factors, such as the spread and intensity of the marketing campaigns promoting their use, as well as privacy-related concerns (Neubeck et al., 2015[44]).
There are already some examples of such technologies in practice. In Austria, an online tool enables the comparison of sugar, salt, fat and energy content of foods across different product categories (lebensmittellupe.at, 2021[45]). Yuka is another mobile app present in the United Kingdom, Ireland, France, Belgium, Switzerland, Luxembourg, Spain, North America and Italy that through scanning bar codes analyses store or supermarket food items, providing a detailed nutritional data sheet for each product. If a scanned product has a bad nutritional score, the app offers independent recommendations for similar items with better nutritional rate (Yuka, 2021[46]). In Estonia, the National Institute for Health Development implemented a web-based tool to help households calculate the amount of salt and sugar in their diet, and software to check the nutritional value of products by name or brand (Toitumine.ee, 2021[47]).
The “Be He@lthy, Be Mobile” (BHBM) is a joint initiative between the International Telecommunication Union (ITU) and the WHO established in 2013. BHBM is the first UN initiative to use population-wide mobile health (mHealth) prevention services at scale, and claims to be the largest-scaled mHealth initiative for NCDs in the world (WHO, 2021[48]).
The main goal of BHBM is to encourage and facilitate partnerships between Ministries of Health, Ministries of Information and Communication Technology, academia and local civil society, with the goal of scaling up national mHealth programmes for NCD prevention and management. Specifically, the initiative aims to leverage the power of mobile technology to deliver a number of public health messages, while other technology mediums for information dissemination are being considered as well.
BHBM now works mostly in low and middle-income countries. It is also active in two OECD countries, Norway and the United Kingdom. Independent impact evaluations have confirmed, for example, that there was a 19% quit rate amongst participants in the mTobaccoCessation programme. In Zambia, mCervicalCancer programme resulted in a 6% increase in cervical cancer screenings (ITU, 2017[49]). A randomised trial in Senegal found that HbA1c levels were better diabetic patients receiving SMS for 3 months. The campaign cost was EUR 2.50 (USD 3.10) per person (Wargny et al., 2018[50]).
As in many countries, Brazil has a variety of mobile apps available for its population. For instance, a study evaluated the mobile app Digital Food Guide (Guia Alimentar Digital, GAD) on self-reported food intake and body weight of 442 Brazilian users of both genders, aged 19-50 years. After using the app, approximately one-third of participants improved their eating pattern and 60% lost weight (p < 0.01). The percentage of individuals consuming poor-quality diet decreased by 8.5%, those achieving intermediate quality increased by 6.8%, and those with high quality increased by 1.6% (p = 0.01) (Caivano and Domene, 2018[51]). However, another study assessed 16 free mobile apps with nutritional information in Brazil finding that they presented partially adequate or inadequate information about food composition (macro- and micronutrients) and that the adequacy of the food energy values ranged from 0 to 57.1%. Despite this, the apps received positive ratings by users (Braz and Lopes, 2019[52]). In this scenario, Brazil could consider the development of regulations to promote the use of mobile apps that can provide reliable and safe nutritional information to help Brazilians to have healthy lifestyles, for instance, about food choices and weight management.
Prescription of physical activity by primary health care teams could be organised and promoted by the Federal and State Governments
Primary health care settings present a good opportunity to provide information and advice on healthy lifestyles and to encourage physical activity, especially among the at-risk population groups. Physicians in particular may be ideally suited to provide advice on adequate physical activity levels. Such advice can take the form of general behavioural counselling or more formal prescribing (OECD, 2019[5]).
Good evidence support prescribing physical activity in primary health care settings to increase its levels amongst sedentary patients, at least in the short term. According to a systematic review and meta-analysis, prescribing physical activity for people at risk of developing chronic diseases may increase physical activity by about 56 extra minutes of moderate-level exercise per week, which can account for about a third of the 150 minutes per week of moderate exercise recommended by WHO (Goryakin, Suhlrie and Cecchini, 2018[53]).
Physical activity on prescriptions programmes exist in at least one-third of OECD countries. In the United Kingdom, they were introduced as early as 1990s, and in Scandinavian countries in the 2000s. They also exist in Germany, the Netherlands, Austria, Belgium, Spain, Portugal, the United States, Canada, New Zealand and Australia. The programme design varies. For example, in some countries, prescriptions are given by general practitioners, while in others by nurses or other health professionals. Prescribed physical activity can be facility, home-based, or both, and may be limited to aerobics, or include other activities such as walking, swimming or gardening (Arsenijevic and Groot, 2017[54]).
The Swedish physical activity on prescription programme was selected as a best practice example by the European Commission (European Commission, 2019[55]). This is a patient-centred counselling programme, in which patients at risk of developing NCDs receive written individualised prescriptions from a medical worker (who may be any qualified licensed health care practitioner, and not necessarily a medical doctor), for both everyday physical activities, as well as for aerobic fitness, strength and flexibility training. The prescription also specifies duration, frequency and intensity of the exercise. There is also a formal follow-up procedure, the results of which go into the patient’s medical record. The ultimate aim of this scheme is to help patients integrate physical activity into their daily lives (Kallings, 2016[56]). A systematic review investigated the effects of the core elements of the Swedish model for physical activity and found that it probably results in an increased level of physical activity (Onerup et al., 2019[57]).
In Brazil, physical activity is prescribed in some primary health care teams but it is not a regular practice and no guideline exist. In general, participation in a physical activity programme starts with counselling from a health professional (physician, nurse, community worker), followed by an invitation to participate in a programme sponsored by the primary health care unit. Program awareness in many cities is also enhanced through special events and community educational activities performed by the health units. A study explored the characteristics of programmes that promote physical activity in the public primary health care system in Brazil. It found that four out of ten primary health care units reported having a physical activity intervention programme, the most common involving walking groups. Most of the activities were performed in the morning, once or twice a week, and in sessions of 30 minutes or more. Physical education professionals were primarily responsible for directing the activities (Gomes et al., 2014[58]), as prescribing exercise is generally considered the domain of physical activity professionals. Another relevant barrier is that physicians are not specific enough in their instructions to patients, not providing enough information to empower people to exercise, especially if the patient has a comorbid condition (De Souto Barreto, 2013[59]). This type of information would be very useful to develop an organised national programme to support the prescription of physical activity by primary health care workers in Brazil. This could be included in the Physical Activity Guide for the Brazilian Population that is currently being developed by the Ministry of Health (Ministério da Saúde, 2020[60]).
5.4.2. Brazil can widen choices for its population through actions in food reformulation, workplaces and transport
While information and education policies to influence lifestyles are important, they may not be sufficient if local environments provide limited opportunities to engage in healthy lifestyles. For instance, mobile apps promoting physical activity may be ineffective if there is a lack of safe, walkable and green spaces. Similarly, encouraging people to eat more fruits and vegetables through mass media campaigns may be hindered if the conditions to buy healthy food are limited, or if food preparation skills are lacking (OECD, 2019[5]).
Actions taken through food reformulation could be further pursued
Food reformulation delivers a different end product through a deliberate change in the production process or in the content of ingredients. Most producers reformulate their products every few years as part of their normal business process, for example to improve quality, save costs, respond to changes in consumer preferences or as an adjustment to food-related governmental policies.
Since the early 2000s, a number of OECD countries have been in discussions with industry on suitable actions to promote reformulation initiatives, which can be either voluntary by industry or mandated by formal regulation. For example, in 2015, the United States food manufacturers and restaurants can no longer produce foods containing partially hydrogenated oils, a primary source of trans fats. Some countries have strict controls, sometimes even bans, on the amount of trans fat in foods (or their major sources, such as partially hydrogenated oils), including Austria, Canada, Chile, Denmark, Hungary and Latvia. Mandatory limits on the amount of salt have also been set, for example, in Belgium, Bulgaria, Greece, Hungary, the Netherlands and Portugal (WCRF, 2018[61]). There are also examples of voluntary reformulation initiatives, which are most often undertaken in collaboration between private companies and governmental entities. For instance, in 2010, the Ministry of Health in Austria, the Agency for Health and Food Safety and the Industrial Bakers of Austria agreed on a voluntary target to reduce the salt content in bakery products by 15% by 2015 (WHO Europe, 2013[62]). At the European level, The Union of European Beverages Associations (UNESDA), representing the European soft drink industry, has committed to voluntarily reducing added sugar in beverages by 10% by 2020, compared to 2015 baseline. A mid-term evaluation carried out by auditors concluded that there was a 11.9% reduction in added sugar achieved by the end of 2017 (Eat and Live Well, 2017[63]).
In terms of scientific evidence, a systematic review found that mandatory reformulation in salt contents alone could achieve a reduction of approximately 1.45g/day, while voluntary reformulation only 0.8g/day (Hyseni et al., 2017[64]). Similarly, a review indicated that all types of trans fatty acids (TFA) policies led to their reduction; however, TFA mandatory bans had a larger impact (TFAs virtually eliminated) than did voluntary agreements (20-38% reduction in TFA intakes) (Downs et al., 2018[65]). Another review of modelling studies of reformulation of processed foods showed that mandatory scenarios were always found to be more effective than voluntary ones (Federici et al., 2019[66]).
In Brazil, since 2007 the Ministry of Health has been working with ABIA (Brazilian Association of Food Industries), who make over 70% of all processed food in the country, to improve the nutritional profile of food. Following the results of the Household Budget Survey in 2009, salt reduction was made a priority. In 2010, ABIA committed to lowering the sodium content of processed food over 10 years and a baseline assessment was undertaken. Following this, in April 2011, the first voluntary sodium reduction targets were set for processed foods that account for 90% of salt consumption in Brazil. As a result, a study found that there was a significant 8-34% reduction in the average sodium content of over half food categories. By 2017, most products of all food categories had met the regional targets proposed by the Pan American Health Organization, while some subcategories may not achieve the targets or may slow their reductions in the long term (Nilson et al., 2017[67]). The targets are monitored by the Ministry of Health, who publish their reports every two years and release the data to the media (Brown, 2017[68]).
OECD (2019[5]) modelled analyses showed that achieving a 20% calorie reduction for foods high in sugar, salt, calories and saturated fats can result in up to 1.1 million cases of cardiovascular diseases, diabetes and cancer avoided annually in 42 countries included between 2020 and 2050. In addition, about USD PPP 13.2 billion can be saved each year across the countries considered, which corresponds to about 0.21% reduction in total health expenditure. Reformulation can also increase the GDP of these 42 countries by 0.51% on average each year relative to the trend, generating additional economic growth. Properly implemented, a broader reformulation policy in Brazil, either voluntary or mandatory (e.g. trans fatty acids), can help achieve a win-win-win outcome for public health, the food industry and for consumers.
Workplace policies could be promoted with collaboration from the health and labour sectors
Workplace-based interventions are increasingly considered as a potentially effective tool to influence healthier lifestyles. Policies include dietary improvements through changes in the selection of daily menus and snacks provided in workplace cafeterias; the promotion of physical activity and reduction of sitting time through the provision of sit-stand workstations; and the implementation of workplace wellness programmes, which may provide various educational materials, classes, seminars, group activities and individual counselling sessions encouraging healthy lifestyles, as well as give incentives such as bonuses and reimbursements to encourage participation (OECD, 2019[5]).
Different reviews have analysed the evidence on the effectiveness of such programmes. Interventions using sit-stand desks, either alone or in combination with information and counselling, reduced sitting time at work on average by 100 minutes per workday at short-term follow-up (up to three months) compared to sit-desks, but no significant effects for implementing walking strategies on workplace sitting time at short-term and medium-term follow-up (Shrestha et al., 2018[69]). A two-year multicomponent workplace programme which included actions to promote a healthy diet, including through information events and education awareness campaigns, was found to increase consumption of fruit and vegetables by 0.3 servings a day (Afshin et al., 2015[70]). A workplace wellness programme, entailing component such as health risk assessment for employees, group activities and individual counselling about healthy lifestyles, as well as provision of various incentives such as performance-related bonuses or reimbursements to encourage participation, was found to reduce BMI by up to 0.64 kg/m2 at the 12 month mark (Penalvo et al., 2017[71]). On the other hand, evidence about the effectiveness of workplace-based policies or practices targeting diet, physical activity, obesity, tobacco use and alcohol is sparse and inconsistent. Only low certainty evidence suggests that such strategies for improving the implementation may make little or no difference on measures of implementation fidelity or different employee health behaviour outcomes (Wolfenden et al., 2018[72]).
While interest in workplace programmes is growing, they are still relatively infrequently implemented in OECD countries, and when they are, there are usually no evaluations of their effectiveness (OECD, 2019[5]). One notable exception is Japan, where such programmes are very popular (see Box 5.6). In Ireland, a National Workplace Well-being day was launched in 2015 with the stated aim to promote physical activity and better nutrition in the workplace, with more than 700 companies participating in 2019 (Civil Service Employee Assistance Service, 2018[73]).
In Brazil, a review found that workplace physical activity is a rather recent subject that has been scarcely addressed by researchers as well (Da Fonseca Neves et al., 2018[74]). Another review found that the Brazilian Government has been showing a growing interest in developing and promoting preventive strategies for cardiovascular diseases, primarily through better control of known risk factors (i.e. smoking, obesity, physical inactivity, high cholesterol, high blood pressure, and high blood glucose). However, the scope of the programmes, communication and marketing strategies and the financial incentives for companies and individuals are fundamental (Cipriano et al., 2014[75]). The Labour Inspectors of the General Occupational Safety and Health Co-ordination are responsible for the management of all activities related to occupational safety and health, representing a good governmental area for promotion workplace polices. Other than inspection and auditing activities, they also support the formulation of directives and norms in the area of occupational safety and health and of the directives for the technical-professional improvement and management (Secretaria de Trabalho, 2020[76]). The collaboration between the health and labour sectors, along with co-ordination with the private sector, would be ideal to promote these healthy workplace policies.
Central and local governments in Japan provide various incentives, usually in the form of awards, for both public and private employer, to implement workplace health promotion programmes. These programmes often focus on affecting such risk factors as unhealthy diet, physical inactivity, harmful alcohol consumption, smoking and mental well-being. The activities are often carried out in small teams so that people can better motivate each other (OECD, 2019[77]).
The scope and comprehensiveness of such programmes is directly proportional to the size of the company, although as a rule, they comprise both targeted (e.g. health check-ups to identify people at higher risk of NCDs), and population-level approaches (e.g. menu labelling and healthier foods offers in canteens, provision of pedometers and installation of standing desks to encourage physical activity). The participation rates in such programmes are usually very high, which may be due to both cultural reasons, as well as owing to the provision of various incentives. For example, rewards such as money, additional leave or other benefits may be given to participating employees based on meeting various targets, such as walking a minimum number of steps, or reaching a certain BMI threshold.
Policies promoting active transport and walking could be expanded and led by the Federal and State Governments
There are numerous examples of policies designed to make it easier for people to integrate physical activity into their daily lives through active travel and walking. They can include, for example, access to dedicated cycle lanes and bike-sharing schemes. Other actions can also include urban planning to increase the number of parks, recreational areas and green spaces, as well as expanding access to convenient public transport options to encourage people to switch from car use and to walk more to reach their destinations (OECD, 2019[5]).
Active travel options, such as travelling by bicycle, can increase physical activity and decrease the need for passenger vehicles, and ultimately improve physical (Otero, Nieuwenhuijsen and Rojas-Rueda, 2018[78]) and mental health (Martin, Goryakin and Suhrcke, 2014[79]). Physical activity can also be encouraged by better access to public transport. For example, for each person living in a community exposed to a newly available public transport system, walking increases by about 30 minutes per week (Xiao, Goryakin and Cecchini, 2019[80]). Active travel, walking and physical activity in general can be encouraged by better access to parks, green space areas and recreational facilities. For example, in the United States, living near parks and playgrounds is associated with a statistically significant reduction in childhood obesity, by 0.47 kg/m2 and 0.27 kg/m2 among boys and girls, respectively (Fan and Jin, 2014[81]).
There are numerous best practices in this area, including dedicated cycle lanes and bike-sharing schemes in cities such as Copenhagen, London, Amsterdam, Paris, Vienna and New York. As an added benefit, riding bicycles can also contribute to reduced air pollution, as in Barcelona, where the scheme was linked to the reduction of yearly CO2 emissions by about 9 000 tonnes (Rojas-Rueda et al., 2011[82]). On a global level, C40 is the network of the world’s largest cities that collaborate to take action on climate change while improving the quality of urban life. Other policies of note include: closing central parts of the cities to traffic on certain days of the week; the introduction of electric (or zero emission) buses in the cities; or community programmes to encourage leisure-time physical activity. While these policies have the potential to positively affect the health of many people, their implementation often relies on local administrations, which may have limited incentives or support at a national level. This creates a risk that poorer communities are less likely to have sufficient resources to implement such actions. Without appropriate intergovernmental fiscal transfers, there is a threat of increasing health inequalities driven by such disparities in financing (OECD, 2019[77]).
In Brazil, several cities have promoted such strategies, which some have been also evaluated. For example, three years after a walking and cycling route was built in Florianopolis, those living less than 500 metres away from it increased their walking and moderate-to-vigorous physical activity by about 50 minutes per week, compared to almost no change in those who lived 1 000-1 500 metres away (Pazin et al., 2016[83]). Another shed light on inequalities around these policies in Rio de Janeiro and Curitiba, find that both cities have more than twice the supply of bicycle lanes in the wealthiest quintile than the lowest income quintile relative to area and population (Tucker and Manaugh, 2018[84]). Brazilian state and federal structured policies can further develop these municipal initiatives, putting a focus on how reducing inequalities.
5.4.3. Brazil can improve the regulation of actions that promote unhealthy choice options
Regulation of food and beverages advertising should be revised in Brazil, having children as a priority audience to protect
Food marketing represents a key factor incentivising the consumption of high-calorie and nutrient-poor foods through persuasive messages. Advertising restrictions typically take the form of a ban on commercial advertising for certain products during peak viewing time for children, although the target age of the affected children can vary (e.g. under 12 years of age in Sweden, or 14 years of age in Chile) (OECD, 2019[77]).
Literature vastly report a significant positive association between food advertising and food choices and purchasing behaviour, with women appearing to be more susceptible (Vukmirovic, 2015[85]). A review focusing on the effect over children found that food advertising is prevalent, it promotes largely energy dense, nutrient poor foods, and even short‐term exposure results in children increasing their food consumption (Boyland and Whalen, 2015[86]). A meta-analysis of 18 experiment studies indicated that participants eat more after exposure to food advertising than after control conditions. Subgroup analyses showed that the experiments with adult provided no evidence of an effect of advertising, but a significant effect of moderate size was shown for children, whereby food advertising exposure was associated with greater food intake (Boyland et al., 2016[87]). Another review confirmed these findings, as its meta‐analysis revealed that children exposed to food advertising on TV (11 studies) and advergames (5 studies) consumed an average of 60.0 kcal and 53.2 kcal, respectively, more than children exposed to non-food advertising did. In addition, compared with non-food adverts, children with overweight or obesity consumed an average of 45.6 kcal more than children with healthy weight (Russell, Croker and Viner, 2019[88]).
Studies suggest that statutory restrictions on commercial food advertising and promotion can have a significant effect on dietary intake. For example, in Quebec, the implementation of this policy was followed by a reduction in calorie consumption at fast-food restaurants of between 5.6 billion and 7.8 billion per year (Dhar and Baylis, 2011[89]). In Australia, a study concluded that banning TV advertising for energy-dense food during children’s peak viewing times was highly cost-effective (Magnus et al., 2009[90]). In Chile, following a 2016 child-directed marketing regulation, pre-schoolers’ and adolescents’ TV exposure to advertising of foods high in saturated fats, sodium and sugars decreased significantly by 44% and 58%, respectively. Exposure to "high-in" food advertising with child-directed appeals, such as cartoon characters, decreased by 35% and 52% for pre-schoolers and adolescents, respectively (Dillman Carpentier et al., 2020[91]). On the other hand, a systematic review concluded that voluntary pledges to restrict high-calorie advertising may not be as effective in reducing exposure of children to advertisements, which may be due to the lack of enforceability or penalties for non-compliance (Galbraith-Emami and Lobstein, 2013[92]). In the same vein, a study assessed the 2009 food industry voluntary initiative to reduce marketing of unhealthy food to children in Australia. Total food advertising rates increased from 5.5/h in 2011 to 7.3/h in 2015, due to an increase of 0.8/h for both core and miscellaneous foods. The youth-oriented channel had fewer total food advertisements (3.7/h versus 7.3/h) but similar fast-food advertisement rates (1.3/h versus 1.3/h) (Watson et al., 2017[93]).
In Brazil, the National Council of Self-Regulatory Publicity (Conselho Nacional de Autorregulamentação Publicitária, CONAR) is a non-governmental organisation responsible for issuing and supervising the Code of Ethics applied to marketing strategies, including recent reviews of specific rules concerning advertisement of food and beverage industry and advertisement of products for children and adolescents, published in 2006. In addition, the National Council for the Rights of Children and Adolescents (Conselho Nacional dos Direitos da Criança e do Adolescente, CONANDA), co-ordinated by the federal government, published a resolution (Resolução 163, 13 March 2014) that establishes criteria for publicity and marketing aimed at children (up to 11 years) and adolescents (12-18 years), prohibiting any kind of “abusive publicity” (Kassahara and Sarti, 2017[94]). However, self-regulation of food advertisement remains as the norm in Brazil, which place it with other 19 OECD countries having voluntary TV restrictions to children, while 14 countries have mandatory restrictions and only 5 countries have none (Figure 5.14).
In this context, studies have analysed the TV advertisement scenario in Brazil. Costa et al. (2013[95]) found that 13.8% of all advertisement during children programme´s broadcasting in three Brazilian ‘free-to-air’ TV stations was of food. Sugars and sweets represented 48.1%, and oils and fats 29.1%, while food publicity was more concentrated in the afternoon. The broadcast with more audience was the one that advertised more food (A: 63.5%; B: 12.2%; C: 24.3%), especially ‘sugar and sweets’ (A: 59.2%; B: 43.5%; C: 21.7%). Another study analysing the four most popular Brazilian TV channels in January 2014 found that 10.2% of all advertisements were of food. Ultra-processed foods (UPF) accounted for 60.7% of the commercials, while fresh or minimally processed foods at around 7%. Authors concluded that these findings run counter to the Food Guide for the Brazilian Population’s recommendations (Maia et al., 2017[96]). A third study assessed the three major Brazilian free-to-air TV channels in April 2018 finding that 18.1% of the total advertisements shown were for food and beverages. Over 80% of all foods and beverages advertised did not meet the PAHO and WHO/Europe nutritional quality standards and were considered eligible for marketing restrictions. The proportion of unhealthy food advertisement was significantly higher on weekends, in the afternoon, and during soap operas programming (Leite et al., 2020[97]). A fourth study assessing the same three major TV channels in April 2018 found that 14.2% of all advertisements were food related. Approximately 91% of food items advertisements included UPF products, and the top three most promoted products were soft drinks, alcoholic beverages and fast-food meals. Frequency of UPF advertisements were equally broadcasted during the morning, afternoons and evenings (Soares Guimarães et al., 2020[98]). In light of this evidence and the current regulatory framework, Brazil could consider implementing and monitoring stricter regulations to food and beverages advertisement, having children as the priority group to protect.
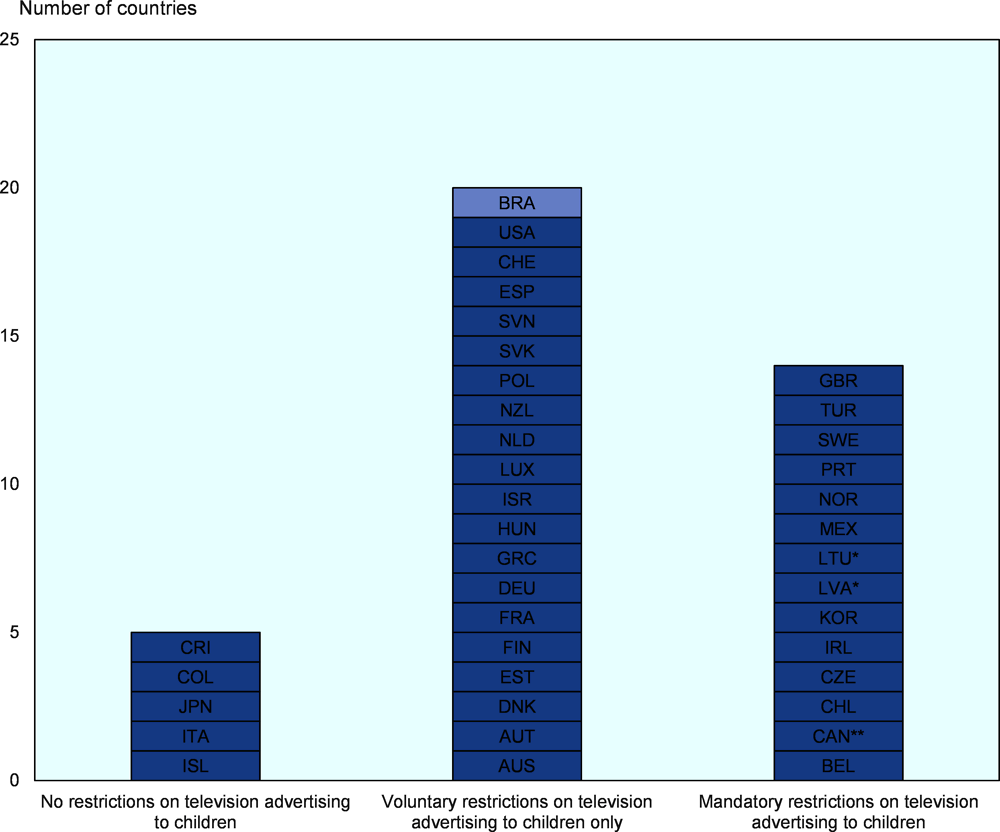
Note: OECD countries in dark blue. * Mandatory regulation only applies to energy drinks; ** Province-level regulation (Quebec).
Source: Updated from OECD (2019[5]), The Heavy Burden of Obesity: The Economics of Prevention, https://dx.doi.org/10.1787/67450d67-en.
5.4.4. Policies to modify the costs of health-related choices can be effective, but it requires careful policy design and implementation
Pricing food policies, in particular sweetened beverages, are a policy option to reduce obesity, but its effectiveness depend on aspects of supply and demand
Governments can affect food-related consumer behaviour by implementing targeted price policies. Most policy action in this field has focused on increasing the price of products high in sugar, saturated fats or salt. Such policies may also include targeted price reduction for healthier foods sold in shops (OECD, 2019[77]).
Among the various price policies, taxation of sugar-sweetened beverages (SSBs) is gaining particular attention. In general, evaluations of such policies have found that they do have an intended effect on consumption, with one recent systematic review and meta-analysis concluding that a 10% SSB tax was related to a 10% decline in SSB purchases and dietary intake (Teng et al., 2019[99]). It is also clear that the magnitude of the tax effect varies depending on the programme design, on the size of the tax and the extent of its pass-through to consumers (i.e. extent to which producers pass the tax to consumers through an increase in the price of the taxed product). For example, in Mexico, an SSB tax in the amount of MXN 1/L (about USD 0.05 USD/L) was almost entirely passed to the consumers, resulting in a 10% increase in the price of SSBs (Caro et al., 2018[100])and a 6-12% drop in per capita purchases (Colchero et al., 2016[101]). In Chile, an 8% tax difference between two SSB categories, containing high and low amounts of sugar, resulted in a price difference of 3.3%, equivalent to an additional 15 Chilean pesos (about USD 0.04/L) for a typical 500 ml beverage (Nakamura et al., 2018[102]). As a result, monthly purchased volume was reduced as well, although the estimated effect varied between 4-21%, depending on the methodology used. In the United States, the city of Berkeley levies tax at a rate of USD 0.01 per ounce (USD 0.34/L), equivalent to a price increase of about 8% after a pass-through of about 47% of tax, which resulted in a 21% decline in sales of SSBs in low-income neighbourhoods (Falbe et al., 2016[103]).
Among OECD countries, 24 do not have any health-related food taxes in place. Thirteen countries tax SSBs or other foods, but the United States and Spain only at subnational levels. Some examples of taxation policies include “soda taxes” in France, Chile, Mexico, the United Kingdom, the city of Berkeley and the State of Pennsylvania in the United States. Other examples include a tax on ready-to-eat meals in Hungary and on food high in saturated fats in Denmark, introduced in 2009 and abolished in 2013 (Vallgårda, Holm and Jensen, 2015[104]).
The design of price policies should take into account potential multiple challenges. First, there should be a sufficient pass-through of the tax in the form of a price increase, as minimal changes in price are unlikely to significantly modify purchasing patterns. Second, any potential substitution effect should be taken into account as well. For example, if SSBs are taxed, people may switch to other high-calorie drinks (e.g. high-fat milks, or juices), increase their consumption of non-beverage foods high in sugar, or even increase purchases of alcoholic beverages. Third, if the demand curve is inelastic, then there may be little change in consumption, although, on a positive side, low elasticity may also imply little substitution with other calorie-dense foods or beverages. There is also concern about the adverse economic effect of such taxes, especially on low-income groups. However, previous OECD analyses suggest that health improvements resulting from such actions may disproportionately benefit the poor. In addition, revenues generated from the application of such taxes may be designed to benefit primarily low-income households (OECD, 2019[77]).
Overweight in Brazil, including pre-obesity and obesity, is growing at a higher rate than in OECD countries. Children overweight is already above the OECD average creating a worrying scenario for the future. Brazilians have unhealthier food consumption habits than other OECD countries, in particular in relation to the intake of sugar. At the same time, Brazil has a very high prevalence of insufficient physical activity, greater than all OECD countries. This scenario will progressively damage health, increasing premature mortality and decreasing life expectancy at higher rates than in OECD countries. It will also hit harder health expenditure and much harder the economy in terms of GDP reduction.
Brazil has already initiated the implementation of actions to control overweight, by having national strategies dedicated to it with an intersectoral focus. The country also has innovated in terms of approving a new front-of-package food labelling policy that will help Brazilian consumers in making healthier choices. School-based programmes are also in place having a very important role for the present and the future. With this as baseline, Brazil could aim for a more ambitious multi-sectoral comprehensive response targeting the main overweight determinants. It can include policies influencing lifestyles through information and education by introducing menu labelling in restaurants, structured mass media campaigns, well-regulated mobile apps, and promoting prescription of physical activity by family health teams. The strategy can widen choices through encouraging food reformulation and developing workplace and transport policies to provide new healthier alternatives for people. Finally, the Brazilian response can improve the regulation of food and beverages advertising, in particular for children.
Evidence shows that the convergence of several of these policies can have an impact in reversing the overweight increasing trend in Brazil, diminish the development of chronic conditions and improve population health, have a positive impact on the health system financing sustainability, and produce substantial returns on the investment for the general economy. With the proper measures and policy design, including robust monitoring and evaluation systems, the pursuit of such a multi-sectoral comprehensive response can be beneficial for all actors.
References
[41] AAAS (2017), Brazil - Food Policy - You Have the Right to Know What You Eat - YouTube, Aliança pela Alimentação Adequada e Saudável, https://www.youtube.com/watch?v=Ob5i5t_RS9s (accessed on 11 March 2021).
[70] Afshin, A. et al. (2015), CVD Prevention Through Policy: a Review of Mass Media, Food/Menu Labeling, Taxation/Subsidies, Built Environment, School Procurement, Worksite Wellness, and Marketing Standards to Improve Diet, Current Medicine Group LLC 1, https://doi.org/10.1007/s11886-015-0658-9.
[12] ANVISA (2020), Anvisa aprova norma sobre rotulagem nutricional, Agência Nacional de Vigilância Sanitária, https://www.gov.br/anvisa/pt-br/assuntos/noticias-anvisa/2020/aprovada-norma-sobre-rotulagem-nutricional (accessed on 11 March 2021).
[11] ANVISA (2019), Relatório de Análise de Impacto Regulatório sobre Rotulagem Nutricional, Agência Nacional de Vigilância Sanitária, Brasília, http://antigo.anvisa.gov.br/documents/33880/5313808/Relat%C3%B3rio+de+An%C3%A1lise+de+Impacto+Regulat%C3%B3rio+sobre+Rotulagem+Nutriconal.pdf/31d15194-568c-4862-82ec-97e38202b1a1 (accessed on 11 March 2021).
[54] Arsenijevic, J. and W. Groot (2017), Physical activity on prescription schemes (PARS): Do programme characteristics influence effectiveness? Results of a systematic review and meta-analyses, BMJ Publishing Group, https://doi.org/10.1136/bmjopen-2016-012156.
[31] Bleich, S. et al. (2017), A Systematic Review of Calorie Labeling and Modified Calorie Labeling Interventions: Impact on Consumer and Restaurant Behavior, Blackwell Publishing Inc., https://doi.org/10.1002/oby.21940.
[19] Bleich, S. et al. (2018), Interventions to prevent global childhood overweight and obesity: a systematic review, Lancet Publishing Group, https://doi.org/10.1016/S2213-8587(17)30358-3.
[29] Bleich, S. et al. (2015), “Restaurants with calories displayed on menus had lower calorie counts compared to restaurants without such labels”, Health Affairs, Vol. 34/11, pp. 1877-1884, https://doi.org/10.1377/hlthaff.2015.0512.
[7] Bortolini, G. et al. (2020), “Feeding and nutrition efforts in the context of primary healthcare in Brazil”, Revista Panamericana de Salud Publica/Pan American Journal of Public Health, Vol. 44, https://doi.org/10.26633/RPSP.2020.39.
[87] Boyland, E. et al. (2016), “Advertising as a cue to consume: a systematic review and meta-analysis of the effects of acute exposure to unhealthy food and nonalcoholic beverage advertising on intake in children and adults”, American Journal of Clinical Nutrition, Vol. 103/2, pp. 519-533, https://doi.org/10.3945/ajcn.115.120022.
[86] Boyland, E. and R. Whalen (2015), “Food advertising to children and its effects on diet: review of recent prevalence and impact data”, Pediatric Diabetes, Vol. 16/5, pp. 331-337, https://doi.org/10.1111/pedi.12278.
[4] Bray, G. and B. Popkin (2014), Dietary sugar and body weight: Have we reached a crisis in the epidemic of obesity and diabetes?: Health be damned! Pour on the sugar, American Diabetes Association Inc., https://doi.org/10.2337/dc13-2085.
[52] Braz, V. and M. Lopes (2019), “Evaluation of mobile applications related to nutrition”, Public Health Nutrition, Vol. 22/7, pp. 1209-1214, https://doi.org/10.1017/S136898001800109X.
[68] Brown, M. (2017), Brazil’s Salt Reduction Program, World Action on Salt & Health, http://www.worldactiononsalt.com/blog/2017/brazils-salt-reduction-program.html (accessed on 21 March 2021).
[10] CAISAN (2014), Estratégia Intersetorial de Prevenção e Controle da Obesidade, Câmara Intersetorial de Segurança Alimentar e Nutricional, http://www.mds.gov.br/webarquivos/publicacao/seguranca_alimentar/estrategia_prevencao_obesidade.pdf (accessed on 11 March 2021).
[51] Caivano, S. and S. Domene (2018), “Better food choices among users of the Digital Food Guide: a report from Brazil”, Revista Eletrônica de Comunicação, Informação e Inovação em Saúde, Vol. 12/3, https://doi.org/10.29397/reciis.v12i3.1308.
[100] Caro, J. et al. (2018), “Chile’s 2014 sugar-sweetened beverage tax and changes in prices and purchases of sugar-sweetened beverages: An observational study in an urban environment”, PLOS Medicine, Vol. 15/7, https://doi.org/10.1371/journal.pmed.1002597.
[21] CATCH (2021), Coordinated Approach to Child Health, CATCH Global Foundation, https://catchinfo.org/ (accessed on 12 March 2021).
[75] Cipriano, G. et al. (2014), “Cardiovascular disease prevention and implications for worksite health promotion programs in Brazil”, Progress in Cardiovascular Diseases, Vol. 56/5, pp. 493-500, https://doi.org/10.1016/j.pcad.2013.10.018.
[73] Civil Service Employee Assistance Service (2018), National Workplace Wellbeing Day – April 13th 2018, https://www.cseas.per.gov.ie/national-workplace-wellbeing-day-april-13th-2018/ (accessed on 18 March 2021).
[32] Cleveland, L., D. Simon and J. Block (2018), “Compliance in 2017 with federal calorie labeling in 90 chain restaurants and 10 retail food outlets prior to required implementation”, American Journal of Public Health, Vol. 108/8, pp. 1099-1102, https://doi.org/10.2105/AJPH.2018.304513.
[101] Colchero, M. et al. (2016), “Beverage purchases from stores in Mexico under the excise tax on sugar sweetened beverages: Observational study”, BMJ (Online), Vol. 352, https://doi.org/10.1136/bmj.h6704.
[95] Costa, S., P. Horta and L. dos Santos (2013), “Análise dos alimentos anunciados durante a programação infantil em emissoras de canal aberto no Brasil”, Revista Brasileira de Epidemiologia, Vol. 16/4, pp. 976-983, https://doi.org/10.1590/S1415-790X2013000400017.
[22] Crunch&Sip® (2021), Crunch&Sip®, Cancer Council Western Australia, https://www.crunchandsip.com.au/ (accessed on 12 March 2021).
[74] Da Fonseca Neves, R. et al. (2018), Workplace physical activity in Brazil from 2006 to 2016: Scoping review, Associacao Nacional de Medicina do Trabalho, https://doi.org/10.5327/Z1679443520180078.
[37] de Oliveira, R. et al. (2017), “Preferences for menu labelling formats of young adults in Brazil and in the United Kingdom”, Revista de Nutricao, Vol. 30/3, pp. 321-332, https://doi.org/10.1590/1678-98652017000300005.
[59] De Souto Barreto, P. (2013), Prescription of physical activity, Elsevier, https://doi.org/10.1016/S0140-6736(13)61019-3.
[33] Dell, E. (2018), Calorie Disclosure, Vending Market Watch, https://www.vendingmarketwatch.com/home/article/12414882/calorie-disclosure (accessed on 11 March 2021).
[89] Dhar, T. and K. Baylis (2011), “Fast-Food Consumption and the Ban on Advertising Targeting Children: The Quebec Experience”, Journal of Marketing Research, Vol. 48/5, https://doi.org/10.1509/jmkr.48.5.799.
[14] Diário Oficial da União (2020), Instrução Normativa n. 75, de 8 de outubro 2020: Estabelece os requisitos técnicos para declaração da rotulagem nutricional nos alimentos embalados, Ministério da Saúde/Agência Nacional de Vigilância Sanitária/Diretoria Colegiada, https://www.in.gov.br/en/web/dou/-/instrucao-normativa-in-n-75-de-8-de-outubro-de-2020-282071143 (accessed on 11 March 2021).
[13] Diário Oficial da União (2020), Resolução de Diretoria Colegiada - RDC n° 429, de 08 de outubro de 2020, https://www.in.gov.br/en/web/dou/-/resolucao-de-diretoria-colegiada-rdc-n-429-de-8-de-outubro-de-2020-282070599 (accessed on 11 March 2021).
[91] Dillman Carpentier, F. et al. (2020), “Evaluating the impact of Chile’s marketing regulation of unhealthy foods and beverages: pre-school and adolescent children’s changes in exposure to food advertising on television”, Public Health Nutrition, Vol. 23/4, https://doi.org/10.1017/S1368980019003355.
[65] Downs, S. et al. (2018), “The impact of policies to reduce trans fat consumption: A systematic review of the evidence”, Current Developments in Nutrition, Vol. 1/12, https://doi.org/10.3945/cdn.117.000778.
[30] Dunford, E. et al. (2010), “Nutrient content of products served by leading Australian fast food chains”, Appetite, Vol. 55/3, pp. 484-489, https://doi.org/10.1016/j.appet.2010.08.015.
[63] Eat and Live Well (2017), 10 percent sugar reduction between 2015-2020, https://www.eatandlivewell.eu/product-formulation-and-innovation/10-sugar-reduction-between-2015-2020/ (accessed on 21 March 2021).
[20] European Commission (2020), EU school fruit, vegetables and milk scheme, https://ec.europa.eu/info/food-farming-fisheries/key-policies/common-agricultural-policy/market-measures/school-fruit-vegetables-and-milk-scheme/school-scheme-explained_en (accessed on 12 March 2021).
[55] European Commission (2019), EUPAP - An European Physical Activity on Prescription model, https://webgate.ec.europa.eu/chafea_pdb/health/projects/847174/summary (accessed on 12 March 2021).
[103] Falbe, J. et al. (2016), “Impact of the Berkeley Excise Tax on Sugar-Sweetened Beverage Consumption”, American Journal of Public Health, Vol. 106/10, https://doi.org/10.2105/AJPH.2016.303362.
[81] Fan, M. and Y. Jin (2014), “Do neighborhood parks and playgrounds reduce childhood obesity?”, American Journal of Agricultural Economics, Vol. 96/1, pp. 26-42, https://doi.org/10.1093/ajae/aat047.
[66] Federici, C. et al. (2019), The impact of food reformulation on nutrient intakes and health, a systematic review of modelling studies, BioMed Central, https://doi.org/10.1186/s40795-018-0263-6.
[25] FNDE (2021), Programa Nacional de Alimentação Escolar, Fundo Nacional de Desenvolvimento da Educação, https://www.fnde.gov.br/index.php/programas/pnae?view=default (accessed on 13 March 2021).
[92] Galbraith-Emami, S. and T. Lobstein (2013), “The impact of initiatives to limit the advertising of food and beverage products to children: a systematic review”, Obesity Reviews, Vol. 14/12, pp. 960-974, https://doi.org/10.1111/obr.12060.
[58] Gomes, G. et al. (2014), “Characteristics of physical activity programs in the Brazilian primary health care system”, Cadernos de Saúde Pública, Vol. 30/10, pp. 2155-2168, https://doi.org/10.1590/0102-311X00085713.
[40] Goryakin, Y. et al. (2017), The Role of Communication in Public Health Policies: The Case of Obesity Prevention in Italy, Organisation for Economic Cooperation and Development, Paris.
[53] Goryakin, Y., L. Suhlrie and M. Cecchini (2018), “Impact of primary care-initiated interventions promoting physical activity on body mass index: systematic review and meta-analysis”, Obesity Reviews, Vol. 19/4, pp. 518-528, https://doi.org/10.1111/obr.12654.
[3] Graf, S. and M. Cecchini (2017), “Diet, physical activity and sedentary behaviours: Analysis of trends, inequalities and clustering in selected oecd countries”, OECD Health Working Papers, No. 100, OECD Publishing, Paris, https://dx.doi.org/10.1787/54464f80-en.
[6] Guthold, R. et al. (2018), “Worldwide trends in insufficient physical activity from 2001 to 2016: a pooled analysis of 358 population-based surveys with 1·9 million participants”, The Lancet Global Health, Vol. 6/10, pp. e1077-e1086, https://doi.org/10.1016/S2214-109X(18)30357-7.
[64] Hyseni, L. et al. (2017), Systematic review of dietary salt reduction policies: Evidence for an effectiveness hierarchy?, Public Library of Science, https://doi.org/10.1371/journal.pone.0177535.
[2] IBGE (2020), Um em cada quatro adultos do país estava obeso em 2019; Atenção Primária foi bem avaliada, Instituto Brasileiro de Geografia e Estatística, https://agenciadenoticias.ibge.gov.br/agencia-noticias/2012-agencia-de-noticias/noticias/29204-um-em-cada-quatro-adultos-do-pais-estava-obeso-em-2019 (accessed on 9 March 2021).
[42] Islam, M. et al. (2020), “Use of mobile phone app interventions to promote weight loss: Meta-analysis”, JMIR mHealth and uHealth, Vol. 8/7, https://doi.org/10.2196/17039.
[49] ITU (2017), Results BeHe@lthy BeMobile 2017, International Telecommunication Union, https://www.itu.int/en/ITU-D/ICT-Applications/Pages/results-BeHealthy-BeMobile-2017.aspx (accessed on 11 March 2021).
[56] Kallings, L. (2016), “The Swedish approach on physical activity on prescription”, HEPA, Vol. 6/Supplement, pp. 31-33, https://www.clinhp.org/ifile/Vol6_Supplement2_HEPA_p31_p33.pdf (accessed on 12 March 2021).
[94] Kassahara, A. and F. Sarti (2017), “Marketing of food and beverage in Brazil: scientific literature review on regulation and self-regulation of advertisements”, Interface - Comunicação, Saúde, Educação, Vol. 22/65, https://doi.org/10.1590/1807-57622016.0630.
[45] lebensmittellupe.at (2021), Lebensmittel uter der Lupe, https://lebensmittellupe.at/index.php?id=1484 (accessed on 11 March 2021).
[97] Leite, F. et al. (2020), “Nutritional quality of foods and non-alcoholic beverages advertised on Brazilian free-to-air television: a cross-sectional study”, BMC Public Health, Vol. 20/1, https://doi.org/10.1186/s12889-020-08527-6.
[90] Magnus, A. et al. (2009), “The cost-effectiveness of removing television advertising of high-fat and/or high-sugar food and beverages to Australian children”, International Journal of Obesity, Vol. 33/10, https://doi.org/10.1038/ijo.2009.156.
[96] Maia, E. et al. (2017), “Análise da publicidade televisiva de alimentos no contexto das recomendações do Guia Alimentar para a População Brasileira”, Cadernos de Saúde Pública, Vol. 33/4, https://doi.org/10.1590/0102-311x00209115.
[79] Martin, A., Y. Goryakin and M. Suhrcke (2014), “Does active commuting improve psychological wellbeing? Longitudinal evidence from eighteen waves of the British Household Panel Survey”, Preventive Medicine, Vol. 69, pp. 296-303, https://doi.org/10.1016/j.ypmed.2014.08.023.
[24] Ministério da Saúde (2021), Programa Saúde na Escola (PSE), Ministério da Saúde, Secretaria de Atenção Primária a Saúde, https://aps.saude.gov.br/ape/pse (accessed on 13 March 2021).
[60] Ministério da Saúde (2020), Consulta Pública: Guia de Atividade Física para a População Brasileira, Portal da Secretaria de Atenção Primária a Saúde, https://aps.saude.gov.br/noticia/9516 (accessed on 12 March 2021).
[9] Ministério da Saúde (2013), Política Nacional de Alimentação e Nutrição, Ministério da Saúde. Secretaria de Atenção à Saúde. Departamento de Atenção Básica, Brasilia, https://bvsms.saude.gov.br/bvs/publicacoes/politica_nacional_alimentacao_nutricao.pdf (accessed on 11 March 2021).
[102] Nakamura, R. et al. (2018), “Evaluating the 2014 sugar-sweetened beverage tax in Chile: An observational study in urban areas”, PLOS Medicine, Vol. 15/7, https://doi.org/10.1371/journal.pmed.1002596.
[44] Neubeck, L. et al. (2015), The mobile revolution-using smartphone apps to prevent cardiovascular disease, Nature Publishing Group, https://doi.org/10.1038/nrcardio.2015.34.
[67] Nilson, E. et al. (2017), “Sodium reduction in processed foods in Brazil: Analysis of food categories and voluntary targets from 2011 to 2017”, Nutrients, Vol. 9/7, https://doi.org/10.3390/nu9070742.
[34] Niven, P. et al. (2019), “Effects of health star labelling on the healthiness of adults’ fast food meal selections: An experimental study”, Appetite, Vol. 136, pp. 146-153, https://doi.org/10.1016/j.appet.2019.01.018.
[23] OECD (2019), OECD Reviews of Public Health: Chile: A Healthier Tomorrow, OECD Reviews of Public Health, OECD Publishing, Paris, https://dx.doi.org/10.1787/9789264309593-en.
[77] OECD (2019), OECD Reviews of Public Health: Japan: A Healthier Tomorrow, OECD Reviews of Public Health, OECD Publishing, Paris, https://dx.doi.org/10.1787/9789264311602-en.
[5] OECD (2019), The Heavy Burden of Obesity: The Economics of Prevention, OECD Health Policy Studies, OECD Publishing, Paris, https://dx.doi.org/10.1787/67450d67-en.
[36] Oliveira, R. et al. (2018), “Menu labelling and healthy food choices: a randomised controlled trial”, British Food Journal, Vol. 120/4, pp. 788-803, https://doi.org/10.1108/BFJ-04-2017-0248.
[57] Onerup, A. et al. (2019), Physical activity on prescription in accordance with the Swedish model increases physical activity: A systematic review, BMJ Publishing Group, https://doi.org/10.1136/bjsports-2018-099598.
[35] Ontario Government (2019), Calories on menus, Ontario.ca, https://www.ontario.ca/page/calories-menus (accessed on 11 March 2021).
[78] Otero, I., M. Nieuwenhuijsen and D. Rojas-Rueda (2018), “Health impacts of bike sharing systems in Europe”, Environment International, Vol. 115, pp. 387-394, https://doi.org/10.1016/j.envint.2018.04.014.
[83] Pazin, J. et al. (2016), “Effects of a new walking and cycling route on leisure-time physical activity of Brazilian adults: A longitudinal quasi-experiment”, Health and Place, Vol. 39, pp. 18-25, https://doi.org/10.1016/j.healthplace.2016.02.005.
[71] Penalvo, J. et al. (2017), “Abstract MP005: Do Worksite Wellness Programs Improve Dietary Behaviors and Adiposity? A Systematic Review and Meta-analysis | Circulation”, Circulation, Vol. 135/Suppl 1, https://www.ahajournals.org/doi/abs/10.1161/circ.135.suppl_1.mp005 (accessed on 18 March 2021).
[8] Pinheiro, M. et al. (2019), “Intersectoral approach to obesity prevention and control: The Brazilian experience from 2014 to 2018”, Revista Panamericana de Salud Publica/Pan American Journal of Public Health, Vol. 43, https://doi.org/10.26633/RPSP.2019.58.
[38] Pollard, C. et al. (2008), “Increasing fruit and vegetable consumption: Success of the Western Australian Go for 2&5® campaign”, Public Health Nutrition, Vol. 11/3, pp. 314-320, https://doi.org/10.1017/S1368980007000523.
[82] Rojas-Rueda, D. et al. (2011), “The health risks and benefits of cycling in urban environments compared with car use: Health impact assessment study”, BMJ (Online), Vol. 343/7819, https://doi.org/10.1136/bmj.d4521.
[88] Russell, S., H. Croker and R. Viner (2019), “The effect of screen advertising on children’s dietary intake: A systematic review and meta-analysis”, Obesity Reviews, Vol. 20/4, pp. 554-568, https://doi.org/10.1111/obr.12812.
[28] Sacco, J. et al. (2017), The influence of menu labelling on food choices among children and adolescents: A systematic review of the literature, SAGE Publications Ltd, https://doi.org/10.1177/1757913916658498.
[26] Sassi, F. and J. Hurst (2008), “The Prevention of Lifestyle-Related Chronic Diseases: an Economic Framework”, OECD Health Working Papers, No. 32, OECD Publishing, Paris, https://dx.doi.org/10.1787/243180781313.
[16] Saunders, P., A. Saunders and J. Middleton (2015), “Living in a ’fat swamp’: Exposure to multiple sources of accessible, cheap, energy-dense fast foods in a deprived community”, British Journal of Nutrition, Vol. 113/11, pp. 1828-1834, https://doi.org/10.1017/S0007114515001063.
[76] Secretaria de Trabalho (2020), Segurança e Saúde no Trabalho, https://www.gov.br/trabalho/pt-br/inspecao/areas-de-atuacao/seguranca-e-saude-no-trabalho (accessed on 18 March 2021).
[69] Shrestha, N. et al. (2018), Workplace interventions for reducing sitting at work, John Wiley and Sons Ltd, https://doi.org/10.1002/14651858.CD010912.pub4.
[27] Sinclair, S., M. Cooper and E. Mansfield (2014), “The influence of menu labeling on calories selected or consumed: a systematic review and meta-analysis”, Journal of the Academy of Nutrition and Dietetics, Vol. 114/9, https://doi.org/10.1016/j.jand.2014.05.014.
[98] Soares Guimarães, J. et al. (2020), “Ultra-processed food and beverage advertising on Brazilian television by International Network for Food and Obesity/Chronic non-communicable diseases Research, Monitoring and Action Support benchmark”, Public Health Nutrition, Vol. 23/15, pp. 2657-2662, https://doi.org/10.1017/S1368980020000518.
[99] Teng, A. et al. (2019), Impact of sugar-sweetened beverage taxes on purchases and dietary intake: Systematic review and meta-analysis, Blackwell Publishing Ltd, https://doi.org/10.1111/obr.12868.
[47] Toitumine.ee (2021), Magusad ja soolased näksid, https://toitumine.ee/kuidas-tervislikult-toituda/toidusoovitused/magusad-ja-soolased-naksid (accessed on 11 March 2021).
[84] Tucker, B. and K. Manaugh (2018), “Bicycle equity in Brazil: Access to safe cycling routes across neighborhoods in Rio de Janeiro and Curitiba”, International Journal of Sustainable Transportation, Vol. 12/1, pp. 29-38, https://doi.org/10.1080/15568318.2017.1324585.
[15] USDA (2020), Brazil Approves New Regulations for Food Labeling, United States Department of Agriculture, Foreign Agricultural Service.
[104] Vallgårda, S., L. Holm and J. Jensen (2015), “The Danish tax on saturated fat: Why it did not survive”, European Journal of Clinical Nutrition, Vol. 69/2, pp. 223-226, https://doi.org/10.1038/ejcn.2014.224.
[18] Verjans-Janssen, S. et al. (2018), “Effectiveness of school-based physical activity and nutrition interventions with direct parental involvement on children’s BMI and energy balance-related behaviors – A systematic review”, PLOS ONE, Vol. 13/9, https://doi.org/10.1371/journal.pone.0204560.
[43] Villinger, K. et al. (2019), “The effectiveness of app-based mobile interventions on nutrition behaviours and nutrition-related health outcomes: A systematic review and meta-analysis”, Obesity Reviews, Vol. 20/10, pp. 1465-1484, https://doi.org/10.1111/obr.12903.
[85] Vukmirovic, M. (2015), The effects of food advertising on food-related behaviours and perceptions in adults: A review, Elsevier Ltd, https://doi.org/10.1016/j.foodres.2015.05.011.
[17] Wang, Y. et al. (2015), “What childhood obesity prevention programmes work? A systematic review and meta-analysis”, Obesity Reviews, Vol. 16/7, pp. 547-565, https://doi.org/10.1111/obr.12277.
[50] Wargny, M. et al. (2018), “SMS-based intervention in type 2 diabetes: Clinical trial in Senegal”, BMJ Innovations, Vol. 4/3, pp. 142-146, https://doi.org/10.1136/bmjinnov-2018-000278.
[93] Watson, W. et al. (2017), “Advertising to children initiatives have not reduced unhealthy food advertising on Australian television”, Journal of Public Health, Vol. 39/4, pp. 787-792, https://doi.org/10.1093/pubmed/fdx004.
[61] WCRF (2018), NOURISHING framework, World Cancer Research Fund International, https://www.wcrf.org/sites/default/files/Improve-food-supply.pdf (accessed on 21 March 2021).
[48] WHO (2021), Be He@lthy, Be Mobile - Innovations, World Health Organisation, http://www.who.int/ncds/prevention/be-healthy-be-mobile/innovations/en/ (accessed on 11 March 2021).
[62] WHO Europe (2013), Mapping salt reduction initiatives in the WHO European Region, World Health Organisation, Europe Regional Office.
[1] WHO GHO (2020), Noncommunicable diseases: Risk factors, World Health Organisation Global Health Observatory, https://www.who.int/data/gho/data/themes/topics/topic-details/GHO/ncd-risk-factors (accessed on 9 March 2021).
[72] Wolfenden, L. et al. (2018), Strategies to improve the implementation of workplace-based policies or practices targeting tobacco, alcohol, diet, physical activity and obesity, John Wiley and Sons Ltd, https://doi.org/10.1002/14651858.CD012439.pub2.
[39] Wrieden, W. and L. Levy (2016), “’Change4Life Smart Swaps’: Quasi-experimental evaluation of a natural experiment”, Public Health Nutrition, Vol. 19/13, pp. 2388-2392, https://doi.org/10.1017/S1368980016000513.
[80] Xiao, C., Y. Goryakin and M. Cecchini (2019), Physical Activity Levels and New Public Transit: A Systematic Review and Meta-analysis, Elsevier Inc., https://doi.org/10.1016/j.amepre.2018.10.022.
[46] Yuka (2021), Yuka - The mobile app that scans your diet and cosmetics, https://yuka.io/en/ (accessed on 11 March 2021).