12. Iceland
Support to agriculture
In Iceland, reforms of agricultural policies have been limited and the level of support remains among the highest within the OECD. At 57% of gross farm receipts, the PSE was more than three times the OECD average in 2017-19. Total support to agriculture (TSE) has averaged 1% of the country’s GDP in recent years, with support to farmers (PSE) being the dominant component (a share of 96%). The remaining part of TSE is financing general services (GSSE), with almost half comprised of expenditures for inspection, and public stockholding expenditures responsible for much of the remainder.
Most agricultural support continues to be provided through market price support measures, principally through high tariffs that help to maintain high domestic prices relative to world prices, and therefore lead to a large transfer from consumers to agriculture producers. Market price support is complemented with a payment entitlements system, which is directly or indirectly coupled with production factors. Market price support accounted for 55% of the support to farmers in 2017-19. Output payments for milk producers and largely decoupled payments to sheep meat producers represent most of the remaining support to farmers. Consequently, 73% of farm support is provided in forms that are potentially the most distorting to production and trade.
Main policy changes
The main policy changes of 2019 included revisions of the agreements on the operating environment for sheep farmers and cattle farmers. For sheep farming, the revision entails the introduction of voluntary financial support for up to four years to help sheep farmers to diversify their operations to other activities, while for cattle farming, the milk-quota system remains unchanged. Revisions of agreements on horticulture and the framework agreement (horizontal support) of agriculture are expected to be finished in 2020. All revised changes of existing agreements entered into force on 1 January 2020. Negotiations between EFTA and MERCOSUR were concluded in 2019.
Assessment and recommendations
Within the continued application of the multi-year agreements between the government of Iceland and the Farmer’s Association, changes to overall agricultural policy are limited, and Iceland’s support to farmers remains well above that of most other OECD countries. Moreover, most of the support to farmers continues to be provided in forms that are potentially most production and trade distorting and contribute to environmental degradation, in particular soil erosion. The revisions of the agreements on the operating environment for sheep farmers and cattle farmers maintain the status quo, hindering the reform process to make Iceland’s agricultural sector more responsive to market forces.
Support to producers is only partly conditional on meeting environmental performance standards. Greenhouse gas emissions from agriculture are high, reflecting the important role of sheep raising within the sector. Overgrazing also contributes to soil erosion on half of the country’s surface, damaging biodiversity and weakening flood control. Agricultural subsidies are economically distorting and contribute to environmental degradation, in particular soil erosion. Producer support should be decoupled from agricultural production and moved towards less economically distorting and environmentally damaging forms, essentially by linking subsidies to sustainable land management and the production of environmental amenities.
Despite progress in reducing border protection of some agricultural products, tariffs on several agricultural product groups – particularly meat, dairy, plants and flowers – remain high, and are often applied in the form of complex non-ad valorem duties. Slow progress in this area would perpetuate the burden to consumers and the distortions to markets associated with border protection.
Further progress is needed in supporting innovation, including by encouraging a well-functioning agricultural knowledge and information system, for which public expenditures have been declining over the past decade.
The effects of climate change could be favourable for agriculture in Iceland, although pests such as invasive insects may become a greater threat, introducing new challenges to the sector. Measures advocated in the new Climate Change Strategy, such as phasing out fossils fuels in transport and increasing carbon sequestration in land use, are a welcome shift towards a low-carbon economy and could contribute to increased efficiency in the use of natural resources. Consideration should also be given to broadening the environmental tax base for the country’s carbon tax by expanding it to cover agriculture.
Policy responses in relation to the COVID-19 outbreak
On 11 March 2020, the government presented an ISK 230 billion (8% GDP) response package to the COVID-19 outbreak. Key measures to support households and firms include tax cuts, tax deferrals, increased unemployment benefits, one-off child allowances, support to companies whose employees have been quarantined, and state-guaranteed bridge loans to companies. Most of the larger measures presented by the government are applicable to the agro-food sector as well as other sectors.
More specific measures related to the agro-food sector include more emphasis on supporting horticulture, increased advisory services due to COVID-19, documentation of loss of produce, ensuring salaries for temporary workers if farmers get sick and a dashboard of statistics for the agro-food sector.
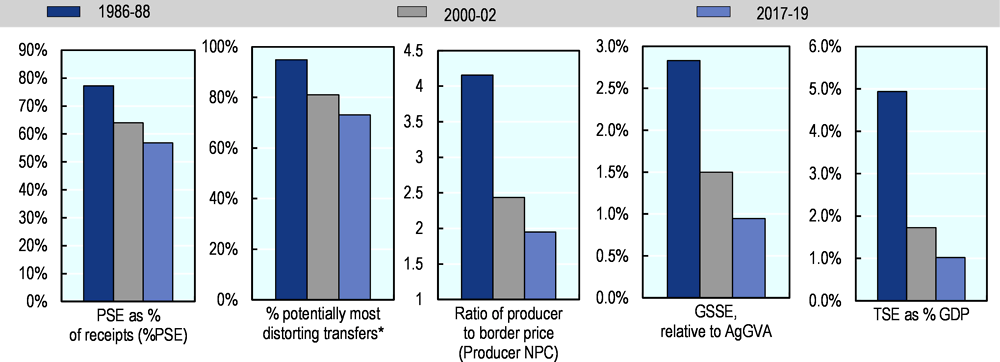
Note: * Share of potentially most distorting transfers in cumulated gross producer transfers.
Source: OECD (2020), “Producer and Consumer Support Estimates”, OECD Agriculture statistics (database), https://doi.org/10.1787/agr-pcse-data-en.
Support to producers (%PSE) has declined since md-1980s. But at 57% of gross farm receipts in 2017-19, it is still three times higher than the OECD average. Transfers considered as the potentially most distorting support represent 73% of the total PSE (Figure 12.1). The level of support in local currency increased in 2019 mainly due to an increase in budgetary payments, which more than offset the decrease in the price gap between domestic and border prices. The decrease in the price gap stemmed primarily from the devaluation of the ISK against the USD: the resulting increase in reference prices in national currency more than offset the increase in average producer prices (Figure 12.2). Effective prices received by farmers, on average, have declined over time, but still remained almost twice as high as those in the world markets. The sectors with the largest divergence between domestic and world prices in 2017-19 are poultry, eggs and wool. Market price support accounts for more than 70% of Single Commodity Transfers (SCT) for poultry and eggs (Figure 12.3). Overall, SCT represent 97% of the total PSE. The expenditures for general services relative to agricultural value added decreased from around 3% in 1986-88 to 1% in 2017-19; half of these expenditures are for inspection and control. Total support to agriculture as a share of GDP has declined significantly over time.
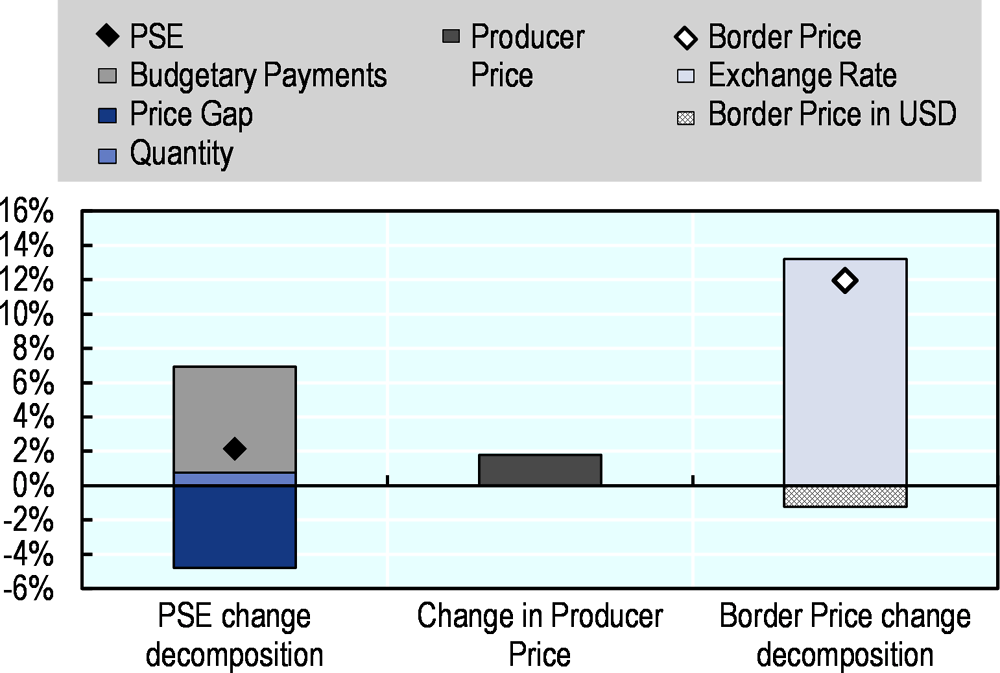
Source: OECD (2020), “Producer and Consumer Support Estimates”, OECD Agriculture statistics (database), https://doi.org/10.1787/agr-pcse-data-en.
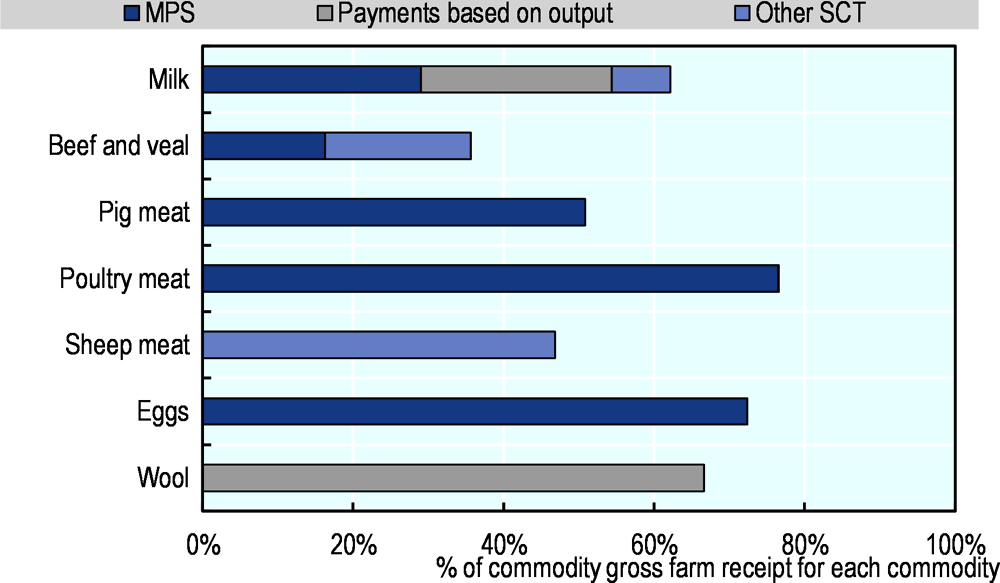
Source: OECD (2020), “Producer and Consumer Support Estimates”, OECD Agriculture statistics (database), https://doi.org/10.1787/agr-pcse-data-en.
Contextual information
Iceland is a small, sparsely populated economy with a GDP per capita above the OECD average. Agriculture (excluding fish) is a relatively small part of the economy, representing 1% of GDP and of employment, and it remains small compared to fishing and aquaculture. Approximately one-fifth of the total land area of Iceland is agricultural land, mostly suitable for fodder production and livestock raising. Only around 6% of this area is arable land.
Livestock-rearing is the main farm activity, with milk and sheep meat being the most important products. Traditional livestock production is grassland-based and most farm animals are native breeds. The main crops are hay, cereals for animal feed and vegetables – the latter are cultivated primarily in greenhouses heated with geothermal energy. The main agricultural exports are pure-bred horses for breeding, sheep meat products and fur skins. Iceland is a net importer of agricultural products (excluding fishery goods), mainly for final consumption. Imports are more diversified than exports, and have increased steadily in recent years.
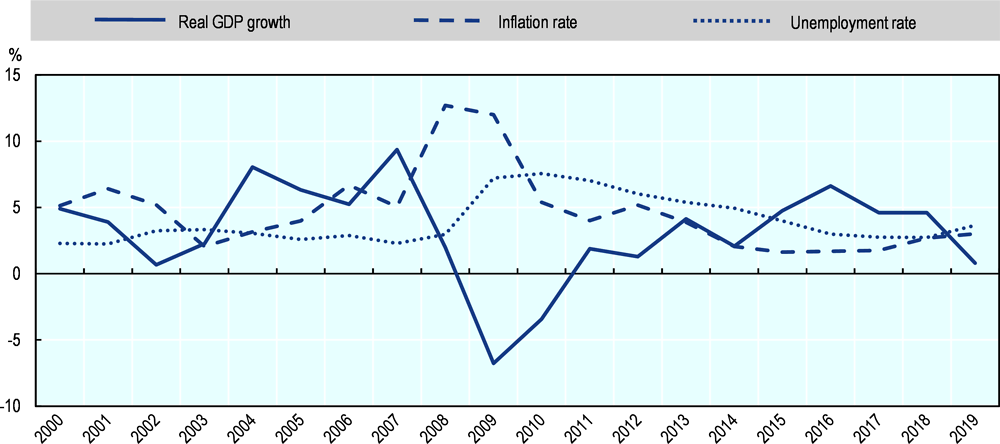
Iceland’s economy continues to grow, and the country’s living standards and well-being are high (OECD, 2019[1]).1 The unemployment rate remains low, at around 3%, and the country is one of the most egalitarian economies of the OECD. Historically, Iceland’s prosperity has been built on the sustainable management of its abundant natural resources, including the comprehensive fisheries management system based on individual transferable quotas, renewable energy (geothermal and hydro) and carbon sequestration opportunities (afforestation, revegetation). The government plans to make the economy largely carbon neutral by 2040.
Sources: OECD statistical databases; World Bank, WDI and ILO estimates and projections.
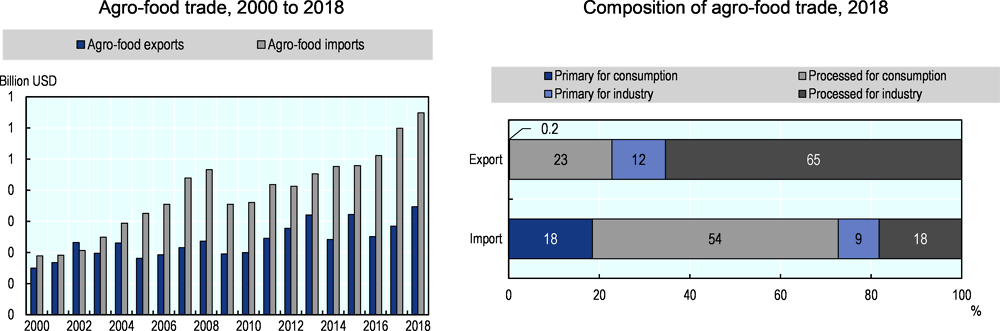
Note: Numbers may not add up to 100 due to rounding.
Source: UN Comtrade Database.
While output growth in agriculture has been below the global average over the 2007-16 period, according to the estimates, agricultural total factor productivity has grown by 2.8% per year – higher than the global average rate of 1.6%. A harsh climate, lack of suitable land, small average farm size, and the narrow genetic base for traditional livestock present significant constraints to the sector. Due to relatively low livestock densities, Iceland’s nutrient balances show a comparatively low surplus of both nitrogen and phosphorous. Iceland has the lowest pesticide sales per hectare in the OECD area and the sector’s use of energy has fallen over time. Agriculture continues to represent a significant share in the country’s total GHG emissions – well above the OECD average – mainly due to the importance of the livestock sector. Emissions of CH4 and N2O have historically accounted for over 99% of the total emissions from agriculture, with less than 1% arising from CO2.
The sector’s share in water consumption has increased over the past twenty years and is higher than the OECD average. The water stress indicator has also increased, but is substantially lower than the OECD average. Water shortage is not a major concern and policy issue.
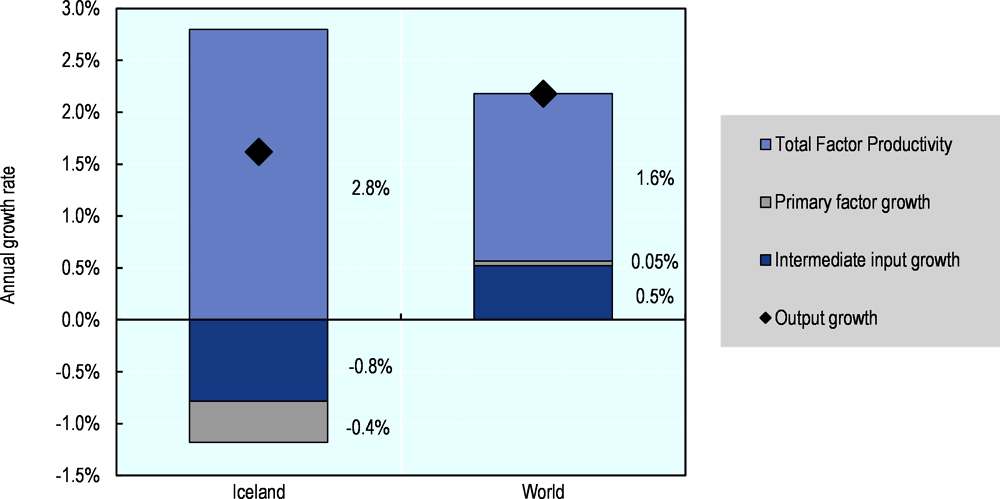
Note: Primary factors comprise labour, land, livestock and machinery.
Source: USDA Economic Research Service Agricultural Productivity database.
Description of policy developments
Main policy instruments
The strategic objective of Iceland’s agricultural policy is to maintain and strengthen a diverse agricultural sector, to the extent that physical and marketing conditions allow. The key goals of policy are: to meet domestic demand where realistically possible; to maintain sustainable production of high quality and healthy products; to improve efficiency and competitiveness; to improve farmers’ incomes; to improve creativity and create job opportunities; and to sustain livelihoods in rural areas.
Agricultural policies in Iceland are based on two main legal acts: i) Act No. 99/1993 on the Production, Pricing and Sale of Agricultural Products (known as the “Act on Agricultural Produce”), which lays down the policy framework as well as provisions for production control, provisions for slaughter and processing, market measures and producer support; and ii) Act No. 70/1998 on Agriculture, which provides the legal basis for development projects, extension services and livestock improvements.
Under these Acts, there are a number of renewable multi-year agreements between the government and the Farmer’s Association, which provide the general framework for support and production control for farmers in the cattle, sheep and horticultural sectors. There is also an agreement on so-called horizontal support, such as advisory services, breeding, animal welfare, environmental protection, sustainable land management, organic farming and land cultivation. Furthermore, through the Agricultural Productivity Fund, funds are allocated for development projects in the horticultural, cattle and sheep sectors, as well as for increasing employment in rural areas.
The agreements currently in force cover the ten-year period from 2017 to 2026, with extensive reviews scheduled in 2019 and 2023. In 2019, the agreements for sheep farming and cattle were revised and changes entered into force in 1 January 2020. Revision for the agreements on horticulture and horizontal support are both underway and expected to be completed in 2020.
Iceland’s agricultural support is provided through price support (maintained by border measures) and through direct payments, which are based on payment entitlements that are coupled with production factors. Price support is provided for all livestock products and some horticultural products. Direct payments are provided to cattle (mainly dairy) and sheep producers, and on a smaller scale, to certain greenhouse producers.
For dairy, direct payments are based on the size of a producer’s quota and the current number of animals. Headage payments are provided for up to 180 dairy cows and 260 beef cows per farm, with full payment for each of the first 50 dairy cows and 200 beef cows, then at a declining rate for each additional cow. There is a national dairy production quota, which is set each year by the Ministry of Fisheries and Agriculture and is divided among producers based on their annual quotas. Annual quotas also determine the entitlements for direct payments. Production in excess of quotas is permitted, provided all such production is for exports only. Wholesale prices are regulated for approximately half of all dairy products. A government-chaired committee, representing both the Farmers’ Association and the labour union (which in this instance acts on behalf of consumers), determines guaranteed minimum prices for milk delivered within production quotas on an annual basis. Trade in support entitlements (basic payments to all active dairy and cattle farmers) between entitlement holders is allowed with quantity limitations, and takes place in a market operated by the government. Dairy producers also benefit from support for breeding, land cultivation and development programmes.
For sheep, direct payments are linked to payment entitlements that were originally based on historical production. Keeping a minimum number of winter-fed sheep on the farm, in relation to the entitlements is, however, required for eligibility to receive full payments. Additional payments to sheep farmers are related to a quality control scheme for lamb meat, based on animal welfare, product quality, traceability and sustainability criteria. Different premium payments are provided at the wholesale level for purchasers of wool, and to farmers to co-operate in order to increase added value for sheep products.
Imports of meat, dairy products, and some vegetables that compete with domestic production, are subject to tariffs, which are often compound duties with an ad valorem component of 30% and a specific duty component that varies from ISK 5/kg (USD 0.04/kg) to ISK 1 462/kg (USD 2/kg). However, products originating in partner countries of the European Economic Area (EEA), or in one of the 41 countries with which Iceland has free trade agreements, may carry lower tariffs. The agreement for the cattle sector included a provision to change the specific duties for certain cheese and milk powder products based on changes to the SDR/ISK exchange rate from 1995 to 2016 effective from 1 March. Since then the specific component (ISK/kg) was adjusted annually by the 12-month development of SDR/ISK. Export subsidies for agricultural products have not been provided since the early 1990s.
Concerning Iceland’s climate change commitments under the Paris Agreement on Climate Change, according to its Nationally Determined Contributions (NDCs) submitted to the UNFCCC, Iceland aims to be part of a collective delivery by European countries to reach a target of 40% reduction in GHG emissions by 2030 compared to 1990 levels. A precise commitment for Iceland within this collective delivery is yet to be determined and is dependent upon an agreement with the European Union and other countries. Iceland’s participation in the EU Emissions Trading System will be key in that regard, considering that almost half of Iceland’s emissions would be regulated through this scheme.
Iceland is a member of the European Economic Area (EEA) and of the European Free Trade Association (EFTA). While the EEA Agreement does not apply to most trade in agricultural goods, it opens trade in a number of processed agricultural products and encourages bilateral agreements on primary commodities.
As a member of EFTA, Iceland is also party to several additional free trade agreements, including with countries in Southeast Europe, North Africa and the Middle East, Latin America, and Asia, as well as with the South African Customs Union. In addition to agreements under the FTA, Iceland has bilateral Free Trade Agreements with the Faroe Islands, Greenland and the People’s Republic of China.
Domestic policy developments in 2019-20
In 2019, the government of Iceland and the Farmer’s Association reached an agreement on a revision of both the agreements on the operating environment for sheep farmers and cattle farmers. For sheep farming, a key element of the revision is the introduction of voluntary financial support for up to four years to help sheep farmers to diversify their operations to other activities. Following the revision of the agreement, a headage payment to sheep will not be introduced ‒ as originally expected ‒ in 2020.
For cattle farming, the revised agreement retains the existing milk-quota system. As a result of the revision process, three temporary committees were established to work on proposals for future developments within the cattle and dairy industry. These committees consist of representatives from the government, farmers, consumers and the dairy industry. They are mandated to examine issues concerning: mitigation measures to make the sector carbon neutral by 2040; changes in the arrangement of dairy wholesale pricing and the guaranteed minimum prices to farmers for milk delivered within production quotas; and promoting competition for the dairy market.
The milk production quota was set at 145 million litres in 2019 and remains at that level in 2020. Production in excess of the quota must be exported. Payments to farmers are made in equal monthly payments of one-twelfth of the annual quota. In 2019, the minimum price paid by dairies for milk delivered within the production quota was set at ISK 92.7 (USD 0.76) per litre.
Revisions of the agreement on the operating environment for horticultural producers and the agricultural framework agreement are underway, and are expected to be finalised in 2020.
The Climate Strategy launched in 2018 aims for the country to be carbon neutral before 2040. The strategy consists of 34 measures ranging from the phasing out of fossil fuels in transport to measures aiming to increase carbon sequestration in land use (including afforestation and revegetation). The government also supports efforts to reclaim drained wetlands, which in recent years have been shown to be a significant source of carbon emissions. For agriculture, two measures are currently planned with the objective of reducing GHG emissions: reducing the use of non-organic fertilisers, and improving manure management. In addition, the Icelandic Sheep Farmers’ Association has plans for sheep farming to become carbon neutral by the year 2027. A collaboration between the Ministry for the Environment and Natural Resources, the Ministry of Industries and Innovation, the Icelandic Agricultural Advisory Centre, the Icelandic Forest Service and the Soil Conservation Service of Iceland is underway to define the actions to be undertaken. As of February 2020, no final plan of action has been agreed upon.
In October 2019, the European Union, Iceland and Norway formally agreed to extend, for the period 2021-30, the climate co-operation by including the Effort Sharing Regulation and the Regulation on greenhouse gas emissions and removals from land use, land use change and forestry (the LULUCF-regulation), into the EEA Agreement. According to the agreement, Iceland is to fulfil its respective greenhouse gas emission reduction target for the period 1 January 2021 to 31 December 2030 in accordance with the ETS-directive, LULUCF-Regulation and the Effort Sharing Regulation.
Trade policy developments in 2019-20
Following the new EEA Agreement on trade in agricultural products and the gradually increasing tariff quotas, the Minister of Fisheries and Agriculture appointed a committee to work on proposals for changes of the regulatory framework for agricultural trade in order to reduce costs for importers of agricultural products and to simplify the system. As a result, several legal changes – mainly in the system of tariff quotas allocation and the elimination of tariff duties on certain vegetables, flowers, wild game and fertile eggs for the year or a certain period during the year – took effect in the beginning of 2020 which reduce import costs and increase transparency with regards to imports of agricultural products.
As a member of EFTA, Iceland is currently engaged in negotiations with several countries regarding free trade agreements; negotiations between EFTA and MERCOSUR were concluded in 2019. The Agreement provides for tariff concessions such as the gradual elimination of duties, tariff preferences and tariff rate quotas (TRQs) on both basic and processed agricultural products. Agricultural exports to benefit from the Agreement include cheese, coffee, chocolate, lamb meat, spirits, sweets, waters, energy drinks and wines. In return, EFTA States offer concessions for agricultural imports of high importance to Mercosur. According to the new legislation that entered into force 1 January 2020 on the protection against animal diseases, imports of fresh meat and meat products, raw eggs and raw egg products, and unpasteurised milk and dairy products processed from unpasteurised milk from EEA States, do not require the permission of the Food and Veterinary Authority.
References
[1] OECD (2019), OECD Economic Surveys: Iceland 2019, OECD Publishing, Paris, https://dx.doi.org/10.1787/c362e536-en.
This document, as well as any data and map included herein, are without prejudice to the status of or sovereignty over any territory, to the delimitation of international frontiers and boundaries and to the name of any territory, city or area. Extracts from publications may be subject to additional disclaimers, which are set out in the complete version of the publication, available at the link provided.
https://doi.org/10.1787/928181a8-en
© OECD 2020
The use of this work, whether digital or print, is governed by the Terms and Conditions to be found at http://www.oecd.org/termsandconditions.