Chapter 1. The context of Moldova’s economic regulatory system for water supply and sanitation
This chapter presents the context within which the economic regulatory system (ERS) for water supply and sanitation (WSS) in the Republic of Moldova (hereafter “Moldova”) has to operate. It confronts ambitious sector policy objectives driven by the Association Agreement with the European Union (the EU water acquis), the Paris Agreement on Climate and WSS-related Sustainable Development Goals, and set out in the National Development Strategy (Moldova 2020) and the WSS strategy for 2014-28. It compares performance of the Moldova’s WSS sector with its Danube Region peers highlighting several challenges such as non-revenue water, customer satisfaction and operating cost coverage. Finally, it formulates nine demands on the economic regulatory system (ERS).
Background
Economic regulation can be defined as all rules, procedures, practices, institutions, standards and norms, that set, monitor, enforce the economic aspects (tariffs, service standards) of water supply and sanitation (WSS) under given policy objectives (Castalia, 2005). As a natural monopoly sector, WSS requires economic regulation, either by contract (e.g. like in public-private partnership arrangements not yet in use in Moldova’s WSS), or by competent regulatory authority (i.e. a professional regulator).
The Republic of Moldova (hereafter “Moldova”) took important steps forward in the development of its economic regulatory system (ERS) for WSS with the adoption of Law 303 on Water Supply and Sanitation in 2013. This led to the nomination of the National Energy Regulatory Agency of the Republic of Moldova (ANRE) as the competent regulatory authority for WSS in 2014.
A sound ERS, however, includes much more than the establishment of a regulator. The 2000 Almaty Ministerial conference provided an idea of what one may expect from a sound ERS (OECD EAP Task Force, 2000[1]):
-
economic efficiency i.e. ensuring the best possible use of resources for the most productive outcomes
-
cost recovery i.e. providing revenues to meet the costs of operations, maintenance and administration
-
fairness i.e. treating all customers equally and excluding any abuse of market power by the natural monopoly
-
financial stability i.e. minimising revenue fluctuation
-
resource conservation and resource use efficiency by providing environmental and economic incentives, respectively
-
social orientation of water services, without making the water utility a social agency.
In the context of transition countries, it is possible to add (OECD EAP Task Force, 2000[1]):
-
ruling out of unfunded mandates in the environmental, social and public obligation sphere
-
simplicity and “understandability”.
To ensure the above outcomes, it is required to:
-
provide the right governance of the regulatory agency
-
ensure the proper integration, co-ordination and communication with the other constituents of the ERS.
Moldova’s ERS has to perform within two important contexts:
-
“Policy”: the internal and external policy objectives of Moldova.
-
“Capacity”: the characteristics of the WSS providers and their stakeholders, including in terms of number, production capacity, operations, physical condition and financial situation.
“Policy” sets the ambition. It provides direction on what must be achieved or accommodated by the ERS. Internationally, Moldova has committed to WSS-related objectives in the Association Agreement with the EU and the Sustainable Development Goals (SDGs), as well as the Paris Agreement on Climate. National strategy and policy documents also reflect commitments to WSS-related goals. Both international and domestic commitments are further described in section 1.2.
“Capacity” constrains the policy ambition. The WSS sector in Moldova faces challenges that will make it hard to absorb funds, regionalise, increase tariffs, co-finance, plan and manage projects required for compliance with the policy objectives.
As suggested in Figure 1.1, balance is needed between policy ambition and financial and human resources, planning, management and absorption capacity. A sound ERS would aim to achieve the balance and maintain it

Source: Author's own elaboraion
Policy objectives
The policy framework for WSS in Moldova is explicit. Its targets are defined in:
-
Moldova’s Association Agreement with the EU
-
SDGs and Paris Agreement
-
National policies and strategies (incl. WSS and adaptation to climate change) (UNDP, 2009[2])
Association Agreement
The 2014 Association Agreement (AA) with the EU became effective as of 1 July 2016. The AA foresees in particular compliance with the relevant EU water directives. These include:
-
Water Framework Directive (WFD)
For Directive 2000/60/EC of the European Parliament and of the Council of 23 October 2000 establishing a framework for Community action in the field of water policy as amended by Decision No 2455/2001/EC, the AA provides for the following:
-
adoption of national legislation and designation of competent authorities within three years of the AA becoming effective
-
analysis of River Basin Districts (RBDs) and establishing programmes for monitoring of water quantity and quality within six years
-
preparation, consultation and publication of RBD management plans within eight years.
-
-
Urban Waste Water Treatment Directive (UWWTD)
For Council Directive 91/271/EEC of 21 May 1991 concerning urban wastewater treatment as amended by Directive 98/15/EC and Regulation (EC) No 1882/2003, the following timetable has been agreed:
-
adoption of national legislation and designation of competent authority/authorities within three years
-
assessment of the status of urban wastewater collection and treatment within five years
-
identification of sensitive areas and agglomerations within six years
-
preparation of technical and investment programmes for the implementation of the urban wastewater treatment requirements within eight years.
-
-
Flood Risk Directive
For Directive 2007/60/EC of the European Parliament and of the Council of 23 October 2007 on the assessment and management of flood risks, the AA provides the following implementation deadlines:
-
adoption of national legislation and designation of competent authority(ties) within three years
-
preliminary flood assessment within four years
-
preparation of flood hazards maps and flood risks maps within six years
-
establishment of flood risk management plans within eight years.
-
-
Drinking Water Quality Directive
For Council Directive 98/83/EC of 3 November 1998 on the quality of water intended for human consumption as amended by Regulation (EC) No 1882/2003, the AA provides for the following implementation deadlines:
-
adoption of national legislation and designation of competent authority (ties) within three years
-
establishment of standards for drinking water within four years
-
establishment of a monitoring system and a mechanism to provide information to consumers within six years.
-
-
Nitrates Directive
Council Directive 91/676/EEC of 12 December 1991 concerning the protection of waters against pollution caused by nitrates from agricultural sources as amended by Regulation (EC) No 1882/2003 is to be implemented with the following deadlines:
-
adoption of national legislation and designation of competent authority/authorities within three years
-
identification of polluted waters or waters at risk and designation of nitrate vulnerable zones and establishment of action plans and codes of good agricultural practices for nitrate vulnerable zones within five years.
-
Implementation of the above directives is costly. WSS customers will pay the bulk of compliance costs. Only the cost of compliance with the pollution directive may be borne by agriculture and industry. Climate adaptation measures covered by the AA will be an additional cost for WSS, although not that significant (OECD EAP Task Force, 2013[3]). Section 2.4 provides estimates for the associated costs.
Article 9 of the WFD provides for two principles that have far-reaching consequences for the ERS:
-
1. Full cost recovery i.e. the costs of WSS shall include not only operation and capital costs, but also the environmental and resource costs associated with the consumption of the service.
-
2. Polluter pays principle i.e. the cost of environmental degradation is borne by the person that causes it. This may also be regarded as an application of the first principle.
The two principles imply that WSS consumers will eventually pay for the full costs of service provision. In most cities, including Chisinau, the present tariffs represent only a part of the full costs. Annex A provides a table on the tariff rates charged in all 40 main service areas.
Sustainable development goals
The second series of high-level policy objectives is the WSS-related Sustainable Development Goals (SDGs). SDG6 is to ensure availability and sustainable management of water and sanitation for all. The SDG6 objectives are an elaboration of the human right to water that entitles everyone to sufficient, safe, acceptable, physically accessible and affordable water for personal and domestic uses (UN CESCR – General Comment 15, para 2). The main commitments made under Goal 6 Water and Sanitation are (to be achieved by 2030, unless indicated differently below):
-
Achieve universal and equitable access to safe and affordable drinking water for all (100% of population).
-
Reduce water pollution.
-
Increase water-use efficiency.
-
Introduce integrated water resource management (IWRM) at all levels, including transboundary.
-
Protect and restore water-related ecosystems (by 2020).
For each of the SDG6 objectives, indicators have been formulated. Table 1.1 provides all SDG6 goals and indicators.
Some of the remaining 16 SDGs also relate to WSS, such as SDG11 (sustainable cities and communities) and SDG13 (climate action). Progress on indicators is to be monitored at country level. With support of the United Nations Development Programme (UNDP), Moldova has completed identification of data sources and owners. There is still a lot of work ahead to monitor progress in Moldova adequately. Data were available for only three of ten SDG6 indicators when this report was finalised.
Furthermore, the global SDGs must be translated into domestic priorities and integrated into policy and budgetary frameworks. Preliminary UNDP analysis shows most SDG6 objectives are only partially aligned with national policy due, for instance, to ambiguity or inconsistency in national policies. There is work ahead here as well towards establishing national targets and indicators to monitor progress. Fortunately, the water-related articles of the EU Association Agreement are well aligned with SDG6 objectives.
Preliminary analysis on adaptation of the SDGs to domestic priorities also shows that Moldova intends to deliver on some SDG objectives well before 2030 – those covered already under specific targets of national policy and strategy.
The Paris Agreement on Climate underlines the ambitions with respect to the SDGs for Moldova. Its impact on the demands on the ERS is therefore not further analysed here.
National policy and strategy
In addition to external commitments, the following domestic policy documents determine expectations from the ERS in the years to come. These are:
-
National Development Strategy (Moldova 2020)
From the three domestic WSS-related documents, the National Development Strategy (NDS) is the highest in ranking. This is because it has been developed as an over-arching socio-economic strategy by a number of collaborating ministries.
According tovarious studies, access to clean water and sanitation is one of the most cost-effective development interventions and is critical for reducing poverty. It is therefore remarkable that the NDS only mentions water sporadically compared to, for instance, education and transport. In fact, access to water is often a condition for education and increased mobility. It is not possible to derive concrete WSS-related policy objectives from the NDS.
-
Water Supply and Sanitation Strategy (2014 – 2028)
The national Water Supply and Sanitation Strategy is concerned with the plan to comply with the EU acquis, including its financing. It schedules investment priorities as follows:
-
1 400 km network extension for water supply
-
511 km for network extension for wastewater sewerage
-
42 new or rehabilitated water treatment plants (WTPs)
-
49 new or rehabilitated wastewater treatment plants (WWTPs).
The strategy speaks out in favour of regionalisation of services to improve absorption capacity and management and to reduce operating costs.
-
National Environmental Strategy (2014 – 2023)
Water scarcity in Moldova is already foreseen by the 2020s or, at latest, by the early 2030s (UNDP, 2009). In the absence of climate change adaptation measures, this will create a barrier for further economic development. The National Environmental Strategy includes adaptation to climate change, targets on access to WSS, wastewater treatment and sludge management.
An important objective is to ensure access to safe piped water supply for 80% of the population and to sanitation systems and services for 65% of the population by 2023 (see Table 1.2). This degree of coverage has been achieved for the urban population. However, 55% of the population in Moldova lives in rural areas, making achievement of the target a formidable challenge.
The WSS strategy was developed in 2011/12 and officially approved in March, 2014, whereas the National Environmental Strategy was developed in the years thereafter. The two strategies are government-endorsed documents with the same status; one does not follow from the other. The government of Moldova is committed to implementation of both documents (as well as to the implementation of the NDS).
Water supply and sanitation sector performance
Moldova’s ambitious policy agenda is to be realised in a developing institutional and regulatory environment and also in severe economic hardship. At purchasing power parity (PPP), gross domestic product (GDP) per capita in Moldova is just 55% of the average for countries in South Eastern Europe (SEE) that are non-EU members. This ranks Moldova as by far Europe’s poorest country. Figure 1.2 provides a snapshot of the capacity of the WSS sector in Moldova. Annex 1.A compares indicators of Moldova’s WSS sector with those of non-EU and Danube Region average values.

Source: author’s own elaboration based on data from the Water and Wastewater Services in the Danube Region project’s web-site: www.danube-water-program.org (accessed 13 June 2017).
The WSS sector in Moldova is well behind its Central and South East European peers with respect to:
-
Access to WSS, which is around 65% for water and still significantly lower for sanitation.
-
Wastewater treatment, at 24% of the population connected.
-
Staff levels are two-three times above benchmark levels of three-five staff per thousand connections: water plus wastewater.
-
Affordability of service, which for most of the population is above 5% of household expenditures, as illustrated by the recent affordability assessment (see Figure 2.5). Investment from utilities’ own resources in WSS per capita is on average 30% below other non-EU countries in SEE. It is 90% below the Danube average (i.e. including also new EU member states in the Danube basin).
While at least in line with the Central and South East European average, significant challenges remain in several other fields (Pienaru et al., 2014):
-
non-revenue water (presently at 41%)
-
customer satisfaction
-
operating cost coverage (presently at 0.99 compared to a benchmark of 1.5) (see Table 1.3 and Figure 1.3 for more details).
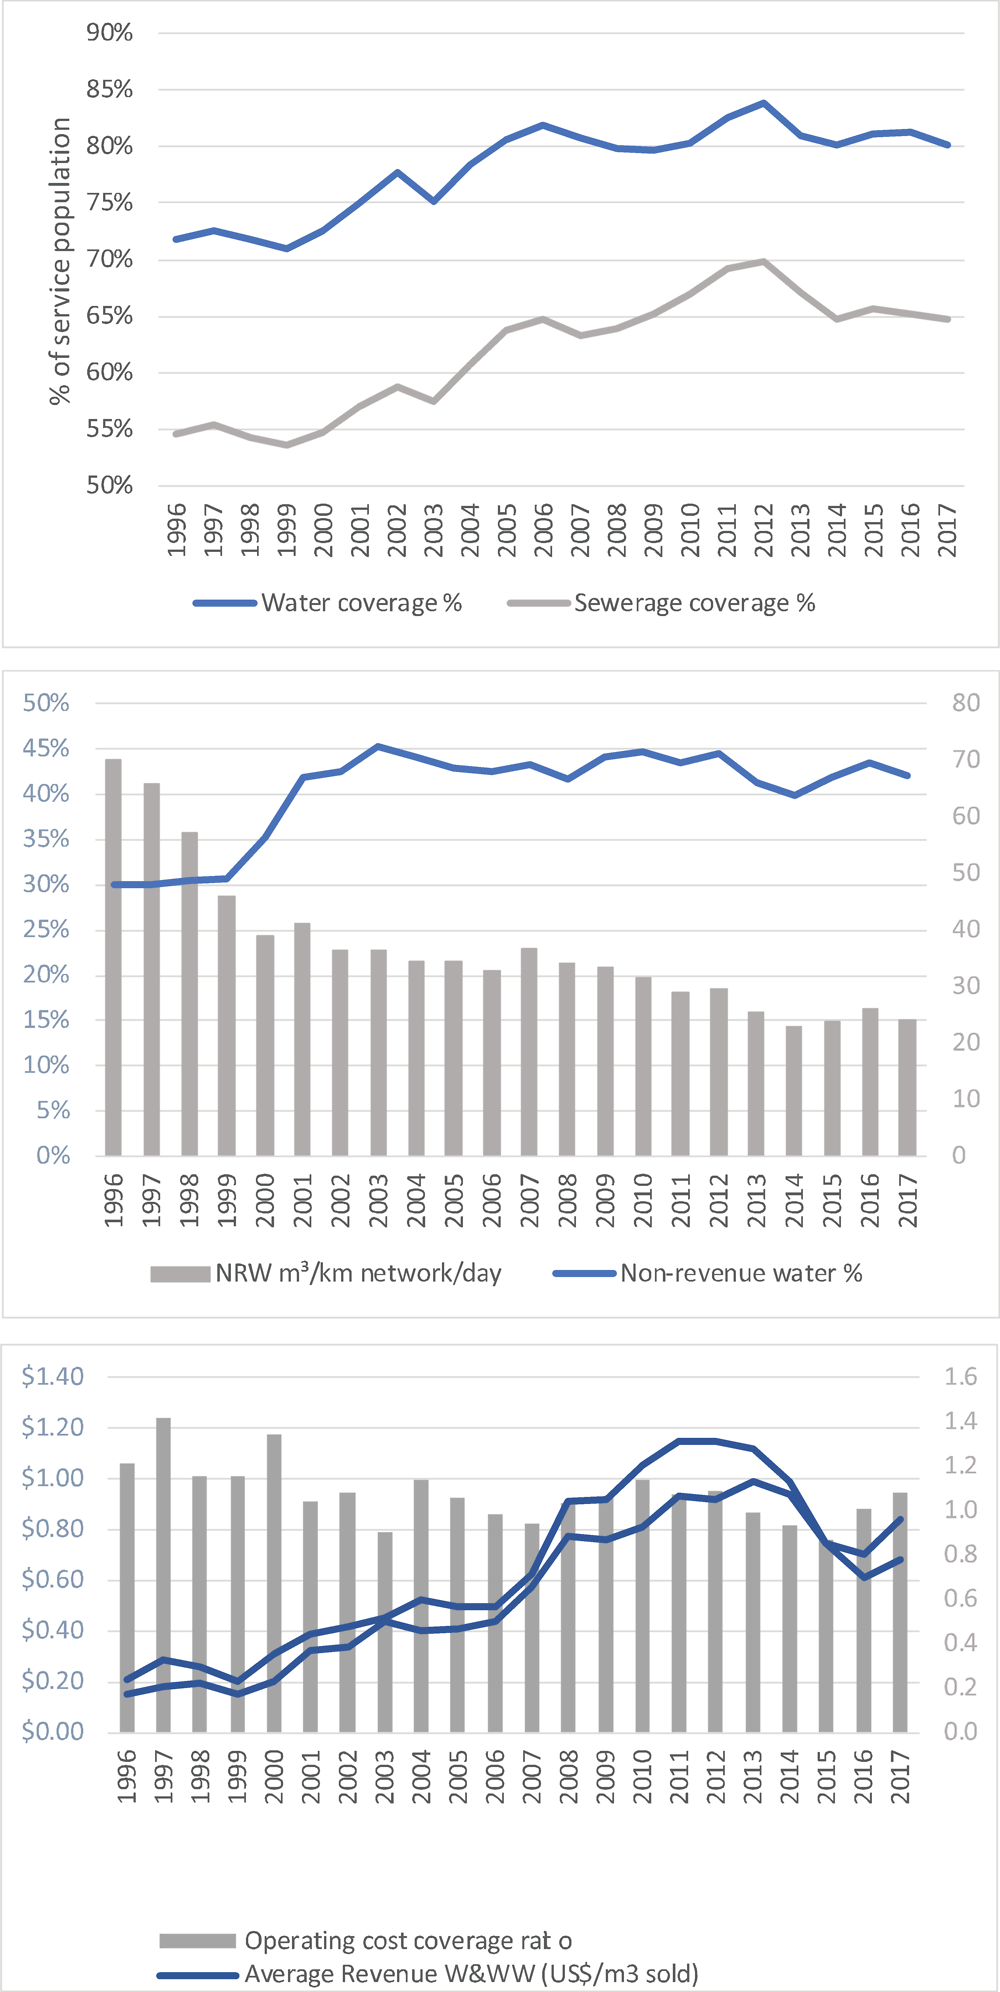
Source: Author’s own elaboration based on data from the IBNET database, www.IB-NET.org (accessed on 5 April 2017)
Demands on ERS for WSS in Moldova
Given the disparity between the limited capacity (human resources, financial, absorption) of the sector and the ambitious policy commitments, the demand on the ERS in Moldova is intense. There are nine demands on ERS that can be derived from the policy objectives:
1. Monitor and steer towards improved performance in WSS and on incentives for efficiency.
Rather than applying fixed standards, the ERS shall trigger developments leading to improved performance. Two key factors are increased transparency and negotiations with utilities on performance improvement trajectories, including for staff, non-revenue water, specific energy consumption, etc. This shall be done on the basis of business plans (or corporate development plan).
2. Focus regulatory efforts on large, regionalised entities.
Romania and Kosovo are seen as successful examples of regionalisation. Following their practice, the ERS in Moldova may consider leaving the economic regulation of small, non-regionalised entities completely to municipalities.
3. Facilitate the emergence of sustainable business models in WSS.
The traditional municipal water utility (Apacanal) model is not the standard solution or panacea for the sector’s challenges. Regionalisation of WSS services has been foreseen on paper, but is hardly functioning in practice. Apart from horizontal integration, a number of alternative solutions may be suitable in particular service areas. These include reconsidering and facilitating:
-
the right degree of vertical integration
-
the optimal combination of water production, distribution, sewerage and wastewater treatment may differ across regions and between rural and urban areas
-
the use of private sector participation, including outsourcing services.
4. Allow for tariff increases to fund operation of WWTPs.
When WWTPs become operational, tariffs must be increased to cover the jump in operating costs. If tariffs do not rise, WWTPs won’t have enough cash flow to start operations.
5. Offer well-targeted mechanisms for protection of poor and vulnerable citizens.
Considering the necessary increases in tariffs and the human right to WSS, social safety nets are needed to ensure access for poor and vulnerable citizens.
6. Set the overall affordability constraint for the population within which tariffs may rise.
Unlike most SEE countries, the overall affordability constraint in Moldova is real. For some service areas, average expenditure on WSS is already above the commonly used threshold of 4% of household expenditure. A clearly defined affordability ceiling is needed. To meet affordability criteria, rural service areas may have to merge with richer, urban areas. A uniform tariff would be applied through the service area with the richer areas cross-subsidising the poorer ones.
7. Recognise the need to bridge the funding gap through (affordable) loans and other forms of market-based (repayable) external finance.
The foreseen peak in capital expenditure cannot be covered by tariffs, transfers and taxes (3Ts) alone. Such peaks require external, repayable finance, mostly through loans from international financial institutions (IFIs). This can bridge, but not close, the funding gap; only the 3Ts can close it, as illustrated in Figure 1.4. This requires an ERS that recognises the cash flow consequences of external financing. That ERS should allow tariffs to accommodate debt service obligations, if taxes and transfers have not been committed to do so.
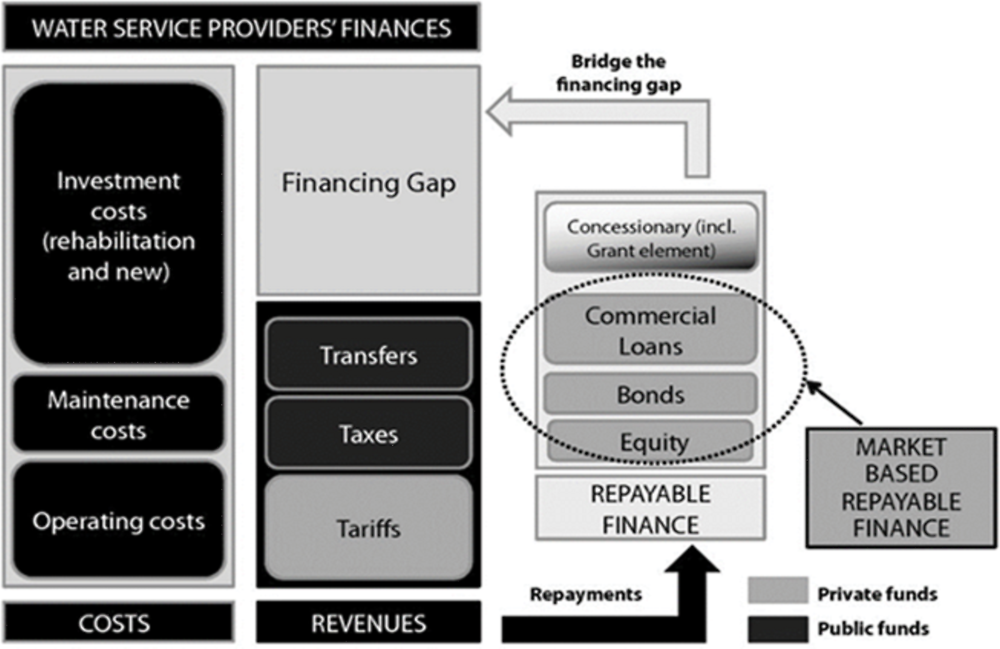
Source: (OECD, 2010[6]), Innovative Financing Mechanisms for the Water Sector
8. Allow for adequate and cost-effective ways to achieve SDG6 through revised design and construction norms for WSS and service quality standards, among others.
Given the challenge of meeting the SDGs, more flexible, appropriate approaches to WSS are needed, particularly in sanitation and in rural areas. This should be possible without breaking any construction or service norms or standards.
9. Apply dedicated economic instruments to co-finance investment, particularly in wastewater treatment (OECD, 2010[6]).
The WFD calls for water pricing in accordance with the full cost recovery and polluter pays principle. Full cost recovery implies charging not only the operating and capital costs of service, but also the environmental and resource costs. In Moldova, however, full cost recovery in WSS cannot be achieved through tariffs alone in the years up to 2030. The ERS will have to provide for other complementary economic instruments such as charges, taxes and market-based instruments. At the same time, these instruments can generate funds needed for co-financing WSS capital expenditure, particularly for wastewater treatment.
The demands are summarised in Annex 1.B. They were discussed among stakeholders and in an Expert Meeting on 16 November 2016. Furthermore, Annex 1.A.2 provides an overview of the relations, the necessary balance and the possible conflicts between these demands. From the overview, one can see that the demands on the system are compatible or can be reconciled.
References
[24] ANSRC (2014), Presentation of National Regulatory Authority for Municipal Services of Romania, http://www.danube-water-program.org/media/dwc_presentations/day_0/Regulators_meeting/2._Cador_Romania_Viena_ANRSC.pdf.
[9] Berg, S. et al. (2013), “Best practices in regulating State-owned and municipal water utilities”, http://repositorio.cepal.org/bitstream/handle/11362/4079/S2013252_en.pdf?sequence=1 (accessed on 8 February 2018).
[16] CASTALIA (2005), Defining Economic Regulation for the Water Sector, https://ppiaf.org/sites/ppiaf.org/files/documents/toolkits/Cross-Border-Infrastructure-Toolkit/Cross-Border%20Compilation%20ver%2029%20Jan%2007/Resources/Castalia%20-%20Defining%20Economic%20%20Regulation%20Water%20Sector.pdf.
[15] Demsetz, H. (1968), “Why Regulate Utilities?”, Journal of Law and Economics, Vol. 11, pp. 55-65.
[26] EAP Task Force (2013), Business Models for Rural Sanitation in Moldova, https://www.oecd.org/environment/outreach/Business%20models%20for%20rural%20sanitation%20in%20Moldova_ENG%20web.pdf.
[20] Eptisa (2012), Republic of Moldova’s Water Supply and Sanitation Strategy (Revised Version 2012), http://www.serviciilocale.md/public/files/2nd_Draft_WSS_Strategy_October_final_Eng.pdf.
[7] Geert Engelsman, M. (2016), Review of success stories in urban water utility reform, https://www.seco-cooperation.admin.ch/dam/secocoop/de/dokumente/themen/institutionen-dienstleistungen/Review%20of%20Successful%20Urban%20Water%20Utility%20Reforms%20Final%20Version.pdf.download.pdf/Review%20of%20Successful%20Urban%20Water%20Utility%20Reforms%20Final%20Version.pdf.
[30] Massarutto, A. (2013), Italian water pricing reform between technical rules and political will, http://www.feem-project.net/epiwater/docs/epi-water_policy-paper_no05.pdf.
[18] Ministry of Environment of Republic of Moldova (n.d.), Reports on Performance in 2010-2015, http://mediu.gov.md/index.php/en/component/content/article?id=72:fondul-ecologic-national&catid=79:institutii-subordonate.
[22] OECD (2017), Improving Domestic Financial Support Mechanisms in Moldova’s Water and Sanitation Sector, OECD Studies on Water, OECD Publishing, Paris, https://doi.org/10.1787/9789264252202-en.
[23] OECD (2017), Improving Domestic Financial Support Mechanisms in Moldova’s Water and Sanitation Sector, OECD Studies on Water, OECD Publishing, Paris, https://doi.org/10.1787/9789264252202-en.
[21] OECD (2016), OECD Council Recommendation on Water, https://www.oecd.org/environment/resources/Council-Recommendation-on-water.pdf.
[25] OECD (2016), Sustainable Business Models for Water Supply and Sanitation in Small Towns and Rural Settlements in Kazakhstan, OECD Studies on Water, OECD Publishing, Paris, https://doi.org/10.1787/9789264249400-en.
[29] OECD (2015), “Regulatory Impact Analysis”, in Government at a Glance 2015, OECD Publishing, Paris, https://doi.org/10.1787/gov_glance-2015-39-en.
[33] OECD (2015), The Governance of Water Regulators, OECD Publishing, https://doi.org/10.1787/9789264231092-en (accessed on 7 February 2018).
[8] OECD (2014), The governance of regulators..
[6] OECD (2010), Innovative Financing Mechanisms for the Water Sector, OECD Studies on Water, OECD Publishing, Paris, https://doi.org/10.1787/9789264083660-en.
[31] OECD (2010), Innovative Financing Mechanisms for the Water Sector, OECD Studies on Water, OECD Publishing, Paris, https://doi.org/10.1787/9789264083660-en.
[3] OECD EAP Task Force (2013), Adapting Water Supply and Sanitation to Climate Change in Moldova, https://www.oecd.org/environment/outreach/Feasible%20adaptation%20strategy%20for%20WSS%20in%20Moldova_ENG%20web.pdf.
[13] OECD EAP Task Force (2007), Proposed system of surface water quality standards for Moldova: Technical Report, http://www.oecd.org/env/outreach/38120922.pdf.
[19] OECD EAP Task Force (2003), Key Issues and Recommendations for Consumer Protection: Affordability, Social Protection, and Public Participation in Urban Water Sector Reform in Eastern Europe, Caucasus and Central Asia, http://www.oecd.org/env/outreach/14636760.pdf.
[1] OECD EAP Task Force (2000), Guiding Principles for Reform of the Urban Water Supply and Sanitation Sector in the NIS.
[17] Pienaru, A. (2014), Modernization of local public services in the Republic of Moldova, http://www.serviciilocale.md/public/files/prs/2014_09_18_WSS_RSP_DRN_FINAL_EN.pdf.
[28] Popa T. (2014), “A smart mechanism for financing water services and instrastructure” IWA, https://www.iwapublishing.com/sites/default/files/documents/online-pdfs/WUMI%209%20%281%29%20-%20Mar14.pdf.
[34] Programme, U. (ed.) (2015), Human Development Report 2015: Work for Human Development, Communications Development Incorporated, Washington DC, https://doi.org/978-92-1-057615-4.
[32] Rouse, M. (2007), Institutional Governance and Regulation of Water Services | IWA Publishing, IWA, London, https://www.iwapublishing.com/books/9781843391340/institutional-governance-and-regulation-water-services.
[10] Smets, H. (2012), “CHARGING THE POOR FOR DRINKING WATER The experience of continental European countries concerning the supply of drinking water to poor users”, http://www.publicpolicy.ie/wp-content/uploads/Water-for-Poor-People-Lessons-from-France-Belgium.pdf (accessed on 8 February 2018).
[11] Trémolet, S. and C. Hunt (2006), “Water Supply and Sanitation Working Notes TAKING ACCOUNT OF THE POOR IN WATER SECTOR REGULATION”, http://regulationbodyofknowledge.org/wp-content/uploads/2013/03/Tremolet_Taking_into_Account.pdf.
[12] Tuck, L. et al. (2013), “Water Sector Regionalization Review. Republic of Moldova.”, http://www.danubis.org//files/File/country_resources/user_uploads/WB%20Regionalization%20Review%20Moldova%202013.pdf.
[4] UN (2015), Sustainable Development Goals, https://sustainabledevelopment.un.org/content/documents/21252030%20Agenda%20for%20Sustainable%20Development%20web.pdf.
[2] UNDP (2009), “Climate Change in Moldova”, http://hdr.undp.org/sites/default/files/nhdr_moldova_2009-10_en.pdf (accessed on 7 February 2018).
[14] UNECE (2014), Environmental performance review, Republic of Moldova. Third Review Synopsis., UNECE, https://www.unece.org/fileadmin/DAM/env/epr/epr_studies/Synopsis/ECECEP171_Synopsis.pdf.
[5] UNEP (2014), Environmental strategy years 2014-2023, https://www.unenvironment.org/resources/report/environmental-strategy-years-2014-2023.
[27] Verbeeck, G. (2013), Increasing market-based external finance for investment in municipal infrastructure, https://www.iwapublishing.com/sites/default/files/documents/online-pdfs/WUMI%208%20%284%29%20-%20Dec13.pdf.
[35] Verbeeck, G. and B. Vucijak (2014), “Towards effective social measures in WSS”, Towards effective social measures in WSS, https://1drv.ms/b/s!Anl6ybs2I7QGhdUX96FsaFC6JTUpIA.