
copy the linklink copied!Chapter 3. Tackling old-age poverty
This chapter addresses the need for the pension system to have a non-contributory pension component to tackle poverty in old age and ensure that all Peruvians can receive an income to provide for some basic needs in retirement. While the current benefit provided by the Pensión 65 programme has been successful in alleviating extreme poverty in old age, benefit levels remain low and the programme’s coverage could be expanded and better integrated with the provision of the minimum pension from the contributory system.1
A fundamental part of any pension system is the non-contributory component that is available to those who have been unable to secure an earnings-related pension income for their retirement. It should be designed to help alleviate poverty in old-age whilst limiting disincentives to work and contribute to a pension during the working life. This can be an issue with high levels of informality or where large sections of the workforce are exempt. In Peru the non-contributory benefit is called Pensión 65 and is available to those aged 65 and over who are classified as being in extreme poverty.
copy the linklink copied!3.1. Addressing old-age poverty
Poverty is clearly undesirable at any age, but is particularly important to address once individuals have reached pensionable age, as generally they will be unable to supplement their income through employment.
Across most of the OECD, the definition of being in poverty is commonly a relative measure based on a percentage of the overall population income, e.g. being in a household with under 50% of median disposable household income, and so the performance of the overall economy affects the thresholds. However, some countries, including Peru and the United States, establish poverty levels at specific absolute monetary levels.
3.1.1. Poverty levels
Poverty rates in Peru, defined as those living on less than PEN 338 per month (USD 100), 36% of the current minimum wage - the amount needed to purchase the statistical food and non-food basket - have decreased over the last decade. This improvement resulted from surges in export prices for Peru’s key mineral exports. However, since 2012 the terms of trade have become less favourable, thereby stopping the decline of the absolute poverty rate (Table 3.1).
The level of poverty in Lima is approximately half of that of the rest of the country, with urban residents having a level of poverty of only one-third of the level of rural residents. For the population as a whole, just over one-fifth of residents are recorded as being in poverty in 2017, a fall of 12 percentage points over an eight-year period.
Beyond this basic poverty indicator, about 4% of the population (1.2 million people) live in extreme poverty, meaning that they earn less than PEN 183 per month (USD 55), which is 20% of the current minimum wage and 11% of average earnings. Again, rural residents are more at risk, with a proportion of extreme poverty greater than ten times the proportion of their urban resident counterparts (Table 3.2).
Definitions of poverty can differ between countries, but comparisons across countries can be made using the relative poverty rate computed by the OECD. Unfortunately, there is not a directly equivalent measure within Peru for those living below 50% of the median household income, but the poverty levels for Peru described above are based on much lower income thresholds and therefore underestimate the situation using the OECD measure.
For all OECD countries combined, the whole population poverty rate is 11.5%, with a high of 19.5% in Israel (Table 3.3). For the elderly aged 66 and over, the OECD average is slightly higher at 12.5%, increasing to 13.9% when considering those aged 76 and over.
There is, however, considerable variation in the levels by country. Fewer than 4% of those aged 66 and over are classified as in poverty in the Czech Republic, Denmark, France, Luxembourg, the Netherlands and the Slovak Republic. In all these countries the elderly poverty rate is at least two percentage points below the overall population level. In contrast, poverty for the elderly is above 25% in Australia, Estonia, Korea and Latvia, all of which are at least nine percentage points above the whole population figure.
Korea is a special case and may serve as a comparator for Peru, in that large numbers of the elderly population do not have a pension (in Korea’s case the pension system was only introduced in 1988 and has yet to mature) and the level of the safety-net benefit is low in comparison to average earnings. In Korea, just under half of all those aged 66 and over are in poverty.
Poverty figures are not available by age in Peru, but as shown in the next section around 24% of the population aged 65 and over are in receipt of Pensión 65, because at some point they were in extreme poverty. Therefore, under the OECD definition of poverty representing those with income below 50% of median household disposable income the poverty figure for Peru would be considerably higher for the elderly population.
3.1.2. Pensión 65
The main mechanism that Peru has to address poverty in old age is the Pensión 65 programme that was introduced in 2011 and is the only cash benefit available to the elderly. If individuals have been unable to save sufficiently through either the SNP or SPP systems, they may be eligible for support from Pensión 65. Pensión 65 aims to provide an economic subsidy to those over the age of 65 who are living in a household classified as being in extreme poverty. As discussed below, about one in four individuals older than 65 now receive Pensión 65, which is a remarkable achievement in a few years.
Even if the payment of Pensión 65 results in individuals no longer being in extreme poverty, those individuals are still eligible to receive the benefit as long as they are classified as being in poverty, i.e. have less than PEN 338 per month (USD 100). The benefit is only removed if individuals have income above the poverty threshold. This is an unlikely scenario for those aged 65 and over. Even if individuals have an income of PEN 183 per month, the payment from Pensión 65 would only bring this to PEN 308 per month and so they would likely have to return to employment to gain the extra PEN 30 per month required to get above the poverty threshold. Beyond monetary payments, individuals are also entitled to free care in public health facilities, and are enrolled in the Integral Health Insurance Programme (Seguro Integral de Salud, SIS).
There has been no nominal increase in the payment amount from Pensión 65 since its introduction, hence the relative value has been declining. Payments of PEN 250 are made every two months, equivalent to around 8% of gross average earnings. By comparison, old-age safety-net benefits for someone who has never contributed to the pension system but has lived in the country throughout their life averaged around 21% of average earnings across OECD countries. Peru is ranked near the bottom with only Latvia, Mexico and Turkey having lower levels of old-age protection in relation to average earnings within countries (Figure 3.1).
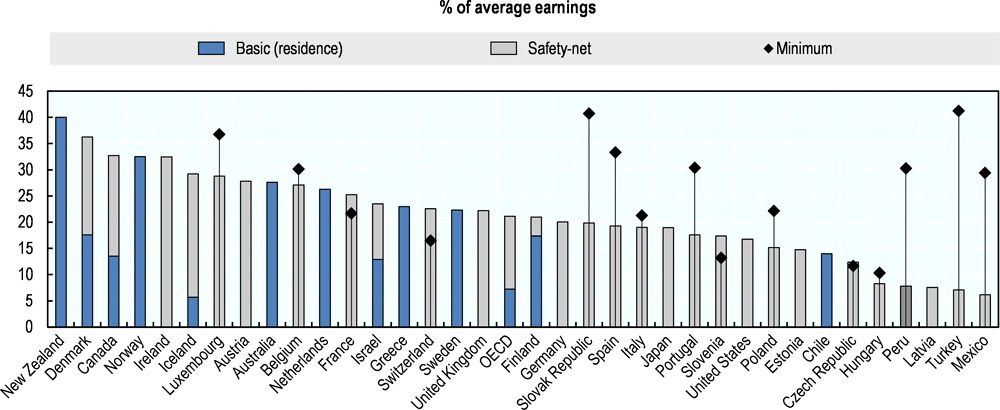
Note: Minimum refers to the maximum level of the minimum pension based on a full career.
Source: (OECD, 2017[1]).
The minimum pension in Peru is equivalent to 30% of average earnings, which is above the OECD average of 26% for the countries that have a minimum pension. The minimum pension, included in Figure 3.1, shows that there is a clear incentive to contribute towards a pension system in Peru, otherwise individuals will have to rely on the much lower safety-net component.
The minimum number of years required to contribute to the pension system to be eligible for a minimum pension is very high in Peru. Twenty years of contributions are required to be eligible for the minimum pension, hence many retirees are not able to reach this level and have to rely on Pensión 65. By comparison, in other countries, it is often possible to access the minimum pension with a considerably shorter career, although the benefit might be reduced. For example, in both France and Switzerland it is possible to receive a minimum pension with just one year of contributions. It is not uncommon for countries to have a variable minimum pension, with Belgium, Luxembourg and Portugal also having this system in place, whilst the other OECD countries only have one level of benefit (Figure 3.2). Access to a minimum pension requires over 20 years of contribution in Belgium, the Czech Republic, Mexico and Poland, whilst only 15 years are required in Portugal, Slovenia, Spain and Turkey.
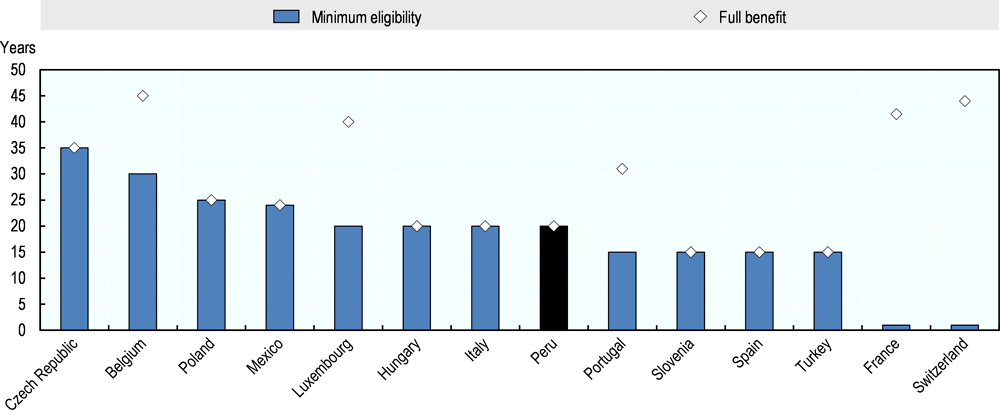
Note: Minimum pensions refer to either the minimum of a specific scheme or of all schemes combined. The benefit level can take into account other pension income.
Source: (OECD, 2015[2]).
copy the linklink copied!3.2. Coverage and benefit of Pensión 65
The role of Pensión 65 is gaining in importance as the number of recipients has grown considerably since it was created. It increased from about 300 000 to nearly 550 000 between 2013 and 2018, and now benefits nearly one-quarter of all those over the age of 65 (Table 3.4).
The cost of providing the benefit has also increased in line with the number of recipients, from PEN 417 million in 2013 to PEN 811 million in 2018. However, this still represents only around 0.1% of GDP.
Generally, flat-rate benefits, as Peru has, provide lower benefit levels than countries with gradual withdrawal systems. This is primarily a cost issue as paying a flat-rate benefit to the entire population over age 65 can be very expensive, whereas paying a targeted benefit could mean that although most people receive something the cost is reduced considerably because relatively few are receiving the full amount, which allows a higher level of basic income.
The take-up rate amongst the elderly population varies significantly by country as it crucially depends on the design of the benefit. Figure 3.3 shows the percentage of the over-65s receiving safety-net benefits across OECD countries, with Peru added for comparison.

Source: (OECD, 2017[3])
Countries with variable benefits tend to have higher take-up rates. Denmark and Australia have by far the highest take-up rate, but in both countries the benefit is heavily withdrawn against other income and assets so not all recipients receive the full benefit. Nevertheless, at 24%, Peru is still among the top 10 countries and has the highest take-up among those paying a flat-rate benefit to all those that are eligible.
Lower take-up rates, however, do not necessarily imply lower effectiveness at ameliorating poverty. Twelve countries have a take-up rate below 10% (all countries from Belgium down in Figure 3.3). Although the take-up rate of the benefits is low the benefits are clearly working, since the poverty levels for the elderly in most of these countries are well below the whole population poverty level, with Japan and the United States being notable exceptions (Table 3.3).
The level of safety-net benefits (as a percentage of average earnings) is closely related to the level of economic development measured by GDP per capita in PPP terms (Figure 3.4). In some countries, namely Korea, Switzerland and the United States, the safety-net level is significantly below what could be expected based on the economic level or development.

Source: (OECD, 2017[1]).
Peru has the lowest GDP per capita compared to OECD countries, and also has one of the lowest safety-net benefit levels. In Peru, the benefit level falls short by about 30% of the level obtained based on the linear relationship with GDP per capita, but is close to the quadratic-relationship level.
However, if the benefit level remains constant in nominal terms while GDP per capita increases, the safety-net level will move away from the level consistent with the economic development of the country based on international comparison. Every other country shown in the chart has some rule to index benefits in payment, whether it be to either inflation or wage growth. By contrast, the level of benefit in Peru has remained constant in monetary terms. Given the currently low level of the benefit and related spending, there is space to index. This would ideally be based on wage growth, but should at least keep purchasing power constant.
copy the linklink copied!3.3. Impact of Pensión 65
Several studies have been conducted to assess the effectiveness of non-contributory benefits for the elderly in terms of their social impact and whether they also have an influence on labour market participation, both in general and specifically at older ages.
The recipients of Pensión 65 represent over 40% of all those aged 65 and over receiving a “pension”, indicating that it has a significant impact on improving the living standards of many elderly Peruvians.
Nevertheless, the existence of Pensión 65 may provide disincentives to participate in the formal labour market. Nearly two-thirds of those contributing to SNP are unlikely to meet the 20-year contribution requirement. Hence, these people may perceive that their contributions throughout their careers are worthless as they will be relying, if eligible, on Pensión 65 for support in old age.
Indeed, there is some evidence that the introduction of Pensión 65 may have reduced engagement in paid work, as would be expected with the introduction of a targeted benefit for the elderly. One study estimated that receipt of Pensión 65 decreased the amount of paid work undertaken by older adults by four percentage points, although the study was conducted only one year after the programme was introduced (Bando, Galiani and Gertler, 2016[4]).
The same study concluded that there were positive improvements in mental health, as evidenced by a reduction of nine percentage points in the overall Geriatric Depression Scale score. In addition consumption increased by 40% and transfers to other individuals living elsewhere increased by one-third, indicating that the benefit is having a positive impact beyond just the household that is in receipt.
copy the linklink copied!3.4. Policy options
Pensión 65 is an important addition to the Peruvian pension system as it provides a safety-net benefit for those most in need, i.e. those classified as being in extreme poverty. Within this group it has been very successful in achieving widespread coverage. Still, more could be done to ensure that those eligible will receive benefits.
Additionally, benefit levels should be increased and indexed to be more effective at tackling poverty. The current benefit levels are already low relative to Peru’s GDP per capita, and have lost value over time since they have not been indexed to inflation or wage growth.
The form of the benefit could also be changed from a flat-rate benefit to a top-up to increase benefit levels and coverage. Instead of providing a flat-rate benefit that everyone gets independently of whether they have other retirement income, Pensión 65 could top up whatever income people have in retirement to put them at some basic level of retirement income.
3.4.1. Increase awareness of benefits
The take-up of the Pensión 65 benefit could be increased by ensuring that everyone who is currently eligible receives the benefit. Whilst the number of beneficiaries has steadily increased over the years, there is evidence that not everyone eligible actually receives the benefit (Acuna et al., 2015[5]). In particular, not all regions have the same level of record keeping. Policies have been implemented to target communication to certain groups that are entitled to the benefits but were not getting them, and to improve record keeping. Updated analysis is required to establish whether those measures have improved coverage, so that further measures can be put in place to increase awareness and hopefully coverage, possibly by better communication campaigns.
3.4.2. Increase benefit amount and threshold
Beyond ensuring coverage for everyone eligible, the level of the benefit needs to increase over time if it is going to act as a more effective mechanism to tackle poverty. The benefit level is low by international comparison relative to earnings in the economy, even when accounting for differences in economic development levels. Moreover, with no nominal increase, the impact of the benefit is declining.
The value of the benefit might need to be significantly raised in a special one-off move. With the total related expenditure amounting to under 0.1% of GDP there seems to be scope to raise the benefit level. The poverty threshold is set at PEN 338 per month (21% of average earnings) so a tripling of the Pensión 65 benefit to PEN 750 every two months would thereby place every person aged 65 and over above the poverty threshold. However, making this much higher benefit universal so that all Peruvians aged 65 and over receive it - including those above the poverty level, which total 2.5 million people - would be expensive and cost around 1.6% of GDP.
Indexing the benefit with inflation would at least ensure that the elderly maintain their purchasing power. Alternatively, indexing to wage growth would ensure that they maintain their standard in relation to the working-age population. Some OECD countries index the benefit to a mix of prices and wages.
3.4.3. Change the benefit to a top-up payment rather than flat-rate
In order to provide improved coverage and efficiency, the ultimate design of Pensión 65 should depend on the overall structure of the pension system as a whole. The structure of the benefit should be integrated with the minimum pension offered by the contributory pension system. This minimum pension should be progressive and based on years of contribution to encourage participation within the formal pension system.
The suggested change to Pensión 65 is not only to increase significantly the level of the benefit, but to use this new level as a total income component. Therefore, the role of Pensión 65 would be to top up the pensioners’ income to this new level, as is done with the Age Pension in Australia, for example. Whilst some individuals would require the full benefit amount of the Pensión 65, over time the reliance on this component would be expected to decline as more and more workers will have made contributions during their working lives and therefore have at least a small component of earnings-related pension in retirement.
The initial cost of this change could be spread over many years by staggering the increase to the benefit paid by the Pensión 65. As more workers begin to attain greater levels of pension rights, having the benefit as a top-up rather than a flat-rate will start to reduce the cost to the public purse of this benefit established to combat poverty.
References
[5] Acuna, R. et al. (2015), Cómo fortalecer los sistemas de pensiones latinoamericanos, Experiencias, Lecciones y Propuestas, Sura Asset Management.
[4] Bando, R., S. Galiani and P. Gertler (2016), The Effects of Non-Contributory Pensions on Material and Subjective Well-Being.
[1] OECD (2017), Pensions at a Glance 2017: OECD and G20 Indicators, OECD Publishing, Paris, https://doi.org/10.1787/pension_glance-2017-en.
[3] OECD (2017), Pensions at a Glance 2017: OECD and G20 Indicators, OECD Publishing, Paris, https://dx.doi.org/10.1787/pension_glance-2017-en.
[2] OECD (2015), Pensions at a Glance 2015: OECD and G20 indicators, OECD Publishing, Paris, https://dx.doi.org/10.1787/pension_glance-2015-en.
← 1. The statistical data for Israel are supplied by and under the responsibility of the relevant Israeli authorities. The use of such data by the OECD is without prejudice to the status of the Golan Heights, East Jerusalem and Israeli settlements in the West Bank under the terms of international law.
Metadata, Legal and Rights
https://doi.org/10.1787/e80b4071-en
© OECD 2019
The use of this work, whether digital or print, is governed by the Terms and Conditions to be found at http://www.oecd.org/termsandconditions.
