1. Recent Trends in SME and Entrepreneurship Finance
This first chapter of the Financing SMEs and Entrepreneurs 2019: An OECD Scoreboard analyses trends in SME and entrepreneurship finance over 2007-17, based on data collected for the country scoreboards and information from demand-side surveys. A short overview of the global business environment sets the framework for the analysis of SME financing trends and conditions, focusing in particular on the changes that occurred in 2017 and the first half of 2018. The chapter concludes with an overview of government policy responses put in place to improve SMEs’ access to finance in light of recent developments.
1.1. Business environment and macroeconomic context
Following a prolonged period of weak growth, global GDP rose by 3.6% in 2017 and is projected to rise to 3.7% in 2018, before easing to 3.5% in 2019 and 2020 (OECD, 2018[1]). Although this represents an improvement from recent years, there are indications that global growth has peaked and that downside risks to the economic recovery have intensified. Growth forecasts in the November 2018 OECD Economic Outlook have been revised downward for most major economies, with the exception of Canada, Mexico, the United Kingdom and the United States. In addition, heightened risks in terms of trade, investment, inflationary pressures and financial pressures on emerging countries could lead to further deterioration of the outlook.
Trade and business investment
Global trade rebounded strongly in 2017, growing 5% year-on-year, up from 2.6% in 2016 (OECD, 2018[2]). However, mounting trade tensions contributed to the slowing down of trade growth in the first half of 2018, especially in sectors that were directly impacted by recent trade restrictions. As a result, global trade growth is projected to remain subdued, dropping to around 4% in 2018 and to 3.7% in 2019 and 2020, on the assumption that trade tensions do not worsen (OECD, 2018[1]).
In this context, the pace of business investment growth in the OECD area is expected to average just over 3% per year in 2018-19, a 50 to 75 basis point decrease from previous forecasts, albeit with considerable variation across countries. Moreover, at this pace, the net productive capital stock growth is expected to remain weaker than in the pre-crisis period in most countries, and this shortfall is considered to impair productivity gains (OECD, 2018[1]).
Notable downside risks to the economy include a disruption in oil markets, the vulnerability of some large emerging economies with high external debt and negative current account balances that are affected by monetary tightening in advanced economies, along with the build-up of financial risks. The latter relates in particular to lingering fragilities of the banking sector in the euro zone area, the strong rise in equity prices, as well as the rising debt and risks accumulated by less tightly regulated non-bank institutions (OECD, 2018[1]).
Financial conditions
As in previous years, financial conditions remained broadly supportive in 2017. Nevertheless, they have begun to tighten more recently, especially in developing economies, and are expected to tighten further with the closing of output gaps and monetary policy normalisation (International Monetary Fund, 2018[3]). Higher long-term interest rates largely reflect a stronger economic outlook than markets had previously expected, and the associated expectations of somewhat higher inflation and less accommodative monetary policy. Equity prices in the major economies have declined from their recent elevated peaks and stock market volatility has picked up from the unusually low levels seen in 2016. These adjustments pose a risk to financial stability, as asset corrections could amplify and spread across asset classes and countries. Credit markets have, however, largely have been stable and corporate and emerging economies’ bond spreads1 generally remained low, although they started to rise since the beginning of 2018, especially in Europe and to some extent in emerging markets (OECD, 2018[1]).
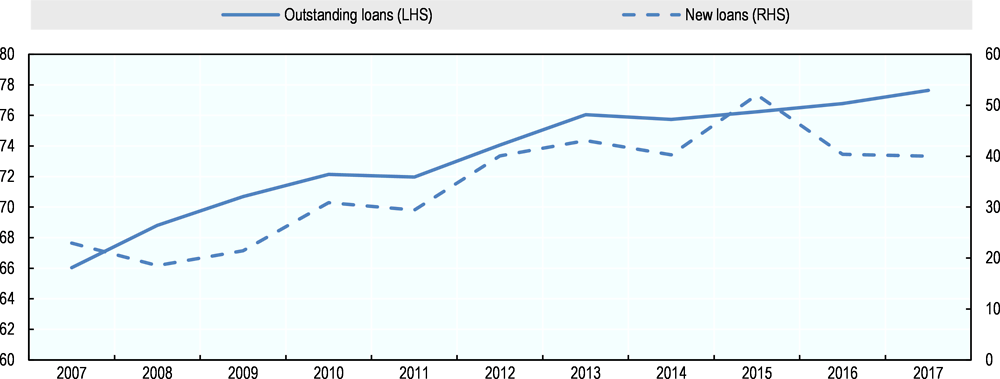
Lending to SMEs
After the drop in 2016, growth in new SME lending turned positive again in 2017, although it remained modest. The stock of outstanding SME loans has shown positive growth since 2010 and grew again in 2017, but less strongly compared to 2016. Overall, demand for finance remained broadly stable, holding back stronger lending growths, as evidenced also by recent survey data.
New SME loans
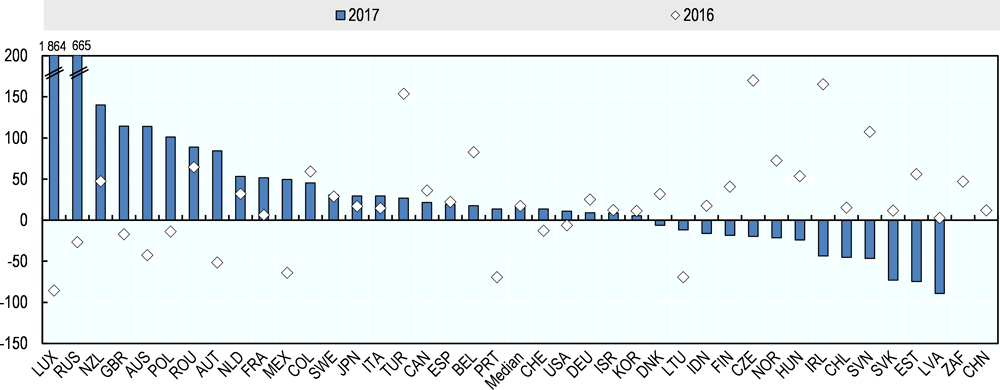
The median value of growth in new SME lending turned positive in 2017, from -4.8% in 2016 to 0.4% in 2017 (Figure 1.1). The overall picture since 2011 has shown no clear trend, however, and data for individual countries often displayed significant swings from one year to the next.
Growth in new SME loans was positive in 13 out of 24 countries that provided data for this indicator, including those that had experienced a (sometimes strong) decline in the previous year, such as Canada, Chile, Colombia, Denmark, Greece, Luxembourg and the Russian Federation. In ten countries, new SME lending was negative in 2017, often in continuation with negative growth experienced in the previous year, such as in Australia, Brazil, Portugal, and the United States. In Kazakhstan, Latvia, and Malaysia, new SME loan growth turned negative in 2017, after strong growth in the previous year. In the United Kingdom, following twelve positive quarters of net lending since Q4 2014, growth in new SME loans was slightly negative in Q4 2017, but turned again positive in 2018.
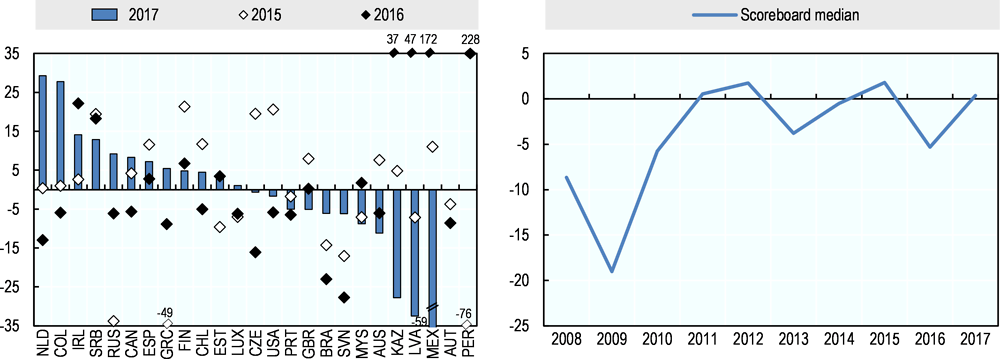
Note: 2017 data is not available for Austria and Peru. Definitions differ across countries. Detailed information on sources and definitions is available in the full country profiles. Data are adjusted for inflation using the OECD GDP deflator and for. For non-OECD countries the deflator was extracted from the World Bank World Development Indicators.
Source: Data compiled from the individual country profiles of Financing SMEs and Entrepreneurs 2019.
Data analysis shows that new lending activities appear to be strongly and significantly correlated with GDP growth. For every additional 1% of GDP growth, new lending to SMEs could be expected to rise by close to 2% on average.2 This suggests that economic growth is a strong predictor of credit developments, especially when it comes to new lending (the correlation is weaker and less significant when using stock SME credit data as the independent variable). In Greece and the Russian Federation, for instance, SME lending turned positive in 2017 after several years of strong decline, coinciding with a recovery in GDP. Likewise, the contraction in new lending to SMEs in Brazil is bottoming out, as its economy recovered in 2016 and especially in 2017.
At the same time, in other countries, the decline in new SME lending coincided with relatively strong economic growth. Several factors may explain this development. In some countries, such as Kazakhstan, Latvia and Portugal, structural changes in the banking sector, as well as risk aversion from financial institutions when lending to SMEs, appear to play a strong role. In other countries, such as the United Kingdom and the United States, survey data point to subdued demand for credit as one element driving this development, which may be linked to the increasing take-up of alternative financing instruments in these countries.
Research from the European Investment Bank indicates that credit demand from euro area SMEs remains subdued because of a modest rebound in investments, as well as a stronger reliance on internal funds rather than on external debt. (European Investment Bank, 2017[4]) (see section 1.5 on Self-financing).
On the supply side, increased capital requirements of banks may also play a role in the weak growth in new lending in recent years. A percentage point in capital requirements is estimated to reduce new lending by 10% in the euro area, for instance (Fraisse, Lé and Thesmar, 2017[5]). A 2017 study from the European Investment Bank suggests that the trend toward a better capitalised financing sector in Europe has likely negatively impacted the provision of credit, but expects a pick-up in the coming years (European Investment Bank, 2017[4]).
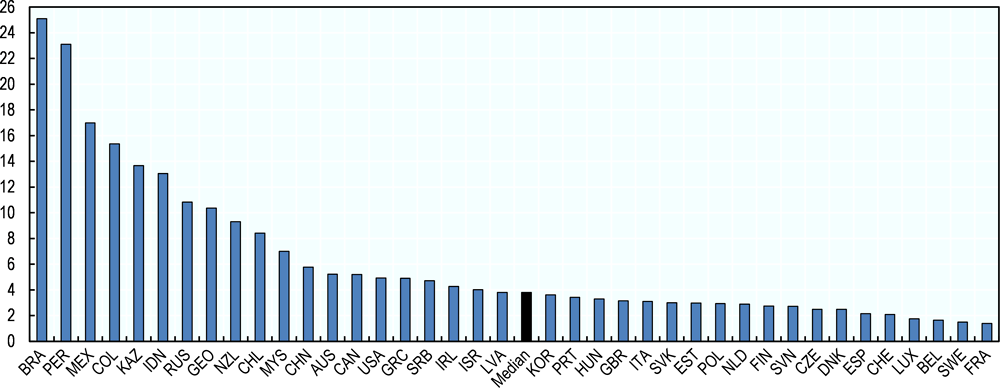
Outstanding stock of SME loans
The stock of SME loans grew in 25 out of 39 countries that provided data for this indicator. The Scoreboard median value of the year-on-year growth in outstanding SME loans stood at 1.7% in 2017, after growing by almost 3% in 2015 and by 2.6% in 2016. The median value masks considerable country variation, however. Outstanding SME loan growth turned positive in 2017 in the Netherlands, Slovenia, Spain and Thailand and negative in 7 other countries. While the decline in the outstanding stock of SME loans accelerated further in Portugal, the Russian Federation and the United Kingdom, the drop decelerated in Brazil, Ireland and Italy. In Belgium, Estonia, France, Georgia, Israel, Japan and Serbia, growth in outstanding SME loans gained further pace in 2017 (Figure 1.2).
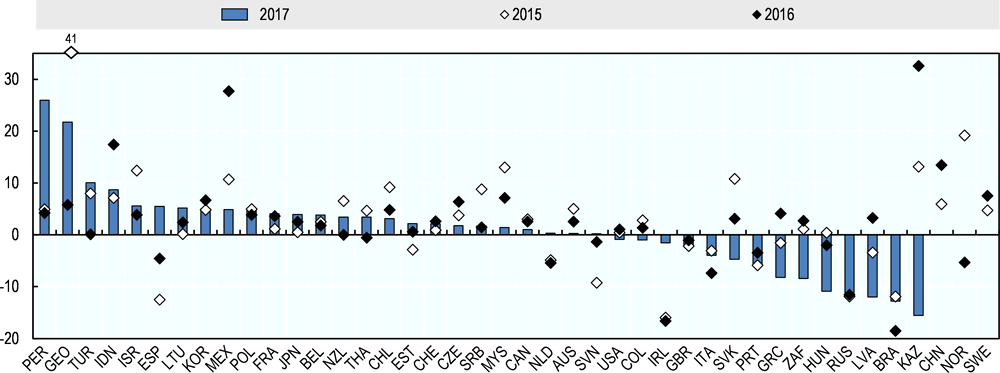
Note: Due to changes in methodology in New Zealand, the 2016 growth rate from this country has been excluded. 2017 data is not available for China, Norway and Sweden, and is preliminar for Peru. Definitions differ across countries. Detailed information on sources and definitions is available in the full country profiles. Data are adjusted for inflation using the OECD GDP deflator. For non-OECD countries, the deflator was extracted from the World Bank World Development Indicators.
Source: Data compiled from the individual country profiles of Financing SMEs and Entrepreneurs 2019.
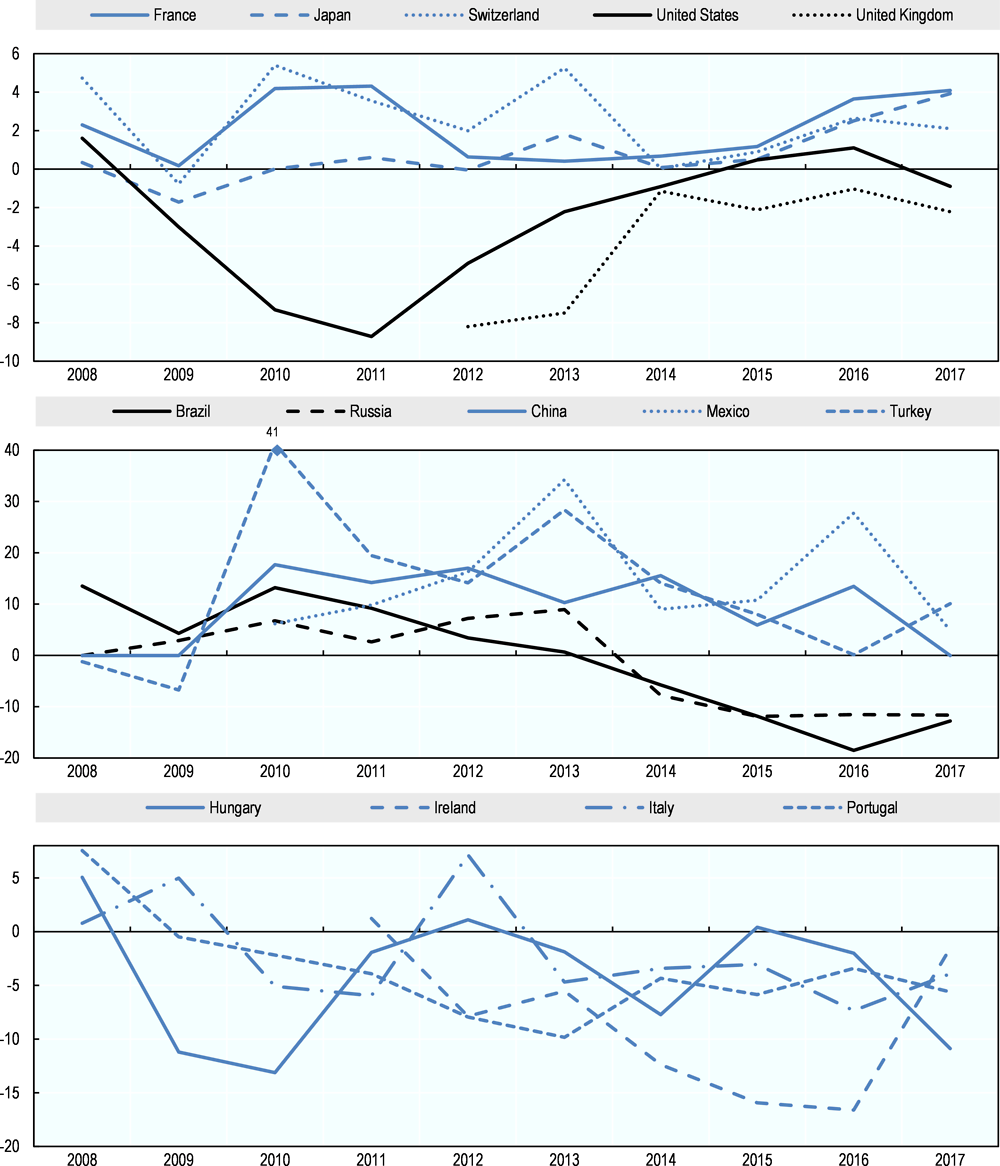
Overall, three patterns of lending growth can be observed. In most mid-income countries, loan growth has been rapid as a result of financial deepening and increased access to formal financial services. In many high-income countries, by contrast, loan growth has been sluggish. Loan growth has been particularly weak in the United Kingdom and the United States, with increased access of other sources of finance than straight debt playing a role. Finally, in some countries that were affected severely by the financial crisis, such as Hungary, Ireland, Italy and Portugal, SME loan growth often remained negative in 2016 and 2017 (see Figure 1.3).
Box 1.1 presents an overview of the country groups and their main characteristics, based on cluster analysis of 2015, 2016 and 2017 data.3 It is important to note that there remains substantial heterogeneity within these three groups of countries. For example, loan growth over the last several years has been negative in Brazil and the Russian Federation, even though they are classified in the same cluster as other countries where loan growth has typically been high.
Note: Definitions differ across countries. Detailed information on sources and definitions is available in the full country profiles. Data are adjusted for inflation using the OECD GDP deflator. For non-OECD countries, the deflator was extracted from the World Bank World Development Indicators.
Source: Data compiled from the individual country profiles of Financing SMEs and Entrepreneurs 2019.
The data on outstanding SME loans is influenced by a greater number of factors than data on new lending, which explains the divergence that can be observed between these two indicators, even though both of them provide information on developments in credit markets. In particular, the pace of loan repayments, changes to the maturity of loans and fluctuations in non-performing loans may lie behind different developments in stock and flow data in SME loans. In Ireland, for example, the outstanding stock of SME loans contracted by more than 15% in both 2015 and 2016, and shrank again by 1.5% in 2017, while new SME loans grew strongly by an annual average of 13% over 2015-17, due to increased repayments of existing loans.
In Greece, on the other hand, the outstanding stock of SME loans increased in 2016 while new SME lending declined, which can largely be attributed to the rise in non-performing loans, which have remained on banks’ balance sheets. In addition, in many countries there has been an upward trend in the relative number of long-term loans compared to short-term credit. This can explain in part the divergent trends in flow and stock data, since loans of greater maturity remain in the data for outstanding loans for a longer period.
The growth in the outstanding stock of SME loans broadly tracks GDP growth and the year-on-year change of corporate investments in group 1, scoreboard countries with a median GDP per capita of USD 45 000 (in purchasing power parity). In addition, SME NPLs, interest rates and the interest rate spread vis-à-vis large firms are all substantially lower than in other countries, indicating that supply-side issues for SME finance are relatively limited.
In a second group, which consists of mostly mid-income countries with a median GDP per capita of USD 11 000, the stock of SME credit expanded by almost 7% year-on-year between 2014 and 2017, likely reflecting “financial deepening” and the inclusion of a higher percentage of the SME population in the official financial sector. In contrast to other countries, leasing and factoring volumes show no clear upward trend, suggesting that these countries are becoming more instead of less dependent on traditional debt. Both SME interest rates as well the interest rate spread are much higher than in the two other groups, likely illustrating relatively stringent credit conditions and a persistent preference of financial institutions to lend to large enterprises. Payment delays are also considerably higher among these countries, posing challenges for their cash flow management.
Moderate growth in outstanding SME loans at around 2% year-on-year can be observed in group 3, countries with a median income per capita of close to USD 30 000. Interestingly, corporate investments substantially outpaced the growth of SME credit in these countries, which is a possible sign of credit constraints that may be linked to a relatively high rate of non-performing loans for this group of countries. Both leasing and factoring activities also expanded at a faster rate than in both other groups.
SME loan shares
SME loan shares vary significantly across countries, for both stock and flow data. Defined as the share of SME loans over total business loans, they help set the above indicators on SME lending into the context of general business lending conditions.
The share of outstanding SME business loans ranged from around 20% or less in Canada, Chile, France, Indonesia, Russia and the United States, to levels of more than 70% in Korea, Latvia, Portugal, the Slovak Republic and Switzerland. It also appears to be negatively correlated with the overall size of countries and their economies. In addition, income per head and financial sector development appear to be positively correlated with the loan share that is directed toward SMEs. The 2017 median value of the SME loan share for participating mid-income countries stood at 36.4%, compared to 55.1% for high-income countries.4 Participating non-OECD countries’ SME loan share remains well below 50%, even in relatively small countries such as Georgia and Serbia. This may reflect a stronger preference of the banking sector in middle-income economies to lend to large enterprises. China represents an exception, both in terms of its size and income level, with 64.8% of corporate loans flowing to SMEs in 2016.
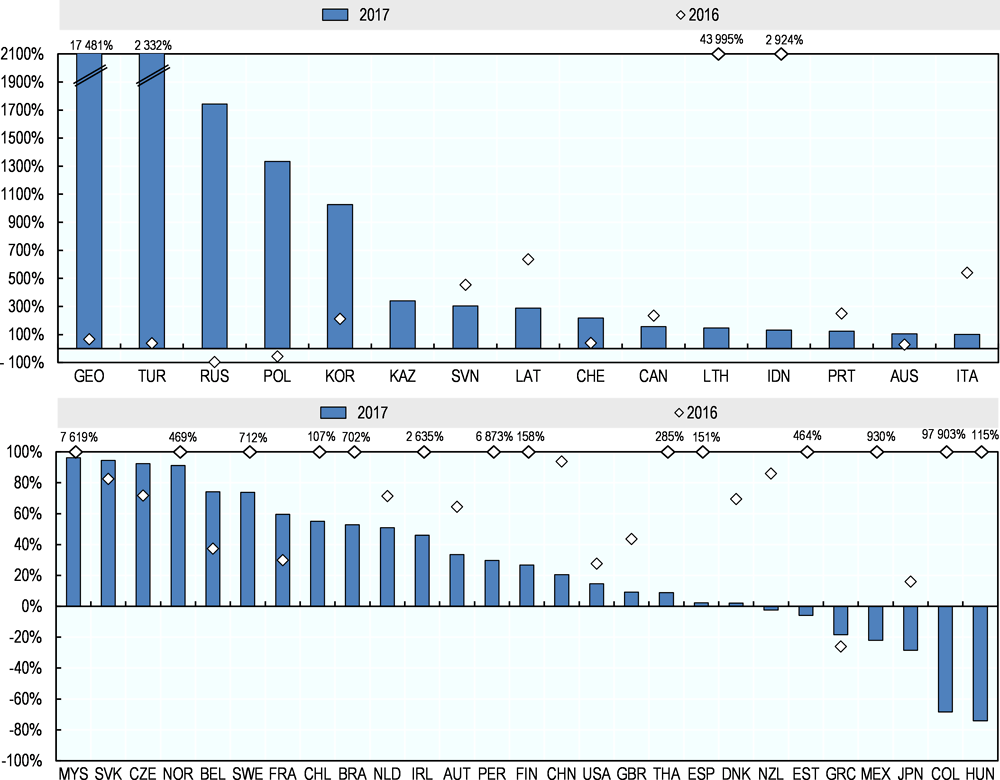
The median value for SME loan shares as a proportion of all corporate loans provides some insight into overall trends. It declined from 41.9% in 2007 to a low of 37.8% in 2012, indicating more problematic access to bank credit for SMEs compared to large enterprises over this period. Since 2012, the share of outstanding SME loans has started to slowly rise again; it stood at 40.24% in 2017, below its pre-crisis level. The SME loan share in new lending declined over 2007-09 as well, from 25.6% to 19.9%, but its evolution was somewhat more erratic in the following years, declining from 25.4% in 2016 to 23.1% in 2017 (Figure 1.4).
Note: China, Norway and Sweden refer to 2016 data instead of 2017.
Source: Data compiled from the individual country profiles of Financing SMEs and Entrepreneurs 2019.
There have been differences in the evolution of SME loan shares across countries in recent years. Table 1.1 describes the recent changes in SME loan shares in terms of business credit scenarios and highlights the different dynamics in total business and SME lending that underlie similar trends. Note that the table below considers inflation-adjusted data.
Although data on the evolution of SME loan shares may suggest that SMEs have generally experienced an improvement in access to bank financing, this indicator should be interpreted carefully and in context. An increase in SME loan shares can sometimes reflect trends in financing opportunities and strategies by large firms, rather than increased access to finance for SMEs, especially when occurring at a time of general lending contraction, during which large enterprises could be expected to be resorting to other forms of finance. In addition, demand-side factors also play a potentially large role in these developments. The continuous decline in the SME loan share in Brazil and the Russian Federation since 2013, for example, is likely due to more difficult access to bank financing for small firms vis-à-vis large enterprises. In other countries, such as the United Kingdom and the United States, a similar development appears to be driven to some extent by the wider adoption of financial instruments other than bank debt by SMEs.
Short-term versus long-term lending
Data on loan maturities reveals a clear shift in the SME loan portfolio of banks from short-term to long-term lending over the past decade. Short-term loans, defined as loans with an initial maturity of less than one year, such as overdrafts and lines of credit, are typically used to provide working capital, while long-term loans are more often used for investment purposes. In Spain, 9 out of 10 SME loans, and in Ireland close to 8 out of 10 are short-term, while in Brazil, Finland, France, Italy and Portugal, this figure stood at 1 in 5.
Looking at the median value of participating countries, an almost continuous increase in the share of long-term loans can be observed since 2007, with 2016 being the only exception. In 2017, the median value increased by almost 1.5 percentage points, from 74% in 2016 to 75.4%. The share has thus expanded by more than 10 percentage points over the 2007-17 period. The trend is broadly similar for both, outstanding SME loans and new SME lending (Figure 1.5).
Note: The median for outstanding loans was calculated based on data from Belgium, Brazil, Canada, Chile, China, Colombia, Estonia, France, Greece, Indonesia, Italy, Kazakhstan, Latvia, Malaysia, the Netherlands, Norway, Poland, Portugal, Serbia, Slovak Republic, Slovenia and Sweden. The median for new loans was calculated based on data provided by Austria, Czech Republic, Denmark, Finland, Hungary, Ireland and Spain. Data for Korea was not included as it refers to all businesses, while data for Mexico was not included as it refers to loans provided by INADEM only. All represented developments refer to inflation-adjusted data using the OECD GDP deflator. Data for non-OECD countries was extracted from the World Bank World Development Indicators.
Source: Data compiled from the individual country profiles of Financing SMEs and Entrepreneurs 2019.
The shift towards long-term lending since the financial crisis is corroborated by several studies that show that, both in the United States (Gray, 2017[6]), as well as in the European Union (Demary, Hornik and Watfe, 2016[7]), (Park, Ruiz and Tressel, 2015[8]), loans with a longer maturity have made up a larger share of banks’ portfolio in recent years.
Several elements may be driving this shift. First, with more alternative lending choices available, especially online, it has become much easier for small business owners to obtain short-term financing elsewhere to cover their working capital and liquidity needs. Alternative lending options, like working capital loans or small ticket equipment leasing, offer the flexibility and quick turnaround needed for owners to keep their businesses running smoothly and at the same time forego the often restrictive loan requirements of traditional banks. In a majority of EU countries for example, companies have started relying more on short-term loans from non-financial corporations, alongside an increased use of intra-company financing solutions (Demary, Hornik and Watfe, 2016[7]).
Furthermore, while the financial crisis negatively impacted the capacity of SMEs to generate retained earnings, recent improvements in their cash flow situation and profitability allow small businesses to rely more on internally generated revenues for their day-today operations, thus leading to a decline in external short-term financing (see section 1.5 on Self-financing).
Another potential explanation may be related to continuously declining interest rates, that possibly incentivise firms to borrow on longer terms, including for working capital purposes, so as to “lock in” low rates.
In addition, investment behaviour may also play a role. Although the recovery in corporate investments, as measured by gross fixed capital formation (GFCF) in the OECD area, remained relatively weak and uneven for quite some time after the crisis, it has started to gain pace recently. GFCF growth rates for the OECD as a whole were positive over the 2010-17 period, and even more than doubled between 2016 and 2017 from 1.7% to 3.6% (OECD, 2018[2]). The 2016 dip in the share of long-term SME lending coincided with a decline in investment activities in the same year, suggesting a link between both variables. If the 2017 pick-up in investment activities continues and gathers pace, one would expect SME demand for long-term credit to accelerate further in the future.
Credit conditions for SMEs
This section describes credit conditions for SMEs and entrepreneurs based on data on the cost of bank finance, collateral requirements and rejection rates. It also draws on findings from supply-side and demand-side surveys. Overall, available evidence suggests that demand for loans has remained broadly stable in recent years and collateral requirements and credit rejections remained at low levels.
Interest rates
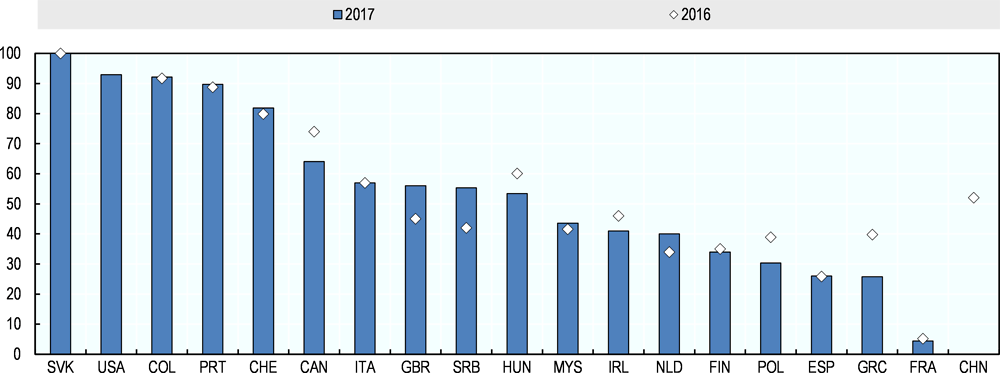
The cost for obtaining bank credit varies considerably among Scoreboard countries. In 2017, SME interest rates were highest in Brazil, followed by a number of other mid-income economies. New Zealand was the only high-income economy with interest rates close to 10%, well above the median of 3.8% (Figure 1.6). As in previous years, SME interest rates were lowest in European countries like Belgium, France and Sweden, all of which experienced a further decline compared to the previous year.
Note: Definitions differ across countries. Detailed information on sources and definitions is available in the full country profiles. The data refer to nominal interest rates.
Source: Data compiled from the individual country profiles of Financing SMEs and Entrepreneurs 2019.
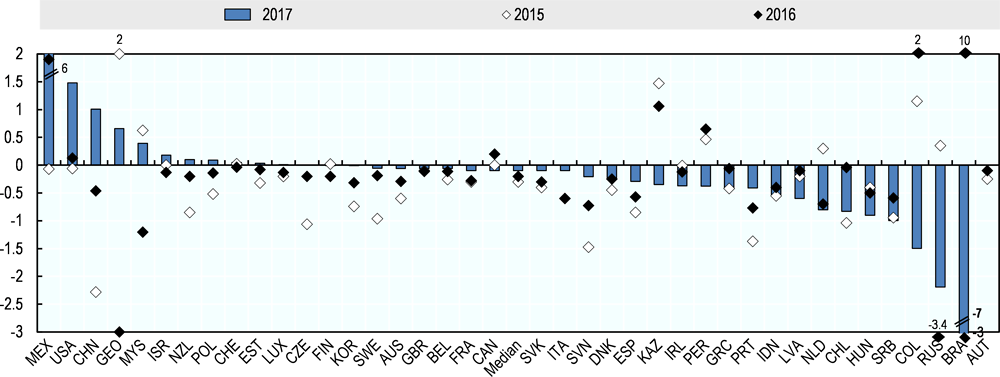
In the majority of Scoreboard countries, SME interest rates declined in 2017, an indication of improving credit conditions for SMEs, and in continuation with trends observed in previous years. Eleven countries bucked the trend and experienced increases in SME interest rates in 2017, up from previous years (Figure 1.7).
Note: Definitions differ across countries. Detailed information on sources and definitions is available in the full country profiles. The data refer to changes in nominal interest rates. 2017 data is not available for Austria.
Source: Data compiled from the individual country profiles of Financing SMEs and Entrepreneurs 2019.
Trends in SME interest rates are strongly linked with monetary policy. Mexico’s increase in SME interest rates, for instance, was the highest in 2017, at almost 6 percentage points, following an increase in the main monetary policy rate, which rose by 425 basis points between December 2015 and the end of 2017. Similarly, China and the United States both experienced a relatively strong increase in SME interest rates in 2017 coinciding with a tightening of monetary policies in the same year. Conversely, the countries experiencing the biggest declines in SME interest rates were Brazil and Russia, where SME interest rates declined by 6.6 and 2.19 percentage points, respectively, following a loosening of monetary policy.
In 2017, the median SME interest rate for Scoreboard countries declined by 0.10 percentage points, the 7th year in a row. This decline was, however, less strong than over the 2012-16 period. This illustrates that there may only be limited room for further interest rate reductions in many high-income countries, given that central bank interest rates are already at unprecedented lows, and that monetary policies have started to tighten in some participating economies. In addition, further decreases in the interest rate from already low levels may not spur SMEs to borrow more. Indeed, analysis of the current data indicates no significant relationship between SME credit volumes and interest rates.
The interest rate spread between loans to SMEs and large enterprises offers additional insights regarding SMEs’ credit conditions. Typically, SMEs are charged higher interest rates than large enterprises, given their inherently riskier profiles as borrowers. As such, a narrowing interest rate spread generally indicates more favourable lending conditions for SMEs, while a widening spread indicates tighter lending conditions.
Overall, no clear trend could be discerned in 2017, with the number of countries experiencing a rise in the interest rate spread roughly in balance with the number of countries, where the spread declined (See Figure 1.8).
Note: Definitions differ across countries. Detailed information on sources and definitions is available in the full country profiles. 2017 data for Austria and New Zealand are not available.
Source: Data compiled from the individual country profiles of Financing SMEs and Entrepreneurs 2019.
In 2017, Mexico experienced the largest increase in the interest rate spread, followed by Brazil, Kazakhstan and Georgia (1.26 percentage points). Chile, Latvia, Peru and Serbia experienced the strongest decline in the interest rate spread in 2017, where it dropped between 0.7 and 0.5 percentage points, even though in all these countries the spread remained above the Scoreboard median. The 2017 interest rate spread was higher in countries with higher interest rates, standing at more than 10 percentage points in Brazil and Peru. On the other hand, countries with low SME interest rates, such as Belgium and France, also exhibited a low spread between small and large firms.
Collateral requirements
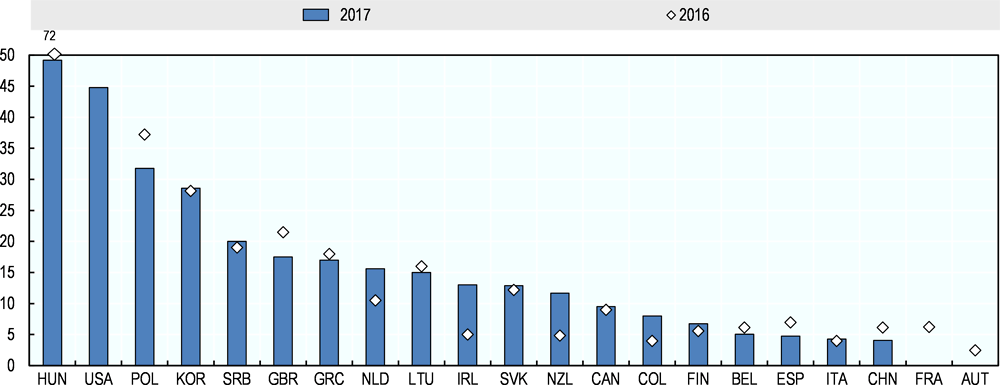
Data on collateral requirements come from demand-side surveys, whose methodology, sample and questionnaire differ from one country to the other. Cross-country comparisons should therefore be made with caution, and reporting improvements are needed to better assess the evolution in SME financing conditions in this respect.
Out of the 17 countries that provided 2016 and 2017 data, 7 experienced a decline in collateral requirements, which was most pronounced in Greece. Collateral requirements also decreased quite substantially in Canada, Hungary Ireland and Poland. Serbia, on the other hand, experienced the strongest increase in collateral requirements, followed by the United Kingdom and the Netherlands (Figure 1.9).
Note: Data not available in 2017 for China and in 2016 for the United States. Definitions differ across countries. Detailed information on sources and definitions is available in the full country profiles.
Source: Data compiled from the individual country profiles of Financing SMEs and Entrepreneurs 2019.
While there is no clear trend in collateral requirements, an increasing proportion of SME assets are intangible in nature (such as patents and other intellectual property, contractual agreements, trademarks, software), posing challenges for firms with a large portfolio of these assets. Against this backdrop, the thematic chapter of this Scoreboard edition assesses how intangible assets can be leveraged by SMEs to access finance, especially bank debt. It provides a summary of the main insights and results from a wider OECD study, which explores recent trends and policy implications for strengthening the use by SMEs of intangible as collateral to obtain bank financing (OECD, forthcoming[9]).
Rejection rates
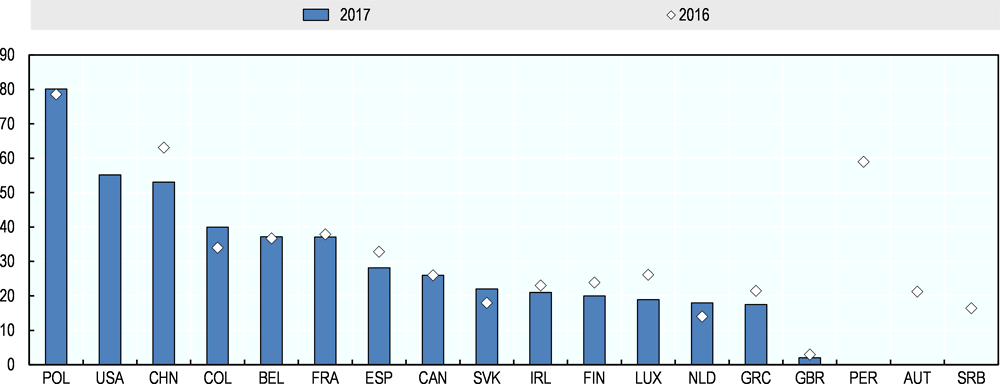
As with collateral, data on rejection rates are usually gathered from demand-side surveys, with limited comparability across countries. This indicator helps shed light on the supply of credit to SMEs and gauge the overall financing conditions they face. Higher rates of rejection are indicative of constraints in the credit supply and suggest that loan demand is not being met, either because the terms and conditions of the loan offers are deemed unacceptable, the average creditworthiness of loan applications has deteriorated, or banks are rationing credit.
Out of 18 countries that provided data for 2016 and 2017, 10 reported an increase in rejection rates. Hungary, Poland, the Slovak Republic and New Zealand experienced large swings in their SME loan rejection rates, while the year-on-year change among the other countries was fairly small (Figure 1.10).
Note: Data not available in 2017 for France and Austria, and in 2016 for the United States. Definitions differ across countries. Detailed information on sources and definitions is available in the full country profiles.
Source: Data compiled from the individual country profiles of Financing SMEs and Entrepreneurs 2019.
SME loan applications
About one-fourth of SMEs applied for credit over the last six months, illustrating that the majority of SMEs do not seek external financing. There are however large cross-country differences, with Polish SMEs far more likely to apply for credit than their counterparts in the United Kingdom, for example. Of the 14 countries that provided data on SME loan applications for 2017 and 2016, 8 indicated a decline, while 5 indicated an increase in SME loan applications. SME loan applications decreased by close to 10 percentage points in China, by more than 7 percentage points in Luxembourg, while Finland, Greece and Spain experienced a contraction of about 4 percentage points. Colombia recorded the highest increase in 2017, at 6 percentage points (Figure 1.11).
Note: Definitions differ across countries. Detailed information on sources and definitions is available in the full country profiles. 2017 data for Peru, Austria and Serbia are not available. 2016 data for the United States are not available.
Source: Data compiled from the individual country profiles of Financing SMEs and Entrepreneurs 2019.
An increase in the ratio of SME loan applications is indicative of a stronger demand for credit, and the data should be interpreted in tandem with the rejection rate and loan growth, as lower application rates could be due to either a lower demand for external financing, or to a rise in discouragement. In France, for example, the SME loan application rate remained broadly stable over the 2012-17 period, even though rejection rates almost halved over that time, possibly suggesting that demand for credit has lagged behind supply. This is corroborated by recent survey data, described in more detail in the next section, which also suggests that the demand for credit appears to have remained broadly stable over the reference period.
Additional evidence on credit conditions from survey data
Survey data illustrates that credit conditions remained relatively loose and interest rates on the decline in most of the Euro area, Japan and the United States, while the availability of credit increased recently in the United Kingdom. In addition, the selected studies discussed in the below sections indicate that SMEs continue to consider bank finance to be relatively available, especially when compared to the period following the financial crisis. While these surveys provide important insights, the comparability among different survey exercises is limited and should be improved. The section on Recommendations for data improvements at the end of the chapter provides guidance in this area.
Euro zone
The ECB Survey on SME access to finance (SAFE), undertaken every year, provides insights into how credit conditions are perceived by SMEs in the euro area.5 Financing conditions continued to improve for European SMEs, but at a slower pace in 2018. In fact, a majority of SMEs reported an increase in interest rates in H2 2018 for the first time in nine semesters, and the net balance of firms reporting greater availability of bank loans decreased for the first time in 13 semesters. Overall, demand for loans over the 2011-18 period has remained broadly constant in spite of declining rejection rates and an increasing share of fully granted loan applications (Figure 1.12).
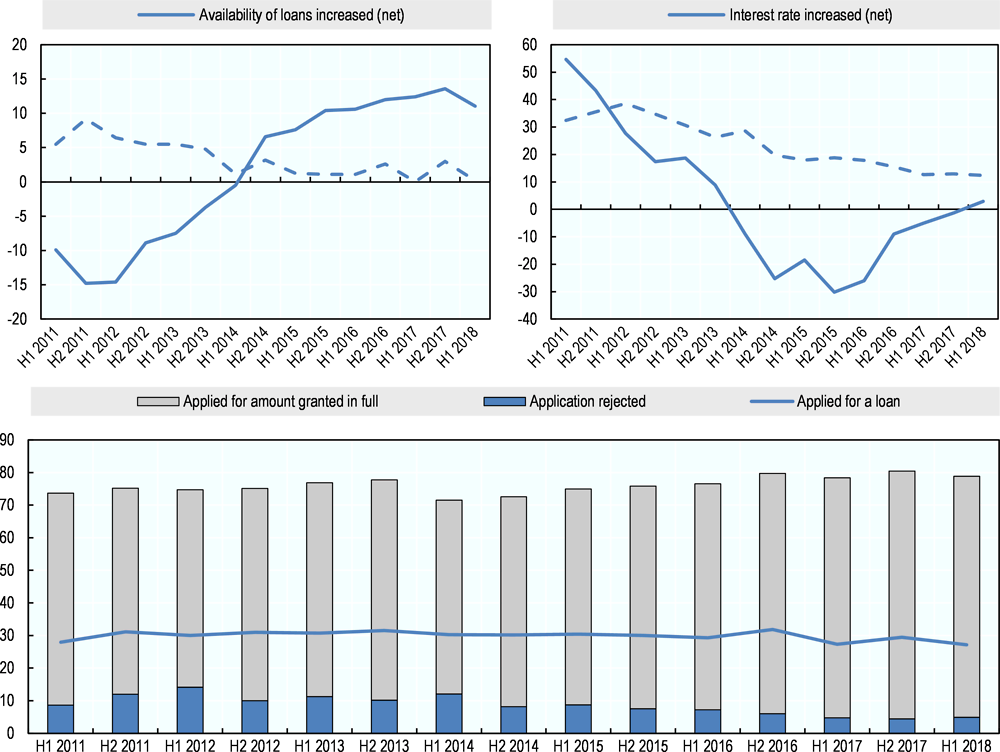
Note: The net percentage is the difference between the percentage of firms reporting that the given factor has improved and the percentage reporting that it has deteriorated or the difference between the percentage reporting that it had increased and the percentage reporting that it has decreased.
Source: ECB (2018), last surveys were held in from March to September 2018.
The net percentage of SMEs reporting an improvement in the availability of bank loans decreased for the first time since H2 2011 to 11% (from 14%) in 2018, and SMEs expect this trend to continue in the coming semesters.
The percentage of SMEs that report difficulties in accessing bank loans has diminished in most countries. Overall, in this survey round, 27% of SMEs applied for a bank loan (from 29% in the previous round). The rate of fully successful loan applications reached 74% (down from 76%), while the rejection rate rose slightly to 5% (from 4%). At the same time, 31% (from 26%) of SMEs continued to signal higher levels of other costs of financing, such as charges, fees and commissions (European Central Bank, 2018[10]). These observations and trends are corroborated by the fact that the external financing gap of SMEs remained negative at the euro area level. Only SMEs in Greece reported a positive financing gap, suggesting more considerable supply-side issues linked with bank credit than in the rest of the euro area.
Overall, however, the survey also confirms that large firms continued to benefit from better access to financing than SMEs. Around 45% of large firms applied for a bank loan, with a success rate that was much higher (84%) and a rejection rate that was much lower (1%) than those of SMEs. According to the survey results, the average interest rate charged to large enterprises on credit lines was about 170 basis points lower than that paid by SMEs. (European Central Bank, 2018[10]).
United States
In the United States, the NFIB Research Foundation collects Small Business Economic Trends data on a monthly basis since 1986. Evidence from this survey shows that the financial crisis had a marked impact on reported loan availability, which bottomed out in 2007, and steadily recovered afterwards to levels broadly comparable to the pre-crisis period. From the beginning of 2015 to October 2018, credit availability remained broadly constant.
The October 2018 survey illustrates that only 2% of surveyed small businesses in the United States stated that financing was their main concern (stable from October 2017), and only 4% reported that their financing needs were not being met (+1 percentage point from October 2017), indicating the relative ease and affordability of accessing credit. (Dunkelberg and Wade, 2018[11]).
The United States Federal Reserve Board surveys senior loan officers on their banks’ lending practices on a quarterly basis, including a question on the evolution of credit standards for approving small business loans or credit lines6. According to the October 2018 survey, respondents indicated that, on balance, they slightly eased their standards and terms on commercial and industrial (C&I) loans to large and mid-sized firms and left their standards unchanged for small firms, citing increased competition from other lenders as the main reason for easing, as well as a less uncertain economic outlook and an increased tolerance for risk.
The survey also includes a question on demand for loans from SMEs7. For most of 2016 and the first half of 2017, demand for credit in the United States weakened. According to the October 2018 survey, a modest net percentage of domestic banks reported weaker demand for loans to all firms (United States Federal Reserve Board, 2018[12]).
Japan
In Japan, perceived lending attitudes deteriorated sharply between 2008 and 2009, according to the TANKAN survey, a quarterly poll on business confidence published by the Bank of Japan8. Between 2010 and 2015, financing conditions loosened, and from 2015 onwards lending attitudes for small and medium-sized enterprises have by and large remained constant and accommodative (Figure 1.13). It is noteworthy that the perceived lending attitudes for large and medium-sized enterprises have become largely similar in recent years, in contrast with the pre-crisis period, when medium-sized firms faced tighter credit conditions. The gap between small and large firms has remained large, however (Bank of Japan, 2018[13]).
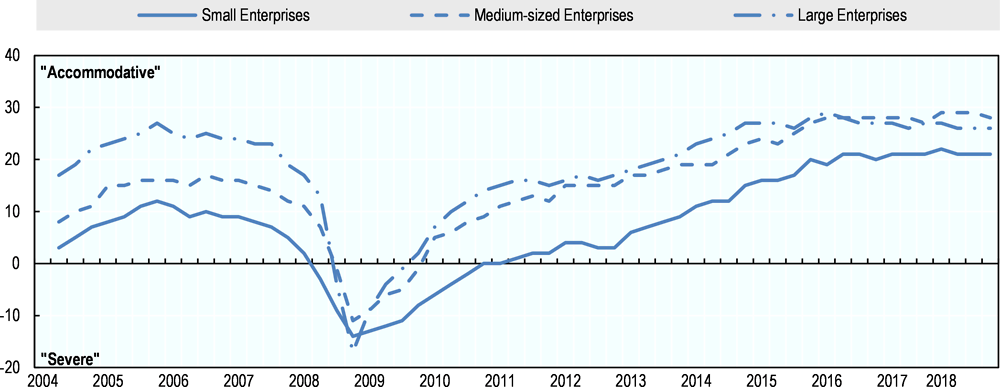
Note: Diffusion index of "Accommodative" minus "Severe," percentage points.
Source: Bank of Japan.
United Kingdom
Responses to the 2018 Q3 Credit Conditions Survey from the Bank of England9 shows that the availability of credit provided to small businesses appeared to have increased, with lenders reporting for the second semester in a row greater credit availability to businesses since 2015 Q3. In addition, lenders reported a slight increase in demand for corporate lending from medium non-financial businesses in the third quarter of 2018, which was expected to remain broadly unchanged until the end of the year. On the other hand, more recent data illustrate an uptick in interest rates since the second half of 2017, as well as some tightening in credit conditions in the first half of 2018.
Asset-based finance
Asset-based finance comprises all forms of finance that are based on the value of specific assets, rather than on the credit standing, and represent a well-established and widely used alternative for many SMEs. Within this category, leasing and hire purchases on the one hand, and factoring and invoice discounting on the other are the most well-known and widely used instruments in most parts of the OECD. In the case of leasing and hire purchases, the owner of an asset provides the right to use of the asset (like motor vehicles, equipment or real estate) for a specified period of time in exchange for a series of payments. Factoring and invoice discounting are financial transactions, whereby a business sells its accounts receivable to another party at a discount.
Leasing and hire purchases
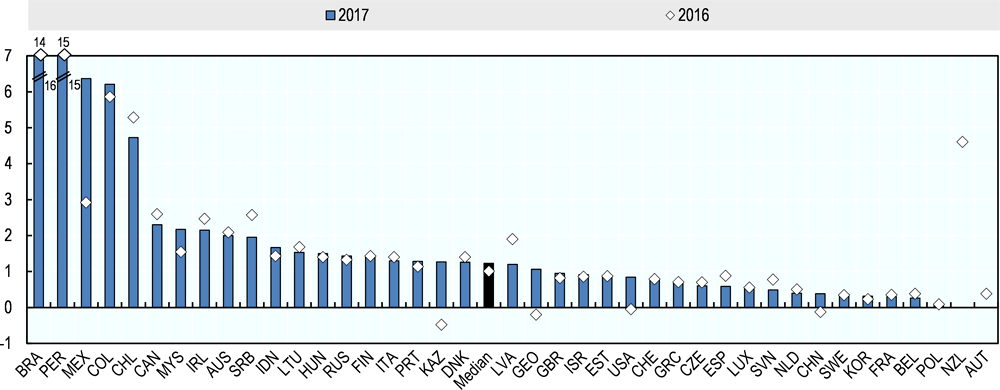
Data from national sources, complemented by information from Leaseurope, show a considerable increase in leasing and hire purchase activities in 2017 in many countries, in line with developments in previous years.
In 26 out of 34 countries where data on leasing and hire purchase activities were available, inflation-adjusted volumes rose in 2017, continuing the trend documented since 2014. In Australia, Chile, Hungary, Italy, Korea, Lithuania, Poland and Spain, volumes rose by more than 10% year on year. The median growth rate in 2017 stood at 6.2%, slightly down from previous years (Figure 1.14).
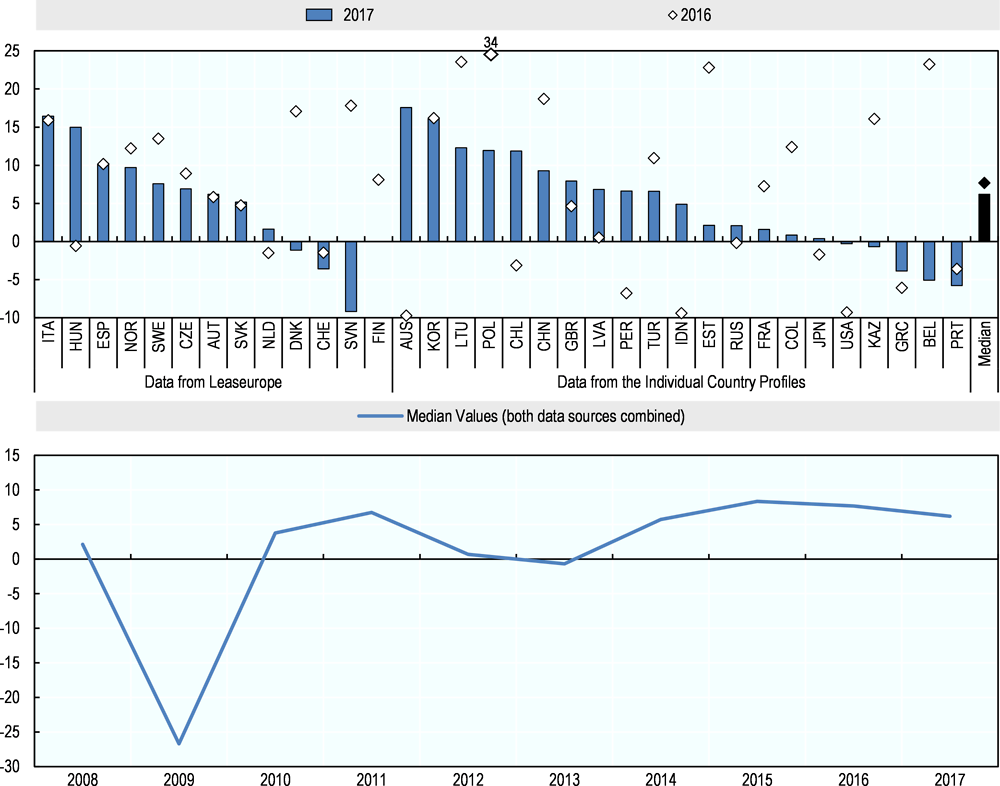
Note: The median value refers to data from both sources. Data for Australia refers to leasing and hire purchases as flows. Japan refers to leasing alone, as stocks. All represented data are adjusted for inflation using the OECD GDP deflator. Data for non-OECD countries was extracted from the World Development Indicators, World Bank.
Source: LeaseEurope and data compiled from the individual country profiles of Financing SMEs and Entrepreneurs 2019.
Anecdotal evidence points to both demand-side and supply-side drivers behind the growth trends of leasing activities. Leasing appears to be gaining acceptance as a viable alternative to traditional bank debt among a growing number of small businesses, as awareness about the pros and cons of leasing as a source of finance has increased. The leasing trend may also be indicative of a wider societal trend towards usage rather than ownership. In addition, financial institutions around the world have integrated their relatively independent leasing units more closely within their structures (LeaseEurope, 2018[14]).
Factoring
Data on factoring volumes are sourced from Factors Chain International (FCI), a sector organisation. In 2010 and 2011, volumes rose in a majority of scoreboard countries, with median growth amounting to 15.3% and 13.8%, respectively, suggesting that this source of finance was not affected by the crisis and thus provided an alternative for finance-constrained SMEs. In recent years, median growth in factoring volumes has increased, but at a considerably lower pace. Volumes were up in 24 out of 43 in 2017, albeit with considerable country variation and with volumes showing large fluctuations. In Poland, for example, volumes rose by 12% in 2016, and then decreased by almost a third in 2017. In China, volumes declined by more than 15% between 2015 and 2016, but then rebounded by almost 30% the next year (Figure 1.15).
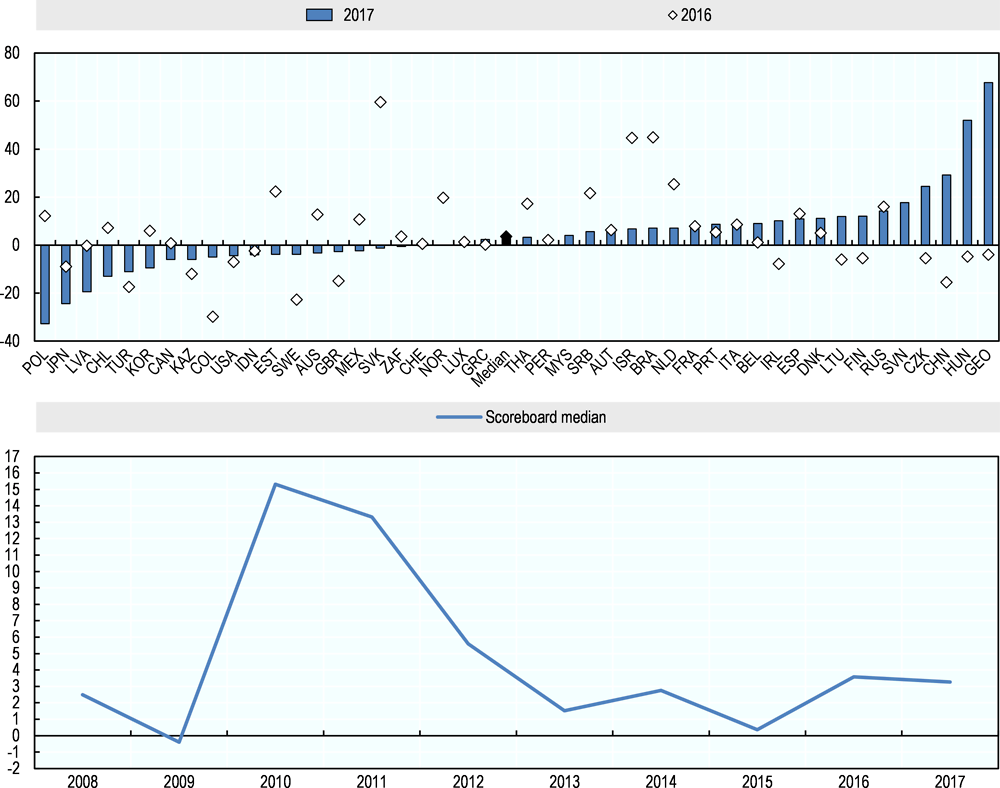
Note: All represented data are adjusted for inflation using the OECD GDP deflator. Data for non-OECD countries was extracted from the World Development Indicators, World Bank.
Source: Factors Chain International (2017).
Factoring services expanded in the immediate aftermath of the financial crisis. In recent years, the growth in international factoring considerably outstripped the growth in domestic factoring, and the demand for factoring services from internationally active SMEs appears to be driving the overall growth of the industry (United Capital Funding, 2018[15]). Moreover, factoring often provides a number of additional financial services beyond the provision of short-term credit, such as credit protection, credit management, accounts receivable book-keeping and collection services, which may appeal to many SMEs (Degl’Innocenti, Fiordelisi and Trinugroho, 2018[16]).
Despite an increased take-up of factoring by firms active in foreign markets, there is evidence of an unmet financing demand from many SMEs for conducting cross-border trade, including for factoring services. The World Trade Organisation estimates that half of trade finance requests from SMEs worldwide are rejected, compared to 7% of multinational firms (World Trade Organization, 2016[17]).
Self-financing
While research has largely focused on the availability and importance of external financing sources for SMEs, self-financing also plays a crucial role, although its importance varies across countries, firm size and age, as well as by business type.
On average, start-ups are more likely to rely on internal funds than more mature companies, given their higher levels of human capital-specific assets, lower levels of traditional tangible assets, and less established reputation and historical performance (Paroma and Mann, 2010[18]).
SMEs of all sizes tend to have a strong reliance on internal funds. A 2016 study on the financing patterns of European SMEs found that although many of the firms relying exclusively or predominantly on internal funds were micro-businesses (1-9 employees), approximately 18.1% of them were small enterprises (10-49 employees), and 12.8% were medium-sized enterprises (50-249 employees) (Moritz, Block and Heinz, 2016[19]).
Estimates indicate that around one in three SMEs in the EU 28 rely solely on internally generated sources of revenue for their day-to-day operations and investments (Moritz, Block and Heinz, 2017[20]). According to the ECB’s Survey on the Access to Finance of Enterprises in the Euro Area, one in four European SMEs surveyed between April and September 2018 considered internal funds an important alternative source of finance for their business. Similarly, 19% considered funds from family, friends or related companies as important. Additionally, internal funds seem to have become an increasingly important source of finance in recent years, which has resulted in a relative decrease in the demand for certain forms of external financing. For instance, the proportion of SMEs citing sufficient internal funds (as a reason for not applying for loans) has consistently increased, from 35% in 2014 to 44% in 2018. Concomitantly, the proportion of SMEs not applying for bank loans because they were “discouraged” has consistently decreased from 8.4% in 2014 to 74.5% in 2018(European Central Bank, 2018[16]) (European Central Bank, 2018[10]).
The BACH database, hosted by the Central Bank of France, collects comparable data on the aggregate profitability of SMEs for nine countries from the euro area also participating in the scoreboard exercise broadly confirms this picture. Recent evidence from this database illustrates that SMEs became more profitable on average over the 2012-16 period. This trend may suggest an increased availability of internal funds for self-financing purposes, as measured by the EBITDA (earnings before interest, taxes, depreciation and amortisation) to net turnover ratio for the median SME operating in these countries (meaning that half of the SMEs have a higher EBITDA and half of them a lower one) (Figure 1.16).
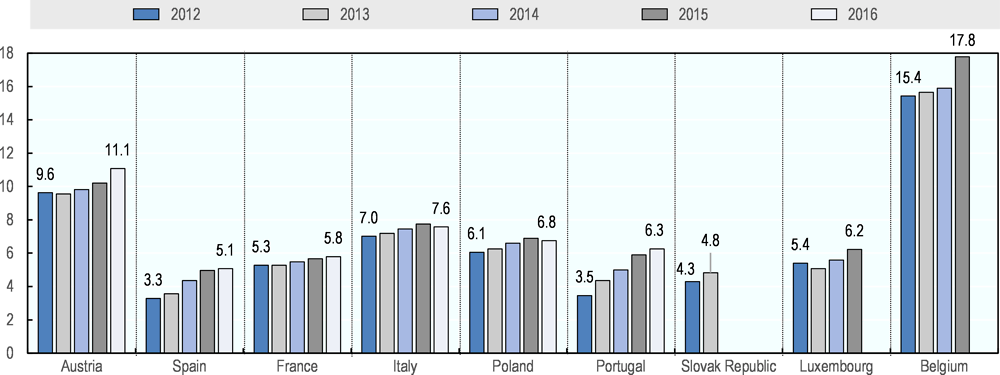
Note: This ratio assesses the profitability of a company by comparing its revenue with its earnings, giving the remaining earnings after all operating expenses in percentage. 2016 data is not available for Luxembourg and Belgium. Data from 2014 to 2016 is not available for the Slovak Republic.
Source: Bank For The Account Of Companies Harmonized (BACH) – Banque de France.
Equity sources of financing
With the tightening of bank lending and credit conditions for SMEs in the aftermath of the global financial crisis, increasing attention has been placed on the potential of capital markets to offer alternative sources of financing. This is especially relevant for innovative start-ups with high growth potential, which were hit hardest by the decline in bank lending due to their higher risk profile, and which typically rely on external equity in addition to debt to finance their growth ambitions.
In the United Kingdom, for example, a recent report identified a lack of finance as a major constraint for high-potential firms to scale up (HM Treasury, 2017[21]). Another study indicates that financing constraints are considerable for innovative firms based in the United States, especially in their early stages, and that government grants do not usually crowd out private capital (Howell, 2017[22]). These difficulties arise despite a relatively wider availability of financial instruments other than straight debt in these two countries, suggesting that innovative SMEs with high growth potential could face even more considerable financial constraints in other countries.
Venture capital investments, private debt, listings on stock exchanges, as well as online alternative financing and business angel investments are discussed in this section.
Venture capital
VC investments were up for 26 out of 39 countries in 2017, following the 2016 trend. The median growth rate stood at 17.3% in 2016 and at 15.7% in 2017 (Figure 1.17). This contrasts with the 2011-15 period, when median volumes fell. In the United States, the biggest market by far, volumes rose by 11% in 2017, after dropping 6.3% in 2016. However, it is important to keep in mind that data on venture capital (VC) investments are highly volatile, especially for smaller countries, where a single deal may impact overall volumes considerably (as the data for Latvia and Luxembourg illustrate, for example).
Note: 2017 data are not available for China, Greece, and South Africa. Data are YoY change of current USD volumes, at the exception of Chile, China, Colombia, Indonesia, Japan and Turkey, for which these changes express variations of volumes in current local currencies.
Source: OECD Entrepreneurship at a Glance; based on Entrepreneurship Finance Database, and data compiled from the individual country profiles of Financing SMEs and Entrepreneurs 2019 when the information was not otherwise provided.
Government interventions have played a role in the recovery of VC investments in recent years. In Europe in particular, government agencies are the most important source of VC funds (BPIFrance et al., 2016[23]). Estimates indicate that the investment activity backed by the European Investment Fund (EIF) represented 41% of total investments in Europe in 2014, up from 29% in 2007 (Kraemer-Eis, Signore and Prencipe, 2016[24]).
In addition, there appears to be a link between levels of venture capital investment and the overall health of the financial sector and economic growth (Pradhan et al., 2017[25]). The broadly favourable macro-economic conditions experienced in recent years are thus likely to have contributed to the recovery in VC investments.
Private debt
Private debt is a relatively recent instrument that has gained traction since the crisis, following tightened regulation on commercial banks. Specialised loan funds operate through an originator, typically unconnected to a banking institution, which originates a portfolio of SME loans. Many of the legal and institutional features of this instrument are similar to the private equity market, with the crucial difference that it engages in debt.
While commercial banks tend to operate on the low-risk, low-yield end of the financing spectrum, alternate lenders cover its entire range. The private debt market is especially relevant for larger and more mature SMEs facing a major transition, such as a change in ownership, expansion into new markets and/or activities, or acquisitions. The global private debt market more than doubled between 2011 and 2017. North America is the most developed market, accounting for around two thirds of activities over this period, while Europe’s share has averaged around 30%. The debt market is relatively small in Asia, and almost non-existent in other regions of the world (estimated at around 1 USD billion in 2017) (McKinsey, 2018[26]).
Source: Preqin.
Globally,“dry powder,” i.e. money that has been raised for investment purposes, but has not yet been invested, stood at a record high of USD 236 billion in 2017, suggesting a dearth of attractive investment opportunities (Preqin, 2018[27]). Although these numbers are not SME-specific, most of the investments are thought to flow to SMEs, rather than large firms.
Listings on stock exchanges
Listings on public stock exchanges constitute another means to attract external sources of finance, and are especially relevant for larger SMEs. While accessing finance from outside investors represents the prime reason for SMEs becoming listed, other factors often play a role, too, according to a recent large-scale survey. Improved creditworthiness and the possibility of opening up other sources of finance, such as straight debt, are stated by almost one half and one fourth of surveyed SMEs, respectively. In addition, non-monetary factors such as brand recognition and more visibility are also commonly stated (World Federation of Exchanges & Milken Institute, 2017[28]).
Table 1.3 provides an overview of specialised vehicles for SME markets on stock exchanges that typically provide less onerous information and due diligence requirements. 30 out of 46 scoreboard countries have an SME market in place. In several cases, there is more than one SME market in a country, and a few SME markets span more than one country. The table illustrates a wide variation in the average market capitalisation of listed SMEs across countries, from 10 USD million in Greece to more than 1 USD billion at the ChiNext vehicle of the Shenzen stock exchange.
The market capitalisation of most of these markets represents only a very small fraction of the capitalisation of the overall stock exchange, with the exception of Ireland, Korea and Japan. For 14 out of 24 stock exchanges, the market capitalisation of SME listings stood at less than 1% of overall capitalisation in 2016 (World Federation of Exchanges, 2017[30]).
Several factors may hold back more SMEs from listing on stock exchanges. A recent survey among listed SMEs, investors and market intermediaries confirms many of the hurdles identified in the literature (Nassr and Wehinger, 2015[31]). It shows that many SMEs are not aware of the relative costs and benefits needed to make an informed decision about becoming listed. In addition, compliance with listing requirements, although often less onerous than for large firms, is considered to be time-consuming and expensive, even though investors and would-be investors would value more and better information. The lack of scale and liquidity of secondary markets is considered a crucial point for all surveyed parties (World Federation of Exchanges, 2017[32]).
Despite the challenges, the number of listed SMEs on public exchanges expanded by 13.2% between 2016 and 2017, and market capitalisation by 16.7%. Market capitalisation of the SME segment rose in 14 out of 20 exchanges, and by more than 50% in Malaysia, Korea, Norway, the Russian Federation, South Africa and Spain (Table 1.5).
Policy efforts to stimulate the market may play a role in this expansion. As an illustration, several new SME exchanges were created around the world in 2017 and 2018. In addition, exchanges increasingly engage in market outreach to potential businesses and dedicated support to raise the attractiveness of being listed (WFE, 2018[29]).
Online alternative finance
Online alternative finance is a mean of soliciting funds from the public for a project/ firm through an intermediate platform, usually through the Internet. It comprises both debt-based and equity-based activities.
Debt-based activities encompass business, property and consumer (when applicable for SMEs) loans from peer-to-peer activities, from institutional funders, or directly from the platform. It also includes invoice trading and debt-based securities.
Equity-based activities include equity-based, revenue-sharing, reward-based, donation-based and real estate crowdfunding.
The potential of online alternative finance to complement traditional sources of finance has increased substantially in recent years. As reported in previous scoreboard editions, an increasing number of governments are seeking to create a framework for crowdfunding by designing regulations for the industry.
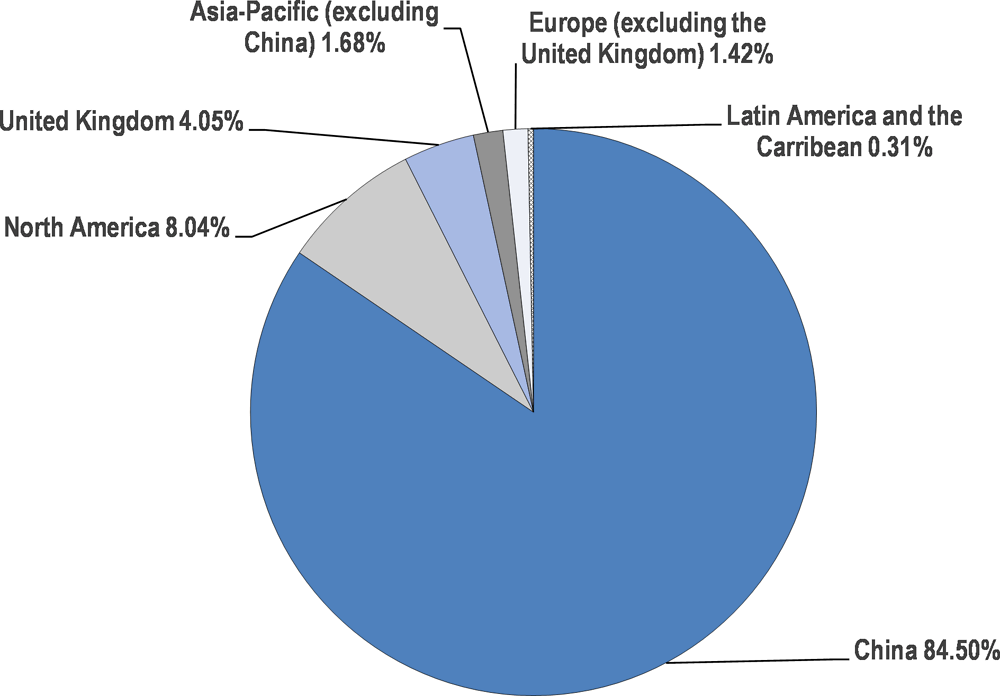
Online alternative finance activities for for-profit businesses are strongly concentrated in a few countries. China has by far the biggest market, with a share of 84.5% of business online activities, followed by the United States and the United Kingdom with shares of 7.6% and 4.1% respectively (see Figure 1.19). Australia (at 0.60% of the global volume), Korea (at 0.48%) and Canada (at 0.40%) follow at a considerable distance. Volumes in continental Europe remain relatively modest in comparison, with France the most active market (with a share of 0.25%), followed by the Netherlands and Italy. Latin America accounts for a very small share of global online alternative finance volumes with Chile having the largest market at 0.11% of global volumes.
Note: All the data are expressed in USD.
Source: Regional reports of the Cambridge Centre for Alternative Finance at the University of Cambridge.
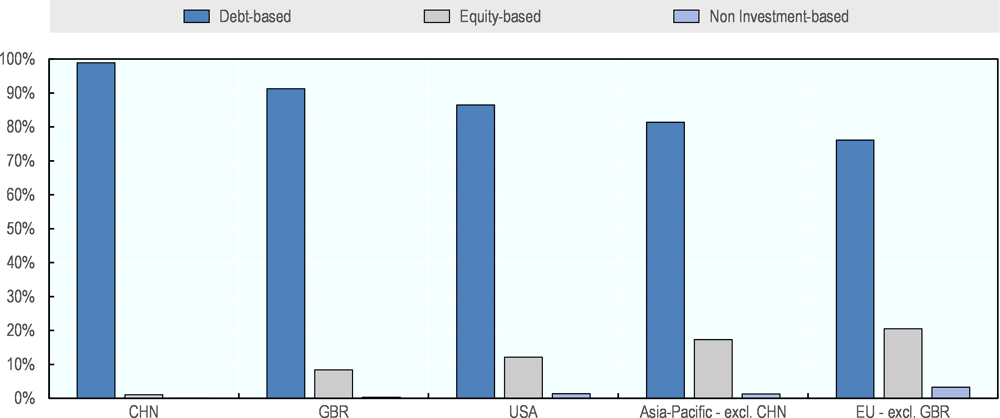
In all countries, debt-based online activities are most common, followed by equity crowdfunding and non-investment based crowdfunding10 representing only a very small share of the market. There are some noticeable differences across regions, however. In China, for instance, only 1.1% of all activities are equity-based, compared with more than 20% in Europe (excluding the United Kingdom) (see Figure 1.20).
Note: All the data are expressed in USD.
Source: Regional reports of the Cambridge Centre for Alternative Finance at the University of Cambridge.
The online alternative finance market for businesses has expanded rapidly in recent years. In many countries, volumes expanded more than tenfold between 2015 and 2017, but typically from low volumes. In countries with an already well developed online alternative finance market, growth rates are typically lower and falling. In China, for instance, the growth rate decelerated from 94% in 2016 to 20% in 2017. In the United Kingdom and the United States, a similar development can be observed (with growth rates slowing down from 44% in 2016 to 9% in 2017 and from 28% in 2016 to 15% in 2017 respectively).
Note: All the data are expressed in USD.
Source: Regional reports of the Cambridge Centre for Alternative Finance at the University of Cambridge.
Business angel investments
Business angel investing is an important source of financing for early-stage start-ups, especially those which do not have own resources and/or are unable to access bank credit, but are not yet ripe for venture capital funding. Angel investors tend to be wealthy individuals, or groups of them, who provide financing, typically their own funds, in exchange for convertible debt or ownership equity. This enables entrepreneurs to scale up to a stage where venture capitalists may step in. It represents a potential means of narrowing the financing gap for early-stage, innovative SMEs, but is not suitable for all firms’ profiles (OECD, 2016[33]).
Data collection on business angel investments suffers from many shortcomings (OECD, 2016[33]). As a result, the so-called ‘visible market’ only accounts for a minority of the whole market, and trends may be hard to analyse.
The European Business Angels Network (EBAN) has attempted to document the state of this industry in Europe since 2000. According to the most recent estimates available, investments increased by 9% in 2017, to EUR 7.3 billion (10% of this figure being in the “visible market”). Geographical disparities remain strong, with the United Kingdom considered to be leading the European market, followed by Germany, France and Spain (EBAN, 2018[34]).
In the United States, the Center for Venture Research has been assessing the state of business angel investments since 2002. In 2017, volumes increased by 12.6% compared to 2016, reaching USD 23.9 billion (Center For Venture Research, 2018[35]). Activities are concentrated in California and New York (The American Angel, 2017[36]).
Payment delays, bankruptcies and non-performing loans
Payment delays trended downward in 2017. Bankruptcies also remained on a downward path in 2017, with a negative median bankruptcy growth rate for the fifth consecutive year. Data on NPLs indicate a small improvement in 2017 compared to the previous year. However, this overall downward trend masks continuously high NPL rates in a number of countries, particularly those that were hit hard by the crisis.
Payment delays
The 2017 data on payment delays showed a decline in 10 countries for which data are available and an increase in 5 (with another 5 countries remaining constant). The decline varied significantly across countries. China is a notable example, where payment delays fell by more than 21 days, from 65.2 days in 2016 to 44 days in 2017; however, payment delays remain high by international comparison. Only Chile, Israel and the United States had similarly high payment delays in 2017, while the median value for all Scoreboard countries averaged around 13 days.
Payment delays increased sharply in Colombia, to 95 days, the highest level among participating countries, and much less strongly in Chile, New Zealand and Sweden. The median value declined in 2017 by half a day compared to 2016 (Figure 1.22). This development is generally in line with the trend observed over the 2011-15 period, where an almost across the board reduction in payment delays was observed.
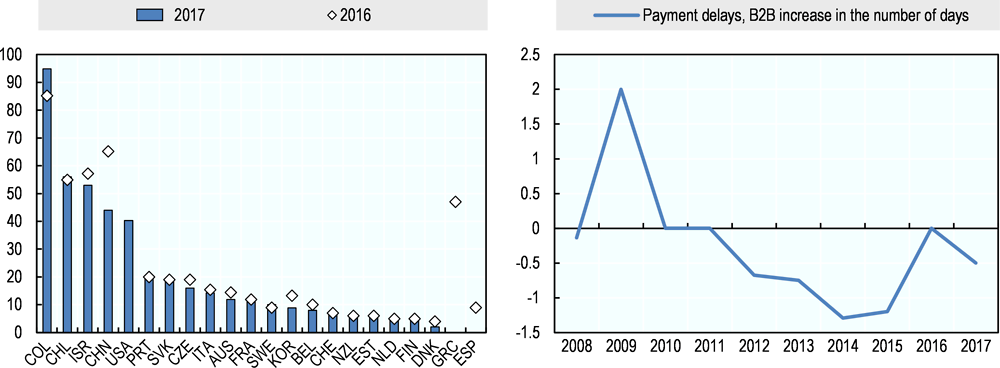
Note: Definitions differ across countries. Detailed information on sources and definitions is available in the full country profiles. 2017 data for Greece and Spain are not available. 2016 data for the United States are not available.
Source: Data compiled from the individual country profiles of Financing SMEs and Entrepreneurs 2019.
Bankruptcies
In 2017, the number of bankruptcies was down in 20 out of 34 countries for which data are available. The median year-on-year change in bankruptcies was negative for the fifth consecutive year, declining by 3.7% in 2017, although the decline was less pronounced than in previous years (Figure 1.23). Cluster analysis indicates that the decline in bankruptcy rates was broadly similar in different groups of countries, and happened largely irrespective of income level, economic growth, credit conditions, loan growth and other indicators.
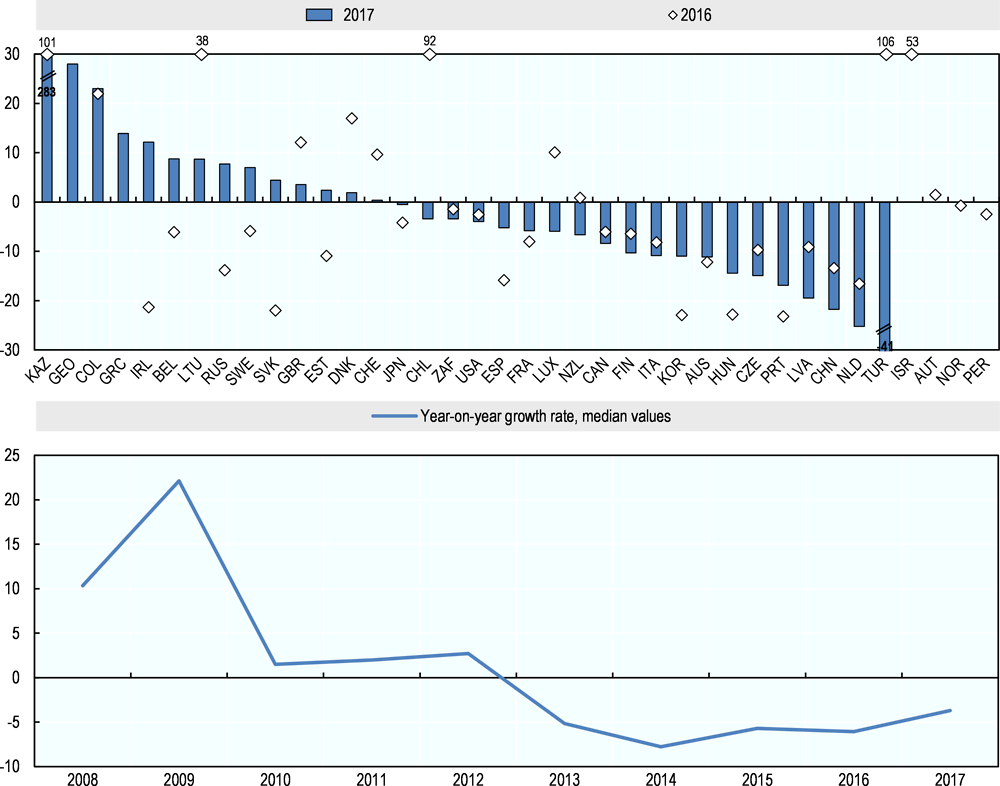
Note: Definitions differ across countries. Detailed information on sources and definitions is available in the full country profiles. Data for Kazakhstan: +100% in 2016 and +283% in 2017.
Source: Data compiled from the individual country profiles of Financing SMEs and Entrepreneurs 2019.
While bankruptcy data over time is broadly indicative of the cash flow situation of enterprises, there are important differences in the length and complexity of bankruptcy procedures between countries, meaning that insolvent enterprises are not declared bankrupt at the same pace. While bankruptcies upon court ruling constitute a very common path to firm closure or liquidation in some countries, this is not universally true. This also implies that legal and regulatory reforms that were introduced over this period can affect the numbers. A case in point is Chile, where only 6 firms were declared bankrupt in 2014. After a revised liquidation law passed in late 2014, bankruptcies rose to 154 and 295 in 2015 and 2016, respectively, before declining again to 285 in 2017.
Non-performing loans (NPLs)
Based on regression analysis, changes in SME NPLs appear to affect the outstanding stock of SME loans at borderline significance, with a one percentage point increase of the SME NPL rate driving down the outstanding stock by around one-third of a percentage point. In some countries like Hungary, Ireland, Italy and Portugal, high NPLs coincide with negative growth in the outstanding stock of credit.
An analysis of the data on non-performing loans shows that these are generally more prevalent among SMEs than among the overall business population, with the median value of NPLs for SME lending systematically higher than the value for all corporate lending. In Brazil, Chile, Georgia, the Slovak Republic and South Africa, for example, an SME loan was about twice as likely to be non-performing than a loan for the entire business sector, and in Lithuania, Peru and the Russian Federation even around three times as likely. In other countries such as China, Estonia, Israel, Kazakhstan, Lithuania, Poland, Portugal, Serbia, Thailand and the United States, the gap is much smaller. On the other hand, in Georgia, Israel and Korea, NPLs are more common among large business loans than SME loans. SME NPLs declined in 19 countries between 2016 and 2017, to the greatest extent in Serbia, Slovenia, Lithuania and Hungary, following a large increase after the financial crisis. In eight other countries, the SME NPL rate rose modestly in 2017 (Figure 1.24). The Scoreboard median values show that NPLs for both SME and total business loans have been declining since 2011, when they fell to their lowest point over the reference period, although in both cases trends have been more or less stagnant since. In most other countries, NPLs rose in the aftermath of the financial crisis, but have since levelled off to roughly pre-crisis levels; however, NPL rates remain stubbornly high in Greece and Portugal, two countries that were hit particularly hard by the crisis.
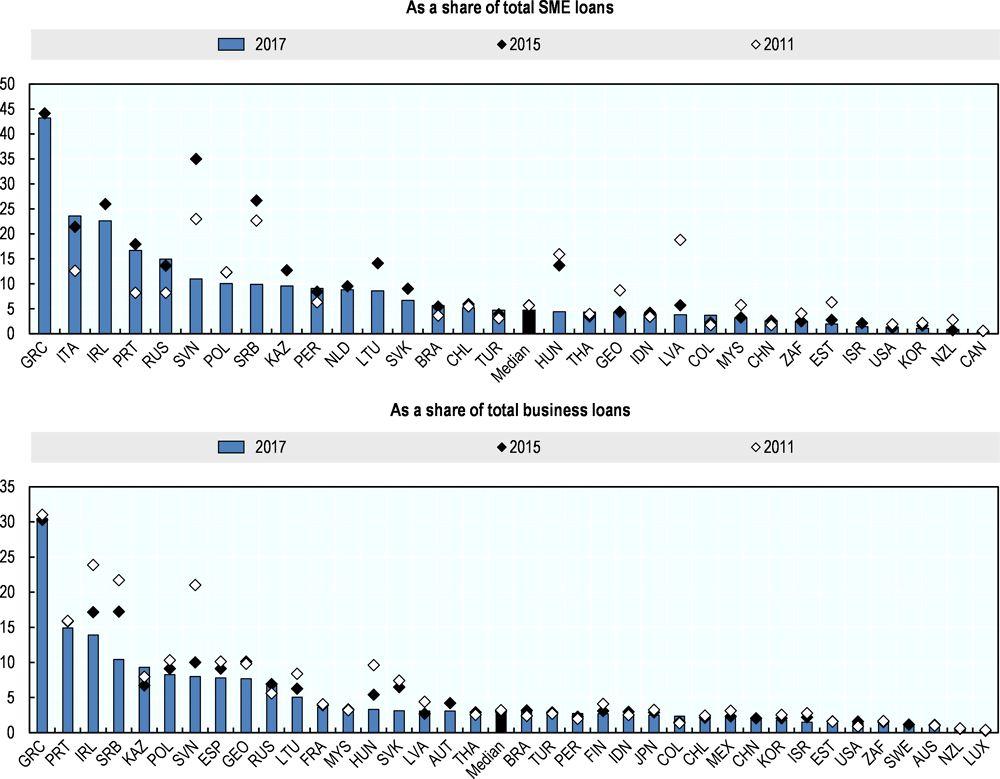
Note: For SME NPLs as a share of total SME loans, Greece and China and for all business NPLs as a share of total business loans, Austria, China and Sweden refer to 2016 data instead of 2017. Definitions differ across countries. Detailed information on sources and definitions is available in the full country profiles.
Source: Data compiled from the individual country profiles of Financing SMEs and Entrepreneurs 2019.
Government policy responses in 2017-18
SME finance remains high on the policy agenda in most areas of the world, and many governments developed new initiatives in 2017 and the first half of 2018, or amended existing ones, to ease access to various sources of finance. Table 1.6 summarises the government policies in place in 2017 for participating countries. This is not a complete overview of policy initiatives, but rather an overview of broad categories. More information about the policy landscape can be found in the individual country profiles.
Based on information from participating countries, a number of broad emerging trends can be discerned and are presented along with recent policy examples in the following sections. The profile of each participating country provides more detailed information on policy initiatives in this area.
Credit guarantee schemes are either in strong expansion or being reformed to better fit the needs of beneficiaries
Credit guarantee schemes have traditionally been the most widespread policy tool to enhance SMEs access to finance, and for the fifth year in a row, credit guarantee volumes were up in a majority of Scoreboard countries. In total, guarantee volumes increased in 16 out of 26 countries, with some countries like China and Turkey experiencing a strong expansion of these schemes in recent years. In the latter, volumes were 40 times more important in 2017 than in 2016. In other countries with more developed schemes, recent updates, for instance with regard to eligibility criteria or the provision of complementary advisory services, are relatively common.
Figure 1.20 represents the relative importance of guarantees in different countries (i.e. outstanding volumes calculated as a percentage of GDP). The figure shows large cross-country differences, with Turkey (7.6%), Japan (4%) and Korea (3.8%) having the most expansive schemes in place. In a majority of countries for which data are available, credit guarantees represent less than one percent of GDP, however.
Note: Data for Canada and Peru refers to 2016 and for Israel to 2015 instead of 2017.
Source: Data compiled from the individual country profiles of Financing SMEs and Entrepreneurs 2019.
China has put financial inclusion as one of its priorities in its current five-year plan (2016-20). In this respect, the government initiated in March 2018 a national financing guarantee fund, which focuses on assisting small and micro businesses, as well as rural entrepreneurial companies by offering re-guarantees for their credit loans or direct private equity investments. It is estimated that the fund will provide guarantees on bank loans totalling CNY 500 billion over the next three years, which is about one quarter of the total volume of the national credit guarantee market.
The Turkish Government decided to extend the treasury-backed credit guarantee scheme substantially as of March 2017 (OECD, 2018[37]). Maximum guarantee volumes for all types of enterprises were raised and the guarantee commission fee substantially lowered. Following the extension of the scheme, the number of SMEs requesting a guarantee soared, from 30 000 in 2016 to more than 320 000 in 2017, with the total approved loan amount rising from less than TL 10 billion to around TL 265 billion.
In March 2017, Ireland established a new Credit Guarantee Scheme, under which the Strategic Banking Corporation of Ireland will roll out new financial products for the benefit of Irish SMEs. The new Credit Guarantee Scheme provides an increase in the level of risk the government will take, amounting to up to 80% of individual loans. An extension of the scope to cover other financial product providers (beyond the three main banks), like lessors and invoice discounters, was also put in place. The reform also extended the definition of loan agreements to include non-credit products and overdrafts. During the first six months of 2018, 57 SMEs made use of the new Credit Guarantee Scheme, accounting for a total of EUR 8.9 million in funding.
Other governments implemented reforms without expanding the scope of their credit guarantee activities. The Japanese Government reformed their guarantee programme to encourage lending based on business evaluation. Specifically, the government decreased the guaranteed portion of safety net from 100% to 80% (maintaining the 100% coverage in the case of a major crisis). In the meantime, the Credit Guarantee scheme was enhanced to target start-ups as a means of promoting private sector innovation.
Similarly, the Korean Government outlined an action plan to restructure fiscal expenditures at a ministerial meeting on economic policy in early 2018, including two measures on government support to SME access to finance. First, a “graduation policy for government financial support” limits total support for life-time working capital by KRW 2.5 billion. The measure was implemented to avoid providing financial support to the same enterprises multiple times regardless of their financial needs over various stages of growth. Second, the ‘provision of financial support for early stage enterprises’ plans to allow over 60% of total government financial support to early stage enterprises.
Despite the importance of credit guarantee activities, they are not always subject to rigorous evaluation. Box 1.2 illustrates that while credit guarantee institutions typically monitor the uptake of their offers, and who benefits, a full-scale impact analysis considering the financial and economic impact is less common.
There is an increased demand from public authorities and private-sector stakeholders to measure the impact of loan guarantee schemes and other government support measures, in order to justify the provision of scarce resources. As a result, the European Association of Guarantee Institutions (AECM) conducted a survey among its members in June 2018 to examine their attitudes and practices with respect to impact evaluations. 30 institutions responded to the survey. The main results can be summarised as follows:
-
60% of members operate evaluations on their own; and 26% rely solely on external operators (mostly universities and research institutions).
-
The periodicity and breadth of evaluations are determined by the demands of the institution management, its stakeholders, and its counter-guarantors, and vary substantially across schemes.
-
A small majority of schemes are not subject to a full-scale impact analysis, but their impact is monitored by gathering data on key indicators, such as the number and amount of issued guarantees, the volume of guaranteed loans, in some cases the volume of supported investments, and increasingly employment levels among their beneficiaries (in about 80% of respondents).
-
47% of respondents stated that they assess the economic and financial additionality of their programme, especially among mature and larger institutions.
-
Evaluations rely on the analysis of the variation of key indicators over time. Parameters studied include the impact on employment, or indicators on economic growth, such as value added, or turnover.
The following reasons were stated as obstacles to conducting such analysis:
-
Direct access to elements of information can be limited for schemes operating through portfolio guarantees, where data provided on each beneficiary is usually more limited.
-
Institutions supporting many beneficiaries can face high costs for data collection and may require expensive IT adaptation.
-
Unfamiliarity with the use of representative samples offering a valid statistical approach.
-
A reliance on survey data among beneficiaries to assess the impact directly.
Finally, there is an increasing interest in collecting information on key characteristics of the supported firms, such as gender of their managers and owners, the “innovativeness” of the supported projects, or on the wider impact of these guarantees, such as the potential reduction of other guarantees and collateral requested by banks to borrowers, the contribution to sustainable development, the impact on collected taxes and on social security programmes.
Source: Written exchanges with AECM experts.
Governments increasingly implement policies to tackle payment delays
Evidence shows that late or non-payments are detrimental to the growth and even survival of enterprises, especially of small businesses, that often lack cash-flow management capabilities and have only limited possibilities to find sufficient funds elsewhere. A 2016 study by the UK's Federation of Small Businesses (FSB) found that 30% of payments to small businesses were typically made late, with 37% of firms running into cash-flow difficulties, 30% having to resort to overdraft facilities, and 20% citing a slowdown in profit growth as a consequence. These findings are corroborated by the 2018 European Payment Report, which indicates that 28% of surveyed businesses experience late or missing payments as hindering growth, and 21% say that they are unable to hire new staff because their clients fail to pay them on time (Intrum, 2018[38]). The Federation of Small Businesses estimates that reducing or ending late payments could reduce the total number of business failures by up to 50 000 per year. (Federation of Small Businesses (FSB), 2016[39]). The European Commission has continued to urge EU member states to apply the EU Late Payment Directive in their own legislation, whose implementation deadline was March 2013.
In December 2016, the French Government enacted a law to strengthen the legislative framework to fight against business-to-business payment delays. This includes a rise in the maximum fine to EUR 2 million for firms that to not respect the maximum allowed delay of 60 days, and a policy of “naming and shaming” of firms with bad payment practices.
Chile introduced the Bill of Timely Payment in June 2018 to encourage the timely payments of invoices. The Bill seeks to limit payment terms to 30 days and agreed-upon terms to 60 days. For public procurements, payments to suppliers must be made within 30 calendar days following receipt of an invoice or the respective tax instrument issued, and terms of up to 60 calendar days may be established for a respective auction or public procurement instrument. Additionally, the issuance of an Electronic Dispatch Guide will be mandatory for supplying companies; creditor companies may earn interest on late payments; and, finally, amendments to invoices by the purchasing company will be prohibited after 8 days from the issuance of the invoice.
Australian business surveys consistently show that cash flow and late payments are prime concerns of its SMEs. During the first three semesters of 2016, 8% of payments from government agencies to SMEs were done in more than 30 days without any valid reason (Western Australian Auditor General, 2017[40]). As a result, the government will be required to pay invoices for contracts worth up to AUD 1 million within 20 calendar days, compared to the current policy and industry norms of 30 days. Furthermore, to increase transparency and accountability in meeting the new policy, the government is requiring substantially more agencies to report on payment performance.
New-Zealand puts digitalisation at the centre of its efforts to tackle payment delays. The New Zealand Business Number (NZBN) initiative (first introduced in 2013 for registered companies) now makes a globally unique identifier available to all New Zealand businesses, including unincorporated entities. Having a single identifier will make it faster to interact with other businesses, as companies will not have to update their information multiple times and all their primary business data will be kept online. e-Invoicing11 is another government-led, NZBN-related initiative (not yet implemented but currently underway) that aims to improve payment efficiency for business. All invoices will be instantly sent to business through their finance systems, and manual errors will be minimised. Both initiatives are expected to reduce payment delays and the costs to businesses of dealing with government administration.
Regulatory approaches and targeted policies are in place to support Fintech developments
Some countries have made their legislative framework more conducive for innovation in the financial sphere. For example, the Australian Government announced in May 2017 an enhanced regulatory sandbox,12 which will allow more businesses to test a wider range of new financial products over a longer period, further facilitating innovative new finance. A move towards an Open Banking regime in 2018 was also announced. The enhanced regulatory sandbox aims to facilitate growth of new, viable alternatives to traditional lending models, while Open Banking will allow for better access to data and the ease of consumer switching. Both measures aim to facilitate the growth of new, viable alternatives to traditional lending models by making it easier for Fintech companies to be set up, and for consumers to switch to them.
Similarly, the US Treasury released in July 2018 a report on Non-bank Financials, Fintech and innovation, calling for the implementation of a regulatory sandbox at the federal level, in a move to foster innovation and market access in this field (Mnuchin and Phillips, 2018[41]). So far, only Arizona has put into place such a sandbox to support Fintech innovation.
The Federal Council of Switzerland adopted an amendment to the Banking Ordinance (BankO), which became effective in August 2017. The amendment aimed to regulate Fintech firms based on their risk potential. The first provision of this amendment is to extend the application of settlement funds to 60 days, up from the current 7 days. This aims at facilitating crowdfunding activities in particular. Furthermore, the acceptance of public funds of up to CHF 1 million will no longer be classified as operating on a commercial basis, and will thus be exempt from authorisation. This change should allow Fintech firms to try out a business model before they are required to obtain authorisation, when accepting public funds exceeding CHF 1 million.
The Mexican government granted in 2015 MNX 10 million to the project “Crowdfunding Ecosystem Acceleration in Mexico to Promote Entrepreneurship, Innovation and Economic Inclusion”, which aims to support entrepreneurship development, including through innovative financial digital mechanisms.
New public venture capital funds are being established and others expanded
Capital market finance continued to attract particular interest from policy makers in 2017. In the European Union, public funds have mainly invested in an ‘indirect’ manner, in order to detach governments from the investment decisions, by putting private fund managers at the head of public funds. Moreover, the French, British and Swedish governments created funds that specifically target the early stage phase to counter the trend of VC investments targeting more mature firms. The European Investment Fund launched in 2016, with other National Promotional Institutions, the EIF-NPI platform as a way to share policy and investment practices throughout Europe (Ständer, 2017[42]).
Similarly, the Mexican Government decided to focus its support on its co-investment programme in 2017. Resources are targeted at Mexican start-ups with high-impact projects that, aside from the funding, also receive mentoring and counselling in order to scale their projects in a more successful way.
The Korean Government announced a plan to raise a new fund of funds to provide financial support to start-ups, ventures, and SMEs. The “Innovation Venture Capital Fund” plans to raise USD 9 billion over the next 3 years, with a third of the funding provided by the government, and the rest by private players. The funding will be sourced from new fiscal investments, a KRW 1.8 trillion investment from the Korea Development Bank, and exit money from previous government funds. In doing so, Seoul is increasing the already highest government backing per capita for start-ups in the world.
In December 2017, the Canadian Government also made CAD 400 million available through the Business Development Bank of Canada (BDC) for the new Venture Capital Catalyst Initiative (VCCI), thus increasing late-stage venture capital available to Canadian entrepreneurs. Through the VCCI, the government is seeking to build a portfolio through two streams: large funds-of-funds (CAD 350 million) and alternative models (CAD 50 million) that strengthen and broaden the Canadian VC ecosystem and increase the availability of late-stage venture capital over time. The government will also establish a private sector committee that will make recommendations on which candidates to select for VCCI, in a move to detach the public sector from the decision making.
The OECD also recently conducted a comprehensive policy survey among governments to identify effective approaches to the implementation of the G20/OECD High-Level Principles on SME Financing. The most salient results of this exercise are described in Box 1.3.
The G20/OECD High-Level Principles on SME Financing were welcomed by G20 Leaders at their Summit in Antalya in November 2015. The Principles call for strengthening SME access to traditional bank financing and improving their access to a broad range of financing instruments, to enable them to obtain the form and volume of financing best suited to the specific needs and stage of the firm life-cycle.
The report on G20/OECD Effective Approaches for Implementing the G20/OECD High-Level Principles on SME Financing, delivered to G20 Finance Ministers and Central Bank Governors in 2018, aims at facilitating the implementation of the Principles. The report identifies effective approaches adopted by countries to implement the Principles, drawing on participating countries’ replies to dedicated surveys. In total, 41 countries participated in the process, including 16 G20 countries
Findings from the report include the following:
-
Governments recognise the importance of building the evidence base for policy making in the area of SME finance and take steps to identify the financing needs and challenges of their SME population;
-
Guarantees remain the most widely used tool to strengthen SME access to traditional bank financing;
-
In order to enable SMEs to access diverse non-traditional financing instruments, various platforms (generally online) and awareness seminars are in place to increase the knowledge of SME owners and managers of all available financing options, as well as their chances to successfully apply for funding with diverse finance providers;
-
Young entrepreneurs, SMEs located in remote areas and women entrepreneurs appear to be the most widespread priority segments of SME finance programmes;
-
Most countries have taken steps to support the development of Fintech solutions as a way of increasing the financial inclusion of SMEs. Fintech appears to be viewed as an opportunity to improve SME access to finance by policy makers and supervisors, who tend to accompany the development of Fintech solutions while mitigating related risks, as regards investor protection and data privacy in particular;
-
Digitalisation appears to be an effective way to improve improve transparency in SME finance markets as contained in business or credit registries. However, there remain important differences in the level of consultation fees across countries;
-
Nearly all responding countries have a public financial institution which contributes to national objectives regarding SME access to finance. It generally operates alongside or through private sector players. Banks largely remain the most important partner of public authorities, with other financial institutions (non-bank financial institutions like leasing or factoring companies, or equity funds), playing a less prominent role;
-
In order to tackle the cash flow issues SMEs may face as a result of payment delays, governments have taken numerous initiatives to reduce delays in public bodies’ payments to SMEs, from prompt payment codes to tracking systems which can provide detailed information on payment delays to public bodies;
-
Although ensuring the financial and economic additionality of public programmes is a guiding principle in almost all countries, few countries conduct rigorous evaluations of SME finance policies in a systematic manner.
Annex B provides more detailed information on the effective approaches for implementing the Principles.
Recommendations for data improvements
Data gaps on SME finance remain prominent, and further efforts to improve the collection of data and evidence on SME finance should be pursued. First, the SME population is very heterogeneous, and financing conditions and challenges differ substantially along parameters such as the age of the firm, its size, location, sector, growth potential as well as the characteristics of the principal business owner, such as their gender or business experience. Data from Canada’s Survey on Financing and Growth of SMEs show pronounced differences in SME financing needs and outcomes based on different business characteristics, with the main sector of operation playing an important role. Indeed, owner characteristics appear to be less important when controlling for business characteristics.
Despite the widespread recognition of the need to tailor policies to the different needs of the enterprise population, data collection efforts do not always capture granular information along these parameters. This limits policy makers’ ability to assess the impact and effectiveness of initiatives on these different segments. In addition, the absence of more granular data limits the analysis of the scoreboard data. Trends observed may mask very different developments among different segments of SMEs. To address this challenge the British Business Bank in the United Kingdom has developed a novel typology of its SME population based on attitudes and needs, as a tool to help target its activities (see Box 1.4).
The British Business Bank has undertaken a cluster-based segmentation analysis of the overall SME population, based on a UK demand-side survey13. The aim of this exercise is to better inform and target future policies. Rather than speaking about the nature of “average” SMEs, the segmentation groups SMEs with similar tendencies together, especially separating those with high ambition and growth mindsets from the others.
The analysis groups SMEs with similar characteristics, considering SME need for, and use of finance, as well as their openness to external information about finance and how to secure it. Based on this analysis, SMEs can be broadly categorised according to the following segments:
-
Contented: These SMEs are undemanding and unworried and the least likely to be innovative and active internationally. These SMEs have low growth ambitions, are relatively financially confident, but generally not well informed;
-
Fighters: SMEs trying to overcome obstacles and grow. They tend to be somewhat ambitious, international and innovative, likely to report obstacles to the operation of their businesses, including those relating to cashflow, skills, politics, the economy, and access to finance;
-
Savvy Entrepreneurs: These SMEs are innovative, international, and formal. They are the most confident in their own abilities to access different sources of finance finance and are likely to have a finance qualification;
-
Quicksilvers: These are SMEs that can be categorised as successful and growing, but somewhat vulnerable, due to their ambitious growth plans. They are often active in markets beyond the United Kingdom, somewhat confident in their abilities to access finance options, and relatively likely to employ someone with a formal finance qualification. Nevertheless, they may face financial constraints, for example following a decline in a credit application.
-
Permanent non-borrowers: This group can be defined as those who (1) do not currently use external finance, (2) are not considering applying for external finance in the next three months, (3) have not applied or wanted to apply for finance in the past year, and (4) have not used finance in the past five years.
Source: British Business Bank.
The British Business Bank uses this framework as an overall guidance for their activities.
Source: Written exchanges with experts from the British Business Bank
Quantitative surveys, either directed to a representative group of SMEs or to senior loan officials, can provide valuable additional insights alongside more qualitative information. These surveys are not undertaken in all countries, however. In addition, there differences in terms of methodology, questions asked, coverage and scale of existing surveys are significant, hindering international comparisons. Analysis of scoreboard data on credit rejections, credit applications and collateral requirements, for instance, is hampered by limitations in the number of countries with data on these indicators, as well as by limited cross-country comparability. Greater international harmonisation of demand-side survey methods in particular would enable more meaningful analysis of the drivers of trends in SMEs’ access to finance and financial conditions. The OECD is supporting new efforts in this area.
In addition, the evidence base on most sources of finance other than straight bank debt continues to be weak. Often, data are not SME-specific, incomplete, hard to compare from one country to the other, and questions sometimes arise about the reliability and methodology of data collection efforts. Initiatives to promote the use of alternative sources of financing by SMEs have proliferated in recent years, but their impact often remains hard to gauge because of the lack of data. More systematic and harmonised efforts to collect data on alternative financing instruments and sources would be instrumental to understand the trends and potential of these instruments for SMEs
A summary of additional recommendations to further improve data collection and reporting of core indicators are outlined in Box 1.5 (see Annex A for a more detailed discussion. Implementation of these recommendations can help countries to progress in the harmonisation of definitions and facilitate inter-temporal and cross-country analysis of trends in SME and entrepreneurship finance.
1. Improve reporting of SME loan variables by:
-
Systematically separating reporting of financial information for non-employer and employer-firms;
-
Providing both stock and flow data for SME loans;
-
Detailing the loans' composition, with indication of the different underlying products (e.g. overdrafts / lines of credit / leases / business mortgages or credit cards / securitised loans), and disclose such elements in the loan definition.
2. Fill gaps in available data and work towards more comprehensive information for other core indicators in the Scoreboard, including
-
Offer more comprehensive information on government programmes that ease SMEs’ access to finance.
-
Provide data on non-performing loans for SMEs and for large firms, the latter to be used as a benchmark.
-
Provide more comprehensive data on alternative sources of financing, including crowdfunding and business angel investments
-
Collect information on SME loan fees, in addition to interest applied on the loans.
-
Compile more complete information on the uptake and use of non-bank financing instruments, asset-based finance in particular.
-
Detail the definition of collateral and improve reporting, using demand-side surveys to compensate for lack of supply-side data.
References
[51] BAF, B. (2017), Understanding the Nature and Impact of the business angels in Funding Research and Innovation, Business Angels Funding - A Study funded by the European Commission, http://europa.eu (accessed on 14 August 2018).
[44] Bank of England (2018), Credit Conditions Survey 2018 Q1, http://www.bankofengland.co.uk/credit-conditions- (accessed on 25 July 2018).
[13] Bank of Japan (2018), Tankan Survey - June 2018, http://www.boj.or.jp/en/statistics/tk/gaiyo/2016/tka1806.pdf (accessed on 25 July 2018).
[64] Bernanke, B. et al. (2011), International Capital Flows and the Returns to Safe Assets in the United States, 2003-2007, https://www.federalreserve.gov/pubs/ifdp/2011/1014/ifdp1014.pdf (accessed on 22 October 2018).
[23] BPIFrance et al. (2016), Building momentum in Venture Capital across Europe, https://www.kfw.de/PDF/Download-Center/Konzernthemen/Research/PDF-Dokumente-Studien-und-Materialien/Building-Momentum-in-Venture-Capital-across-Europe.pdf.
[65] Bridges, J. et al. (2014), “The impact of capital requirements on bank lending”, Bank of England, http://www.bankofengland.co.uk/research/Pages/workingpapers/default.aspx (accessed on 23 October 2018).
[56] Brogi, M. and V. Lagasio (2017), “SME Sources of Funding: More Capital or More Debt to Sustain Growth? An Empirical Analysis”, in Access to Bank Credit and SME Financing, Springer International Publishing, Cham, https://doi.org/10.1007/978-3-319-41363-1_7.
[35] Center For Venture Research (2018), Center for Venture Research THE ANGEL MARKET IN 2017 ANGELS REMAIN BULLISH FOR SEED AND START-UP INVESTING, http://paulcollege.unh.edu/center-venture-research (accessed on 14 August 2018).
[16] Degl’Innocenti, M., F. Fiordelisi and I. Trinugroho (2018), Competition and Stability in the credit industry: banking vs. factoring industries, https://doi.org/10.2139/ssrn.3163443.
[7] Demary, M., J. Hornik and G. Watfe (2016), “SME Financing in the EU: Moving beyond one-size-fits-all”, Bruges European Economic Policy Briefings, No. 40/2016, http://aei.pitt.edu/85823/ (accessed on 13 August 2018).
[11] Dunkelberg, W. and H. Wade (2018), Small Business Economic Trends - June 2018, NFIB Research Center, https://www.nfib.com/assets/SBET-June-2018.pdf (accessed on 25 July 2018).
[34] EBAN, T. (2018), EBAN Statistics Compendium, http://www.eban.org/wp-content/uploads/2018/07/EBAN-Statistics-Compendium-2017.pdf (accessed on 14 August 2018).
[49] Ebben, J. (2009), Bootstrapping and the financial condition of small firms, https://doi.org/10.1108/13552550910967930.
[50] Ebben, J. (2009), Bootstrapping and the financial condition of small firms, https://doi.org/10.1108/13552550910967930.
[10] European Central Bank (2018), Survey on the Access to Finance of Enterprises in the euro area – April to September 2018, https://www.ecb.europa.eu/stats/accesstofinancesofenterprises/html/ecb.safe201811.en.html#toc3 (accessed on 25 July 2018).
[52] European Central Bank (2017), Survey on the Access to Finance of Enterprises in the Euro Area: April to September 2017, http://www.ecb.europa.eu/stats/accesstofinancesofenterprises/pdf/ecb.accesstofinancesmallmediumsizedenterprises201711.en.pdf.
[46] European Central Bank (2016), Survey on the Access to Finance of Enterprises in the Euro Area, http://www.ecb.europa.eu/stats/accesstofinancesofenterprises/pdf/accesstofinancesmallmediumsizedenterprises201611.en.pdf.
[55] European Commission (2015), Ex-post evaluation of Late Payment Directive, https://publications.europa.eu/en/publication-detail/-/publication/400ecc74-9a54-11e5-b3b7-01aa75ed71a1 (accessed on 21 August 2018).
[4] European Investment Bank (2017), EIB Investment Report 2017/2018: From recovery to sustainable growth, http://www.eib.org/attachments/efs/economic_investment_report_2017_en.pdf (accessed on 22 October 2018).
[39] Federation of Small Businesses (FSB) (2016), Time to Act: The economic impact of poor payment practice, https://www.fsb.org.uk/docs/default-source/fsb-org-uk/fsb-report---late-payments-2016-(final).pdf?sfvrsn=0 (accessed on 14 August 2018).
[5] Fraisse, H., M. Lé and D. Thesmar (2017), “The real effects of bank capital requirements”, European System of Financial Supervision, https://doi.org/10.2849/720260.
[6] Gray, A. (2017), “US banks scale up long-term lending”, Financial Times, https://www.ft.com/content/a966f8ec-cefc-11e7-b781-794ce08b24dc (accessed on 13 August 2018).
[21] HM Treasury (2017), Financing growth in innovative firms: Consultation response, https://assets.publishing.service.gov.uk/government/uploads/system/uploads/attachment_data/file/661398/Patient_Capital_Review_Consultation_response_web.pdf.
[22] Howell, S. (2017), Financing Innovation: Evidence from R&D Grants, https://doi.org/10.1257/aer.20150808.
[43] International Monetary Fund (2018), World Economic Outlook, April 2018, https://www.imf.org/en/Publications/WEO/Issues/2018/03/20/world-economic-outlook-april-2018 (accessed on 25 July 2018).
[3] International Monetary Fund (2018), World Economic Outlook, October 2018: Challenges to Steady Growth, IMF, Washington, D.C., https://www.imf.org/~/media/Files/Publications/WEO/2018/October/English/main-report/Text.ashx?la=en (accessed on 5 December 2018).
[54] Intrum (2018), European Payment Report, https://www.intrum.com/media/2772/epr-2018.pdf (accessed on 21 August 2018).
[38] Intrum (2018), European Payment Report 2018, https://www.intrum.com/media/2772/epr-2018.pdf (accessed on 14 August 2018).
[59] Ketterer, J. (2017), Digital Finance New Times, New Challenges, New Opportunities, Inter-American Development Bank, http://www.iadb.org (accessed on 22 August 2018).
[24] Kraemer-Eis, H., S. Signore and D. Prencipe (2016), The European venture capital landscape: An EIF perspective. Volume 1: The impact of EIF on the VC ecosystem, https://ideas.repec.org/p/zbw/eifwps/201634.html.
[48] Lam, W. (2010), Funding gap, what funding gap? Financial bootstrapping: supply, demand and creation of entrepreneurial finance, https://doi.org/10.1108/13552551011054480.
[14] LeaseEurope (2018), .
[63] Magyar Nemzeti Bank (2018), Considerations behind the launch of the funding for growth scheme fix (FGS fix) and main features of the programme, http://www.mnb.hu/en/publications/considerations-behind-the-launch-of-the-funding-for-growth-scheme-fix-fgs-fix-and-main-features-of-the-programme.
[47] Marchese, M. and J. Potter (2014), Policy Brief on Access to Business Start-up Finance for Inclusive Entrepreneurship, http://www.oecd.org.
[26] McKinsey (2018), The rise and rise of private markets, https://doi.org/file:///C:/Users/Boschmans_k/Downloads/The-rise-and-rise-of-private-markets-McKinsey-Global-Private-Markets-Review-2018.pdf.
[41] Mnuchin, S. and C. Phillips (2018), A Financial System That Creates Economic Opportunities Nonbank Financials, Fintech, and Innovation Report to President Donald J. Trump Executive Order 13772 on Core Principles for Regulating the United States Financial System Counselor to the Secretary, https://home.treasury.gov/sites/default/files/2018-07/A-Financial-System-that-Creates-Economic-Opportunities---Nonbank-Financi....pdf (accessed on 22 August 2018).
[61] Mol-Gómez-Vázquez, A., G. Hernández-Cánovas and J. Koeter-Kant (2018), Legal and Institutional Determinants of Factoring inSMEs: Empirical Analysis across 25 European Countries, https://doi.org/10.1111/jsbm.12260.
[20] Moritz, A., J. Block and A. Heinz (2017), Financing Patterns of European SMEs: An Updated Empirical Taxonomy and Determinants of SME Financing Clusters, http://www.eif.org/news_centre/publications/eif_wp_40.pdf.
[19] Moritz, A., J. Block and A. Heinz (2016), Financing patterns of European SMEs - an empirical taxonomy, https://doi.org/10.1080/13691066.2016.1145900.
[31] Nassr, I. and G. Wehinger (2015), Opportunities and limitations of public equity markets for SMEs, https://www.oecd.org/finance/Unlocking-SME-finance-through-market-based-debt.pdf.
[45] OECD (2018), Financing SMEs and Entrepreneurs 2018: An OECD Scoreboard, OECD Publishing, Paris, https://doi.org/10.1787/fin_sme_ent-2018-en.
[62] OECD (2018), Interim Economic Outlook, 20 September 2018, http://www.oecd.org/eco/outlook/economic-outlook/.
[1] OECD (2018), OECD Economic Outlook November 2018, OECD, https://doi.org/10.1787/888933880014.
[2] OECD (2018), OECD Economic Outlook, Volume 2018 Issue 1, OECD Publishing, Paris, https://doi.org/10.1787/eco_outlook-v2018-1-en.
[37] OECD (2018), OECD Economic Surveys: Turkey 2018, OECD Publishing, Paris, https://doi.org/10.1787/eco_surveys-tur-2018-en.
[33] OECD (2016), “The role of business angel investments in SME finance”, in Financing SMEs and Entrepreneurs 2016: An OECD Scoreboard, OECD Publishing, Paris, https://doi.org/10.1787/fin_sme_ent-2016-6-en.
[53] OECD (2015), OECD Economic Surveys: Japan 2015, OECD Publishing, Paris, https://doi.org/10.1787/eco_surveys-jpn-2015-en.
[58] OECD (2011), Financing High-Growth Firms: The Role of Angel Investors, OECD Publishing, Paris, https://doi.org/10.1787/9789264118782-en.
[9] OECD (forthcoming), Financing SMEs and Entrepreneurs 2019: An OECD Scoreboard.
[57] Oecd (2018), OECD Economic Surveys: Italy 2017, https://www.oecd-ilibrary.org/docserver/eco_surveys-ita-2017-en.pdf?expires=1534944938&id=id&accname=ocid84004878&checksum=EBE57C865AA9FDCCC79897E03324776B (accessed on 22 August 2018).
[8] Park, H., C. Ruiz and T. Tressel (2015), Determinants of Long-Term versus Short-Term Bank Credit in EU Countries, http://documents.worldbank.org/curated/en/942521468184773633/pdf/WPS7436.pdf.
[18] Paroma, S. and C. Mann (2010), The Financial Structure of Startup Firms: The Role of Assets, Information, and Entrepreneur Characteristics.
[60] Pessarossi, P. and F. Vinas (2015), The supply of long-term credit after a funding shock: evidence from 2007-2009, https://halshs.archives-ouvertes.fr/halshs-01224523/document.
[25] Pradhan, R. et al. (2017), Venture capital investment, financial development, and economic growth: the case of European single market countries, https://doi.org/10.1080/13691066.2017.1332802.
[27] Preqin (2018), 2018 Prequin Global Private Debt Report, http://docs.preqin.com/samples/2018-Preqin-Global-Private-Debt-Report-Sample-Pages.pdf.
[66] Slovik, P. and B. Cournède (2011), “Macroeconomic Impact of Basel III”, OECD Economics Department Working Papers, No. 844, OECD Publishing, Paris, https://doi.org/10.1787/5kghwnhkkjs8-en.
[42] Ständer, P. (2017), PUBLIC POLICIES TO PROMOTE VENTURE CAPITAL: HOW TO GET NATIONAL AND EU MEASURES IN SYNC, Jacques Delors Institut, https://www.delorsinstitut.de/2015/wp-content/uploads/2017/08/20170831_Venture-Capital-Policies_St%C3%A4nder.pdf (accessed on 22 August 2018).
[36] The American Angel (2017), The first in-depth report on the demographics and investing activity of individual American angel investors, http://www.theamericanangel.org (accessed on 14 August 2018).
[15] United Capital Funding (2018), World Factoring Industry $3 Trillion Business, https://www.ucfunding.com/world-factoring-industry-3-trillion-business/.
[12] United States Federal Reserve Board (2018), Senior Loan Officer Opinion Survey on Bank Lending Practices - October 2018, https://www.federalreserve.gov/data/sloos/sloos-201810.htm#aboutMenu (accessed on 25 July 2018).
[40] Western Australian Auditor General (2017), Timely Payment of Suppliers, http://www.audit.wa.gov.au (accessed on 21 August 2018).
[29] WFE (2018), An overview of WFE SME markets, https://www.world-exchanges.org/news/articles/world-federation-exchanges-publishes-report-global-sme-markets.
[32] World Federation of Exchanges (2017), SME Financing and Equity Markets, https://www.world-exchanges.org/home/index.php/files/18/Studies---Reports/398/WFE-Report-on-Equity-Market-Financing-of-SMEs.pdf.
[30] World Federation of Exchanges (2017), WFE Report on SME Exchanges, https://www.world-exchanges.org/home/index.php/news/world-exchange-news/world-federation-of-exchanges-publishes-report-into-sme-financing-equity-marketsp%2Ffiles%2F18%2FStudies---Reports%2F310%2FWFE-Report-on-SME-Exchan.
[28] World Federation of Exchanges & Milken Institute (2017), Small and Medium-sized Enterprises and SME exchanges, https://www.world-exchanges.org/home/index.php/news/world-exchange-news/world-federation-of-exchanges-publishes-joint-report-with-milken-institute-on-sme-exchanges.
[17] World Trade Organization (2016), Trade finance and SMEs: Bridging the gaps in provision, https://www.wto.org/english/res_e/booksp_e/tradefinsme_e.pdf.
Notes
← 1. The difference in yields between corporate and sovereign bonds
← 2. A panel data fixed effects regression analysis was conducted to better understand credit developments. Independent variables were year on year changes in the outstanding stock of SME loans, as well as the year on year change in new lending to SMEs. Dependent variables are the scoreboard indicators, usually expressed as year on year changes as well as annualised growth in GDP and annualised growth in corporate gross fixed capital formation (CGFCF), as a proxy for corporate investments. Stata was used as the software to conduct this analysis.
← 3. Cluster analysis allows to group countries together that share similar characteristics. Stata, a statistical software package, was used to conduct a k-median cluster analysis of the data. As an additional robustness check, similar analysis with mean values rather than median values (k-means cluster analysis) was conducted and yielded broadly similar results.. The panel structure of the data (i.e. its three-dimensional nature with observations for different countries, different years and different indicators) poses challenges to the algorithm, as well as the missing data. Several indicators where data coverage is incomplete were removed for that reason, and Austria, Norway and Thailand because of poor data coverage. Imputation of median values is used for the remaining data gaps. To address the panel structure of the data, analysis is first conducted using 2017 data only, the unweighted average of 2016 and 2017 data and then by using an unweighted average of 2015, 2016 and 2017 data. This also allows checking the robustness of the analysis to some extent. Results were broadly similar irrespective of what years were included.
← 4. The distinction between high-income and mid-income countries is drawn by the World Bank, which assigns the world's economies into different income groups. This assignment is based on GNI per capita calculated using the Atlas method. More information on this classification can be found here: https://blogs.worldbank.org/opendata/new-country-classifications-income-level-2018-2019.
← 5. The ECB Survey on SME access to finance is undertaken every six months to assess the latest developments in the financing conditions for firms in the Euro area. Among the most important questions are: was there a deterioration in the availability of bank loans, in the willingness of the banks to lend; what was the outcome of the loan application (granted in full or rejected) and did interest rates and collateral requirements increase or decrease. A joint ECB/EC survey round is conducted every two years for all the EU member states and some additional countries
← 6. Small businesses are businesses with annual sales of less than USD 50 million.
← 7. Senior loan officers are asked how the demand of small business loans changed over the last three months. Possible answers range from a “substantially stronger” demand to a “substantially weaker” demand. Subtracting the percentage of respondents who answered that demand was (substantially or moderately) weaker from the percentage who thought demand was (substantially or moderately) stronger, provides an indicator of overall demand for loans of small businesses.
← 8. In order to provide an accurate picture of business trends, a representative and large-scale sample of the Japanese business population is asked to choose between different alternatives to best describe prevailing business conditions. One question pertains to the “lending attitude of financial institutions”, where the respondents can choose between “accommodative,” “not so severe” and “severe” as best describing their view of lending attitudes. A single indicator is derived on the basis of these answers.
← 9. In the United Kingdom, the Bank of England surveys lenders about changes in trends. The survey covers secured and unsecured lending to households and small businesses; lending to non-financial corporations, as well as to non-bank financial firms.
← 10. This includes reward-based crowdfunding, whereby backers provide funding to individuals, projects or companies in exchange for non-monetary rewards or products, and donation-based crowdfunding, whereby Donors provide funding to individuals, projects or companies based on philanthropic or civic motivations with no expectation of monetary or material return.
← 11. E-Invoicing is the ability to directly send and receive standardised electronic invoice documents between two different businesses’ finance and accounting systems.
← 12. A regulatory sandbox is a framework set up by a financial sector regulator to allow live testing of financial sector innovations in a controlled environment under a set of predefined parameters and under the regulator’s supervision.
← 13. British Business Bank, 2018. Small Business Finance Markets. Available from: https://www.british-business-bank.co.uk/wp-content/uploads/2018/02/Small-Business-Finance-Markets-2018-Report-web.pdf