copy the linklink copied!Chapter 3. Results of the early literacy and numeracy assessments in the United States
This chapter presents findings on the emergent literacy and emergent numeracy of five-year-olds in the United States. It describes how children’s scores in each of these early learning domains relate to their individual characteristics, family backgrounds, home learning environments and early childhood education and care participation.
copy the linklink copied!The importance of early cognitive development
The cognitive skills developed in early childhood are important for children’s well-being in the present and foundational to their future success in life. Decades of longitudinal research have shown that early literacy and numeracy scores are strongly predictive of later cognitive and educational outcomes (Duncan et al., 2007[1]). Early literacy and numeracy skills are also associated with a range of social, emotional and economic outcomes throughout people’s lives (Reynolds et al., 2002[2]). By the time children start school, gaps in their cognitive skills – determined by their individual characteristics, home environments, and early childhood education and care (ECEC) experiences – are already observable and, once they exist, become increasingly difficult and costly to close. There is ample research evidence to suggest that when societies intervene early, children’s cognitive skills are amenable to improvement (Reynolds et al., 2002[2]; Schweinhart, 2013[3]).
Gaps in literacy skills require early attention
The consequences of not addressing cognitive skills gaps early are serious. Adequate literacy skills are integral to successful functioning in most societies worldwide, yet 23% of 15-year-old students across OECD countries fail to reach a baseline level of proficiency1 in reading, including 18% of 15-year-olds in the United States (OECD, 2019[4]). Similarly, one in five (20%) adults on average across OECD countries have low reading performance,2 including 17% in the United States (OECD, 2013[5]). These adults have poorer labour-market outcomes and poorer self-reported health than their peers with better literacy skills. They are also more likely to feel that they have little impact on the political process and are less likely to report that they have trust in others (OECD, 2013[5]).
The roots of low adult literacy are found in childhood. As skills beget skills, children who fall behind early in their literacy and language skill development are likely to fall further behind over time (Kautz et al., 2014[6]; Rigney, 2010[7]). Measuring the early literacy skills of children can provide important information on where societies should focus attention and resources in order to promote quality and equity in early literacy development and, in turn, in children’s life outcomes. Assessing emergent literacy skills comprises an integral part of the International Early Learning and Child Well-being Study (IELS).
Early numeracy is also strongly predictive of a range of later outcomes
Although emergent numeracy has been subject to less research attention than emergent literacy, longitudinal research has also identified numeracy skills in early childhood as important for positive outcomes throughout schooling and into adulthood. Studies have shown that competence in mathematics as assessed at school entry is the strongest predictor of later mathematical achievement and strongly predicts achievement in other academic domains (Duncan et al., 2007[1]). Better numeracy skills in childhood are associated with higher socio-economic status in adulthood (Ritchie and Bates, 2013[8]) and with better self-reported health outcomes (OECD, 2016[9]). On average, 24% of adults in OECD countries do not develop numeracy skills that go beyond the most basic numerical operations, and in the United States the proportion is 26% (OECD, 2013[10]). In most countries, adults with worse information-processing skills, including numeracy skills, are less likely to be employed and, when employed, tend to earn lower wages (OECD, 2016[9]). The relationship between numeracy skills and wages is especially strong in the United States (OECD, 2013[10]). While the cost of innumeracy to individuals and societies is high now, it is likely to grow higher still in what is an increasingly technological and scientific world (Raghubar and Barnes, 2017[11]). Given its established importance for later outcomes, emergent numeracy was selected as an important learning domain to be assessed in IELS.
A comprehensive assessment of early cognitive development should include a range of skills predictive of later competence
Emergent cognitive skills can be broadly categorised as either constrained or unconstrained. Constrained literacy skills are those that are finite, such as alphabet knowledge, and these are typically easily assessed. Unconstrained skills are not limited in the same way, and include aspects of literacy such as vocabulary knowledge. Unconstrained skills develop over a longer period, and draw on constrained skills in their formation (Snow and Matthews, 2016[12]). A comprehensive assessment of emergent literacy skills should include an assessment of both types of skill, which was the approach taken in IELS. While unconstrained emergent literacy skills are generally more challenging to assess, they tend to be more strongly associated with later reading success and were therefore the primary focus of the IELS emergent literacy assessment. The assessment used innovative, play-based methods and was delivered on tablet devices.
IELS directly assessed three early language skills deemed fundamental to later literacy competence: the unconstrained skills of listening comprehension and vocabulary knowledge, and the constrained skill of phonological awareness. Listening comprehension aids reading comprehension. Vocabulary knowledge is important for later literacy achievement because knowing what words mean helps with both listening and reading comprehension. Phonological awareness relates to later literacy, as sounding out words is a means of decoding text. The assessment of listening comprehension in IELS involved two main components: story-level listening comprehension and sentence-level listening comprehension. The former involved children listening to a story and responding to a series of audio-recorded items relating to that story, while the latter involved listening to a series of standalone sentences and responding to a single item about the meaning of each. Each vocabulary item in IELS required children to identify from a range of very common everyday word options (Tier 1 words) the synonym of a more complex (Tier 2) word.3 Finally, phonological awareness items required children to identify the first, middle and final phonemes (sounds) of short words. IELS did not assess reading ability, but focused instead on the early language skills that are predictive of later reading success.4
The general principle of focusing on the assessment of unconstrained skills in IELS was also applied to the assessment of emergent numeracy. Emergent numeracy was defined in IELS as the ability to recognise numbers and to undertake numerical operations and reasoning in mathematics. The emphasis in the assessment was on simple problem solving and the application of concepts and reasoning in the following content areas: numbers and counting, working with numbers, shape and space, measurement, and patterns. As with emergent literacy, the emergent numeracy assessment was delivered on a tablet and involved children engaging with game-like activities. The emergent numeracy assessment used a mixture of drag-and-drop technology, where children moved items around the screen to construct solutions to problems, and hot-spot technology, where children tapped objects to indicate their preferred option when responding to an item.
This chapter presents the outcomes of the IELS assessments of children’s emergent literacy and emergent numeracy skills in the United States. The metric for all learning scales in IELS is the same and the metric does not have a substantive meaning (unlike physical units of measure, such as ounces or yards). There is theoretically no minimum or maximum score in IELS; rather, the data are scaled to have approximately normal distributions, with the means around 500 and standard deviations around 100. The overall IELS mean of 500 score points represents the arithmetic mean of the means of the three participating countries. Only scale scores will be presented in this chapter; there are no subscale scores. Thus, two children with the same emergent literacy scale score may have scored differently on the three assessed emergent literacy skills, such that one was stronger in vocabulary and the other was stronger on listening comprehension. Two equal scale scores do not necessarily represent the same skill set.
In addition to directly assessing emergent literacy and emergent numeracy skills, the study collected indirect information on the children’s emergent literacy and emergent numeracy development through questionnaires administered to the children’s parents and educators, and this information is also presented in this chapter. Where parent and educator reports on aspects of children’s development are compared in tables, figures or other text, these analyses are based on the children for whom both parent and educator ratings were available. Parent and educator questionnaires also collected contextual information about the children’s lives at home and at school. This chapter reports how five-year-olds’ emergent literacy and emergent numeracy scores relate to their individual characteristics, family background characteristics, home learning environments, and early childhood education and care (ECEC) histories in the United States. It also considers the relationships between children’s emergent literacy and emergent numeracy scores and their scores in other learning domains assessed in IELS. Similarities and differences between the findings of IELS in the United States and those in the other participating countries, England and Estonia, are highlighted throughout. The chapter concludes with a summary and some preliminary conclusions.
copy the linklink copied!Emergent literacy and emergent numeracy scores in the United States
Five-year-olds in the United States have relatively low emergent literacy and emergent numeracy skills
In the IELS direct assessment of emergent literacy, the mean score for children in the United States was 477 points, significantly lower than the mean scores in Estonia (508 points) and England (515 points), which did not differ significantly from one another. The mean score of children at the 25th percentile in the United States was 414 points (compared with 452 in England and 440 in Estonia) and the mean score at the 75th percentile was 541 points (584 in England and 576 in Estonia).
For emergent numeracy, the mean score among US five-year-olds in the direct assessment was 471 points, 29 points lower than the overall emergent numeracy mean in IELS and significantly lower than the mean scores in Estonia (500 points) and England (529 points). The score of children at the 25th percentile in emergent numeracy in the United States was 409 points (compared to 465 in England and 435 in Estonia). For children at the 75th percentile the score was 537 points in the United States compared to 599 in England and 567 in Estonia.
The distributions of the emergent literacy and emergent numeracy scores of five-year-olds in the United States are shown in Figure 3.1.

Note: Graph produced using the first plausible values. For more information on the use of plausible values in the study, please consult the IELS Technical Report.
Evaluations of language and numeracy skills by parents and educators are broadly in line with children’s direct assessment scores, although parents tend to rate their children’s development more highly
Both parents and educators are important sources of information about five-year-olds’ emerging literacy and numeracy development. Parents know the most about their own children’s development and educators are trained professionals who work with many young children on a daily basis. In IELS, both the parents and the educators of each child were asked to indicate whether they deemed that child’s language and numeracy development to be less than average (either much less or somewhat less), average, or more than average (either somewhat more or much more).
According to their parents, just 6% of five-year-olds in the United States had below-average receptive language development (defined as the extent to which the child understands, interprets and listens) (Table 3.1). Over half (52%) of children in the United States had above-average receptive language skills according to their parents, and 42% had average receptive language development. In contrast, 29% of children were rated by their educators as having above-average receptive language skills, 51% were rated as having average receptive language skills, and one in five (20%) was rated as below average.
Children evaluated as having below-average receptive language development, whether by parents or educators, had significantly lower mean emergent literacy scores than those rated as average, who, in turn, had significantly lower mean emergent literacy scores than those rated as above average. Educators’ evaluations of children’s receptive language development were more strongly correlated with children’s directly assessed emergent literacy skills (r = .42), than parents’ evaluations (r = .22).
In the United States, 7% of five-year-olds had parents who described their expressive language development (i.e. the degree to which the child uses language effectively, can communicate ideas, etc.) as being below average, while around one in five study children (21%) had expressive language skills rated as below average by their educators. A majority of study children (58%) had parents who rated their expressive language development as above average, compared to 30% of children rated as above average by their educators. Children evaluated as having average expressive language skills, whether by their parents or their educators, had significantly higher mean emergent literacy scores than children rated as below average and significantly lower mean scores than children rated as above average (Table 3.2). Educators’ ratings were more strongly correlated with children’s emergent literacy scores (r = .41) than parents’ ratings (r = .29).
Most five-year-olds in the United States have mastered key language skills, according to their parents and educators
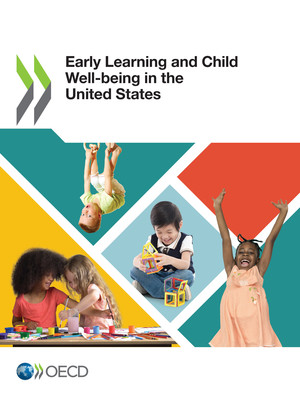
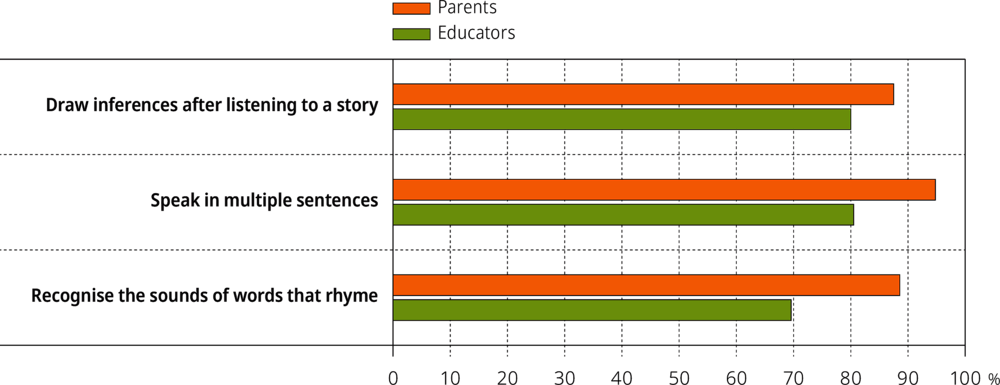
In addition to providing overall ratings of children’s language development, parents and educators were asked to indicate whether the children had mastered a number of specific language and literacy-related skills. In the United States, 88% of five-year-olds could draw inferences after listening to a story about how a character felt or about what might happen next, according to their parents. Similarly, 89% of children could recognise the sounds of words that rhyme and 95% could speak in multiple sentences (at least three) to explain something that had happened to them, according to their parents. US educators were less likely to indicate that children had mastered each skill, as was also the case in England and Estonia. The largest gap between educator and parent reports in the United States related to children’s ability to recognise rhyming sounds, with 89% of children able to do so according to parents, and 70% able to do so according to educators (Figure 3.2). In either case, children whose parents or teachers indicated that they had not mastered the skill had significantly lower mean emergent literacy scores than other children (Figure 3.3), with score-point gaps ranging from 73 to 95 points, depending on the skill and informant in question.
Note: All score-point differences between children reported as having mastered the skill in question and those reported as not having mastered it are statistically significant.
Parents also tend to rate their children’s numeracy development more highly than educators
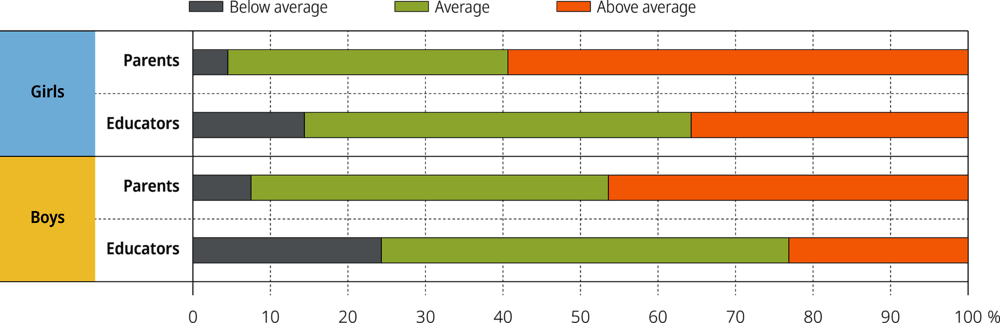
Parents and educators reported on their perceptions of their children’s numeracy development relative to average development for a five-year-old. Nearly twice as many children were reported as having below average numeracy development by their educators (17%) than were rated below average by their parents (9%). Children whose numeracy development was rated as average by their parents or by their educators had significantly higher mean emergent numeracy scores than children whose development was rated as below average and significantly lower scores than children whose development was rated as above average (Table 3.3). The correlation between educator ratings and direct assessment emergent numeracy scores was moderately strong (r = .38) and was stronger than the correlation between parent ratings and direct assessment scores (r = .27).
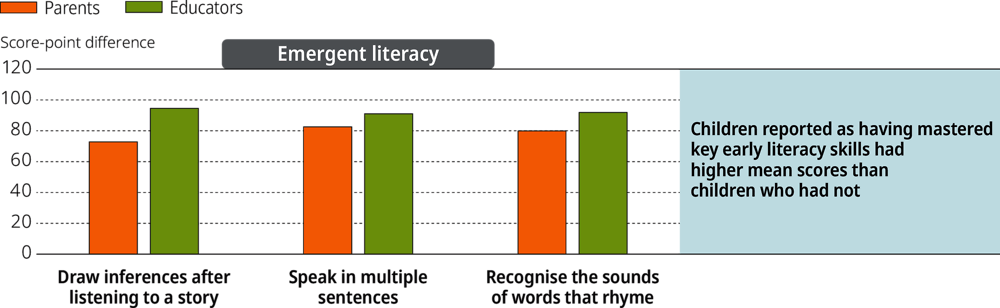
Parents and teachers were also asked to indicate whether the children had mastered each of a series of numeracy or mathematics-related skills. In all cases, parents were more likely than educators to indicate that their child had mastered the skill in question (Figure 3.4). The most common skills were being able to identify at least three different shapes (98% of the children according to their parents and 94% according to their educators) and to sort a group of objects by size, shape or colour (98% according to parents and 95% according to educators). The least common skill among five-year-olds was counting in multiples (mastered by 39% of children according to their parents and 33% according to educators). The largest gaps between parents’ and educators’ reports related to the children’s ability to recognise numbers up to 20 (73% of children could do so according to their parents, compared to 56% according to educators), and to do simple addition with objects (80% of children according to their parents, compared to 65% according to educators). On the whole, the children reported as having mastered a particular skill had significantly higher mean emergent numeracy scores than children who were not. The gaps ranged from 50 points (between children who could and could not identify numerals up to 20 in familiar contexts or between children who could or could not do simple addition, as reported by their parents) to 129 points (between children who could and could not sort a group of objects by size, shape or colour, according to their educators; Figure 3.5).
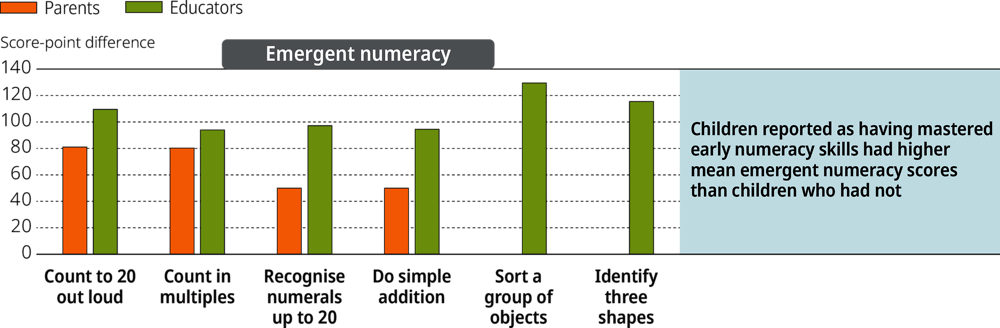
Note: All differences are statistically significant. The number of children whose parents reported they could not sort a group of objects or identify at least three shapes were very low. As their mean scores could not be reliably estimated, score-point differences between these and other children are not presented in this graph.
copy the linklink copied!Individual characteristics and emergent literacy and emergent numeracy scores
Five-year-old girls have higher emergent literacy scores than boys on average, but their emergent numeracy scores are similar
In the United States, girls scored higher than boys, on average, on the emergent literacy assessment (Figure 3.6). The 17-point difference in mean scores was statistically significant. There were similarly sized gender gaps in favour of girls in the other two countries participating in IELS: 16 points in England, 15 points in Estonia.
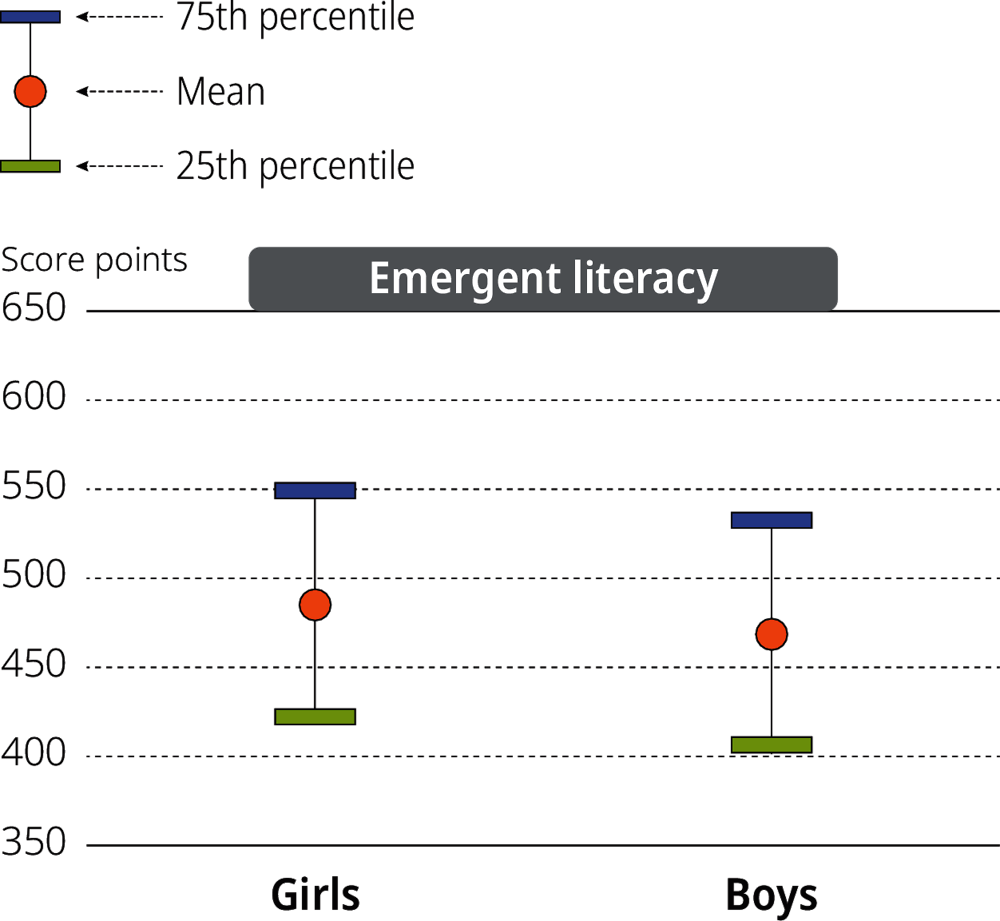
Note: The gender differences in scores at the mean and at the 75th percentile are statistically significant.
There was no significant difference between the mean emergent numeracy scores of girls and boys in the United States, at 471 points for both. There were also no significant gender differences in emergent numeracy in either England or Estonia.
Girls’ language skills tend to be more highly rated by their parents and educators
In line with their better average score on the IELS emergent literacy assessment, girls were more likely than boys in the United States to have parents and educators who rated their receptive and expressive language development as above average. Girls were also less likely to have their language development rated as below average by their parents and educators (Figure 3.7 and Figure 3.8).

Parents are also more likely to rate girls’ numeracy development as above average
Roughly equal proportions of girls and boys were rated as having average numeracy development by their parents and educators (Figure 3.9). Girls were somewhat more likely to be rated as above average in their numeracy development by their parents than boys were, and somewhat less likely to be rated as below average.

Age is positively related to emergent literacy and emergent numeracy scores in the United States
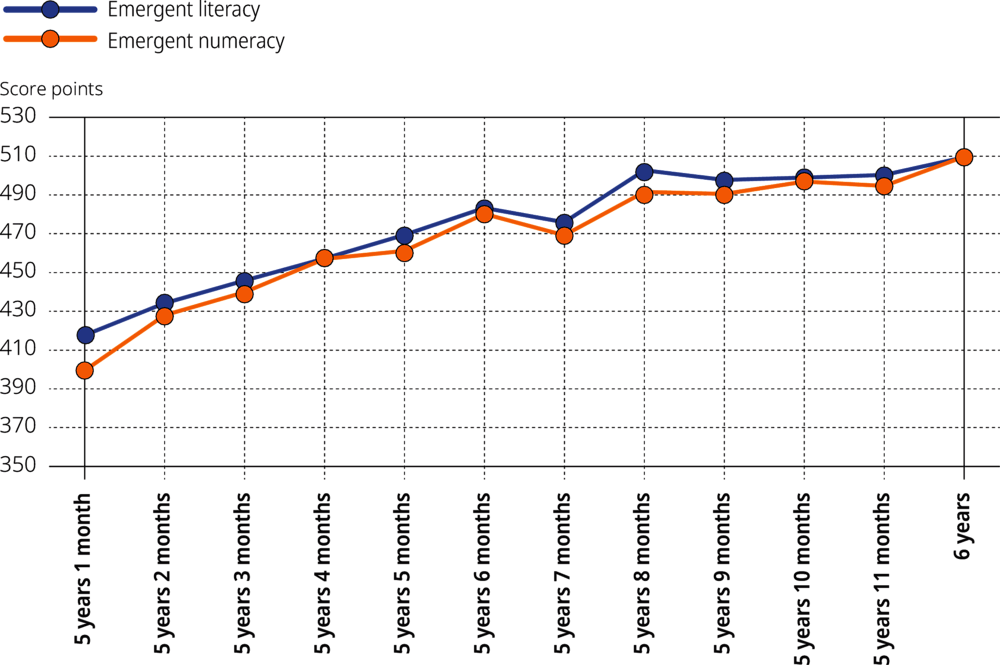
For both emergent literacy and emergent numeracy skills, there were significant correlations between children’s ages in months and their scores in the direct assessments. In the United States, the correlation between age and emergent literacy scores was .27, and between age and emergent numeracy scores, it was .29. The difference in emergent literacy scores between the oldest children in the sample (6 years, 0 months) and the youngest children (5 years, 1 month)5 was 92 points (87 points in England and 59 points in Estonia). For emergent numeracy, the corresponding gap in the United States was 110 points (126 points in England; 74 points in Estonia) (Figure 3.10).
Early difficulties are associated with lower scores at age five
Parents were asked to indicate whether their children had ever experienced each of a number of challenges or difficulties. In the United States, 10% of the children were reported by their parents to have had a low birth weight or to have been born prematurely6 (compared with 11% in England and 8% in Estonia); these children had significantly lower mean emergent literacy and emergent numeracy scores than their peers who had not, after accounting for socio-economic status (SES). Approximately one in eight US children (13%) had experienced learning difficulties (such as a speech or language delay, or an intellectual disability), according to their parents (compared with 10% in both England and Estonia). These children had significantly mean lower scores for both emergent literacy and emergent numeracy than other children. Additionally, around one in eight US children (12%) had social, emotional or behavioural difficulties, according to their parents (8% in England, 10% in Estonia). Again, these children had significantly lower mean emergent literacy and emergent numeracy scores than other children, after accounting for SES.
When each of the difficulties were examined in combination (i.e. examining the effects of each difficulty after accounting for the effects of other early difficulties) and after accounting for socio-economic status, having learning difficulties remained the only significant predictor of both emergent literacy and emergent numeracy (Figure 3.11).
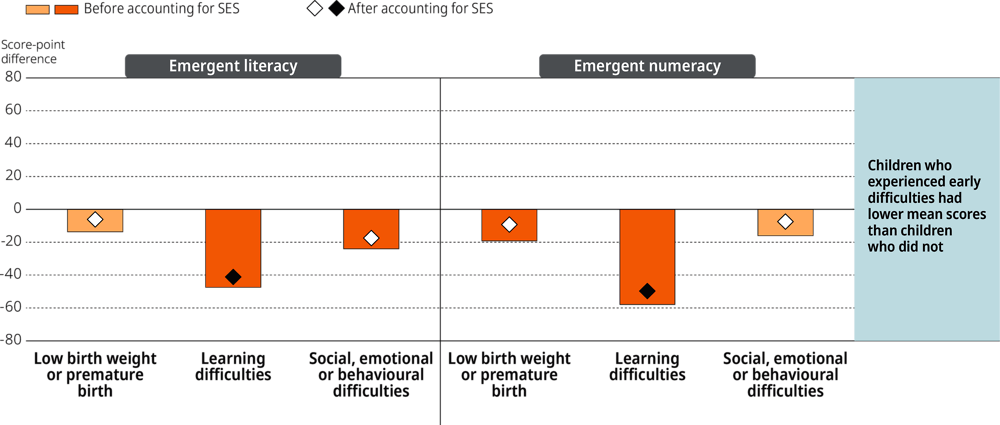
Note: Statistically significant differences are shown in a darker tone.
Girls were more likely to have had a low weight at birth or have been born prematurely than boys were in the United States (12% of girls and 8% of boys). Significantly more boys were identified as having had learning difficulties by their parents (10% of girls and 17% of boys) and as having social, emotional or behavioural difficulties (8% of girls and 16% of boys).
In the United States, 13% of children in the lowest SES quartile had a low birth weight or were born prematurely, compared to 7% of children in the highest quartile. Additionally, 18% of children in the lowest SES quartile had learning difficulties, according to their parents, compared to 8% of children in the top SES quartile. Finally, 16% of children in the lowest SES quartile had social, emotional or behavioural difficulties, according to their parents, compared to 7% of children in the top SES quartile.
In the United States, almost one in four boys (24%) in the lowest SES quartile were identified as having learning difficulties, compared to 11% of girls. Additionally, 20% of boys in the lowest SES quartile had social, emotional or behavioural difficulties, according to their parents, compared to 12% of girls in that SES quartile. There were no significant associations between race or ethnicity and low birth weight or prematurity; learning difficulties; or social, emotional or behavioural difficulties, before or after controlling for SES.
Overall in the United States, 27% of five-year-olds for whom information was available had experienced at least one of these challenges or difficulties, with 20% having experienced just one, 6% having experienced two and 1% having experienced all three.
copy the linklink copied!Home and family characteristics and emergent literacy and emergent numeracy scores
Higher socio-economic status is associated with higher emergent literacy and emergent numeracy scores
The index of socio-economic status (SES) constructed for use in IELS was based on household income, parental occupation and parental educational attainment.7 Socio-economic status scores were significantly positively correlated with children’s emergent literacy scores (r = .36) and emergent numeracy scores (r = .45) in the United States. Five-year-olds in the top SES quartile had a significantly higher mean emergent literacy score than children in the bottom SES quartile, by a margin of 84 points (Figure 3.12). The corresponding gap in emergent numeracy mean scores was 110 points, which is more than a standard deviation and similar to one year’s typical numeracy development at age five in the United States. There were no significant interactions between SES and gender with respect to either emergent literacy or emergent numeracy skills in the United States, i.e. the strength of the association between SES and learning outcomes was not significantly different for boys and girls.

The relationship between SES and emergent literacy was stronger in the United States than in Estonia and similar to that in England. However, the relationship between SES and emergent numeracy scores was stronger in the United States than in either of the other two participating countries. The gap between the mean emergent numeracy scores of those in the top and bottom SES quartiles in England was 86 points and 56 points in Estonia, considerably smaller than the 110-point gap in the United States. It should be noted that the United States has higher levels of income or wealth inequality than in the United Kingdom or Estonia (Gini coefficients8 of .39, .36 and .31, respectively).
A home language other than English is associated with lower average emergent literacy and emergent numeracy scores
In the United States, 20% of children in the study for whom information on home language was available lived in homes in which at least one parent mostly spoke a language other than the assessment language (compared with 16% in England and 6% in Estonia). These children had significantly lower mean emergent literacy and emergent numeracy scores in IELS than other children, even after accounting for SES (Figure 3.13). The assessments were only available in English in the United States and were not translated into any of the other languages that children may use at home or in their communities.9

Note: All differences are statistically significant.
Children’s immigration background is not related to their assessed emergent literacy and emergent numeracy skills after controlling for socio-economic status and home language
In the United States, 18% of the children had an immigrant background,10 the same proportion as in England and higher than the 2% in Estonia. After controlling for socio-economic status and home language (whether at least one parent mainly spoke a language other than English), the mean scores of children with and without an immigrant background did not differ significantly from one another in either domain.
There are no differences in emergent literacy and emergent numeracy scores along racial or ethnic lines after accounting for socio-economic status
Just over half of five-year-olds in the United States were White (52%), 25% were Hispanic, 11% were Black, 7% were Asian, 5% were of two or more races and less than 1% were of another ethnicity, such as Pacific Islander or American Indian/Alaska Native. There were no significant differences in the mean emergent literacy scores of White children and Black children, Asian children or children of two or more races.11 After accounting for SES, there was no significant difference in the mean emergent literacy scores of Hispanic and White children. There were no significant associations between children’s racial or ethnic backgrounds and the likelihood of their parents or educators characterising their language development (receptive or expressive) as below average, average or above average.
A similar picture emerged for emergent numeracy. The mean scores of White children did not differ significantly from children who were Black, Asian or two or more races. After accounting for SES, there was no significant difference in the mean emergent literacy scores of Hispanic and White children. There were no significant associations between children’s racial or ethnic backgrounds and how their parents and educators rated their numeracy development.
On the whole, children’s family structures are not significantly associated with their early literacy and numeracy scores after accounting for socio-economic status
In the United States, 15% of five-year-olds for whom information was available lived in one-parent households. After accounting for SES, there were no significant differences between the mean scores of children in one-parent and two-parent households in either emergent literacy or emergent numeracy.
Additionally, 14% of five-year-olds in the study had no siblings, 40% had one sibling, 26% had two siblings, 11% had three siblings, 5% had four siblings and 5% had five siblings or more. Previous research has found family size to be negatively related to children’s cognitive outcomes, regardless of family socio-economic status. This may be explained by the dilution of resources that can be given to any one child in larger families (Downey, 2001[13]). In the United States, such a negative effect12 was only observed for children who had five or more siblings. These children had significantly lower mean emergent literacy and emergent numeracy scores than children with one sibling, after accounting for SES.
Children whose mothers have higher educational attainment have better early literacy and numeracy skills
In the United States, just 3% of the children had mothers who had not completed ninth grade. There was a strong relationship between mothers’ educational attainment and their children’s emergent literacy and emergent numeracy scores (Table 3.4).
In the United States, 39% of children in IELS had mothers who had completed a bachelor’s degree or higher (a similar proportion as in England but lower than the 53% in Estonia). Children whose mothers held at least bachelor’s degrees had higher mean emergent literacy and emergent numeracy scores than children whose mothers had completed less formal education, even after accounting for household income (Figure 3.14)13.

Note: All differences are statistically significant.
copy the linklink copied!Home learning environment and children’s emergent literacy and emergent numeracy scores
The home is the first major context in which children learn, develop and grow. A home environment that is supportive of early learning, in terms of both stimulating resources and interactions, is an important determinant of children’s early cognitive outcomes. Collecting information on children’s home learning environments was an important focus of IELS.
Children from homes with greater numbers of children’s books have higher average emergent literacy and emergent numeracy scores
Approximately one in eight (12%) five-year-olds in the United States lived in homes that had 10 children’s books or fewer (compared to 13% in Estonia and 9% in England), while 26% lived in homes with more with 100 (10% in Estonia; 29% in England). Children with access to more children’s books in their homes – including those from a public or school library – had, on average, higher emergent literacy and emergent numeracy scores than children with fewer books (Table 3.5). The gaps in emergent literacy and emergent numeracy scores between the children with 10 or fewer books and those with more than 100 books were large in the United States, even after accounting for SES (Figure 3.15).
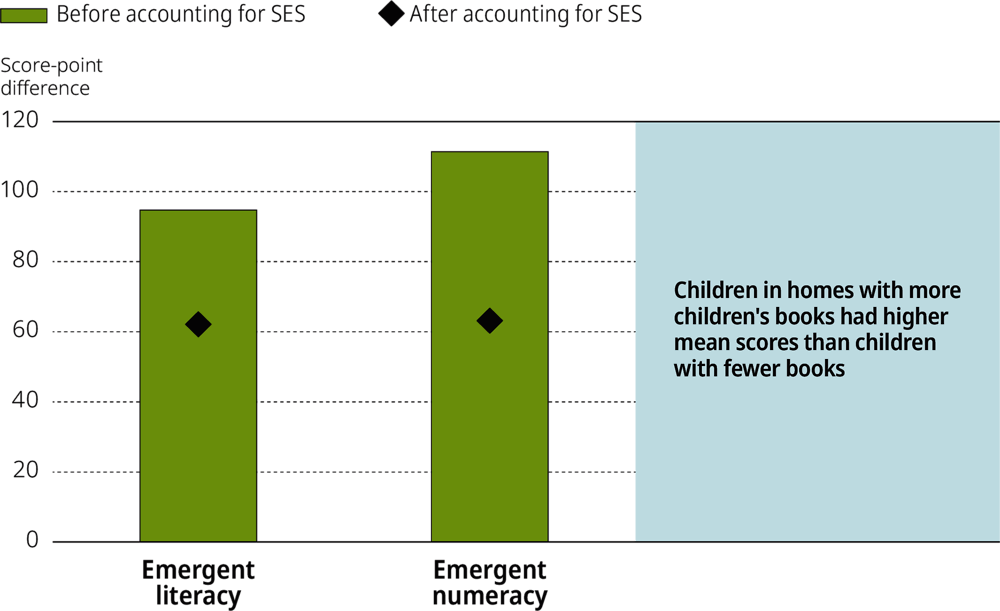
Note: All differences are statistically significant
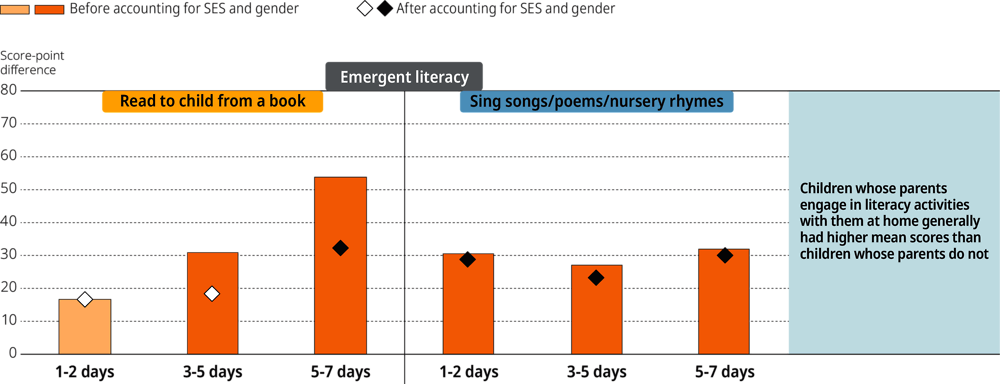
Children whose parents read books and sing songs to them at home most frequently have higher mean emergent literacy scores than other children
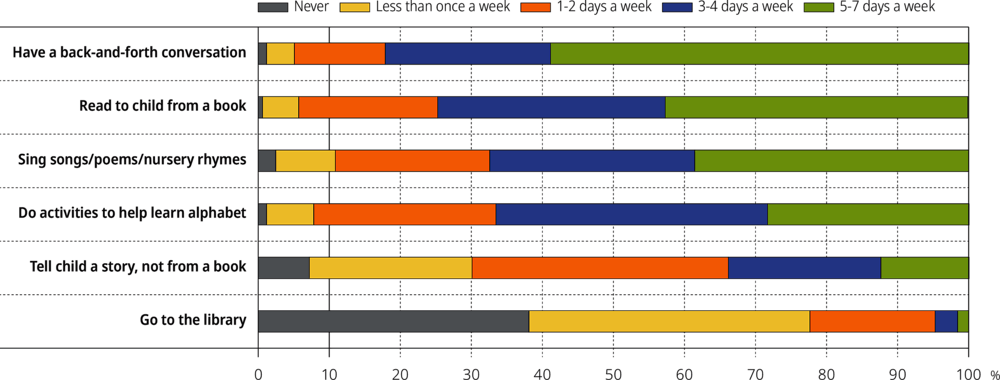
Figure 3.18 shows the percentages of children whose parents engage in each of a range of language and literacy-related activities with the child at home with varying frequency. The most common activities parents reported engaging in on five or more days per week were back-and-forth conversations with children about how they feel and why they feel that way (59% of children), followed by reading to the child from a book (43%) and singing songs, nursery rhymes or poems (39%).
There were no significant associations between a child’s gender and the frequency with which they were read to from a book, told a story, went to the library or engaged with activities at home to learn the alphabet. There were, however, significant associations between a child’s gender and the frequency with which their parents sang songs, nursery rhymes or poems to them, and the frequency with which their parents had back-and-forth conversations with them about their feelings. In the United States, 44% of five-year-old girls had parents who sang to them on five or more days a week, compared to 33% of boys. Additionally, 61% of girls had back-and-forth conversations about their feelings with their parents on at leave five days each week, compared to 56% of boys.
There were also some significant associations with socio-economic status. In the United States, 27% of children in the bottom SES quartile had parents who read to them from a book on 5-7 days per week, compared to 55% of children in the top quartile. There were statistically significant but weak associations between SES and frequency of going to the library (high-SES children were more likely to never go), having back-and-forth conversations (children in the top SES quartile were somewhat more likely to have these with their parents on at least five days each week), and doing activities aimed at learning the alphabet (children in the lowest SES quartile were more likely to do these with their parents on at least three days a week).
Children whose parents read to them from a book on at least five days each week had a significantly higher mean emergent literacy score than children whose parents read to them less than once a week (Figure 3.19). Children read to on 3-4 days per week also had a significant point advantage over children whose parents read to them less than once a week. These differences were significant before and after accounting for SES and gender. Additionally, children whose parents sang songs or nursery rhymes to them more than once a week had significantly higher mean emergent literacy scores than children whose parents did so less than once a week. These differences were significant after controlling for SES and gender.
The frequency with which parents told children stories (not from a book), had back-and-forth conversations with them about their feelings, and engaged in activities aimed at learning the alphabet were not significantly related to emergent literacy scores (it should be remembered that alphabet knowledge was not assessed in IELS).
Note: Statistically significant differences are shown in a darker tone.
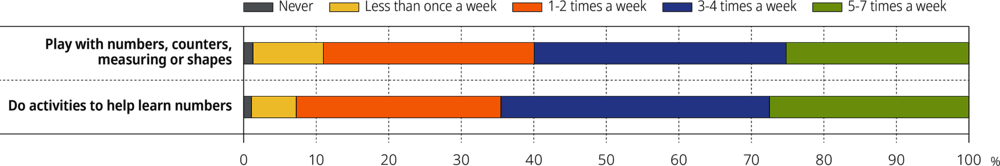
Most five-year-olds in the United States have parents who engage in numeracy-related activities with them at home at least once a week
Figure 3.18 shows the percentages of children whose parents engaged in numeracy-related activities at home with them with different frequency. Just one in ten children had parents who said they played with numbers, counting, measuring or shapes with them less than once a week and just 7% had parents who only engaged in activities designed to help them learn numbers less than once a week. There were no significant associations between a child’s gender and the frequency with which a child’s parents engaged in these activities with them at home. There was also no significant association between socio-economic status and frequency of activities at home to learn numbers. However, there was a statistically significant (but weak) association between SES and frequency of playing with numbers, counters, shapes or measuring, with 25% children in the bottom SES quartile doing so on at least five days a week with their parents, compared to 19% of in the top SES quartile.
Children who attend special or extra-cost activities with moderate frequency have higher mean emergent numeracy scores than children who never attend
Parents were also asked how often their five-year-old attended a special or paid activity outside the home (such as a sports activity, dance, scouts, or swimming or language lessons). In the United States, 27% of five-year-olds in IELS never attended such activities, 20% did so less than once a week, 36% did so on 1-2 days a week, 14% on 3-4 days a week, and 4% attended on five or more days a week. After accounting for SES, the mean emergent literary score of children who never attended such was not significantly different from the mean scores of those who did attend, regardless of frequency. Children who never attended these activities did have a significantly lower mean numeracy score than children who attended less than once a week or on 1-2 days a week (Figure 3.21), but their scores did not differ significantly from those of children who attended more frequently (3-4 or 5-7 days per week), after accounting for SES.
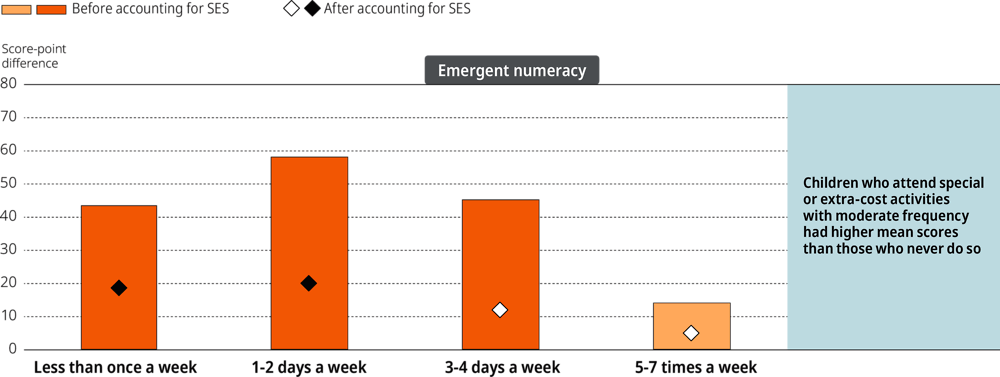
Note: Statistically significant differences are shown in a darker tone.
Children whose parents are more strongly involved in school activities score higher, on average, than other children
In the United States, 65% of five-year-olds had teachers who indicated that the child’s parents were either moderately or strongly involved in activities taking place at the school, which is lower than in England (69%) and Estonia (80%). These children had significantly higher mean emergent literacy and emergent numeracy scores than the 35% of children whose teachers reported that their parents were not involved or were only slightly involved in school activities, even after accounting for SES (Figure 3.20).
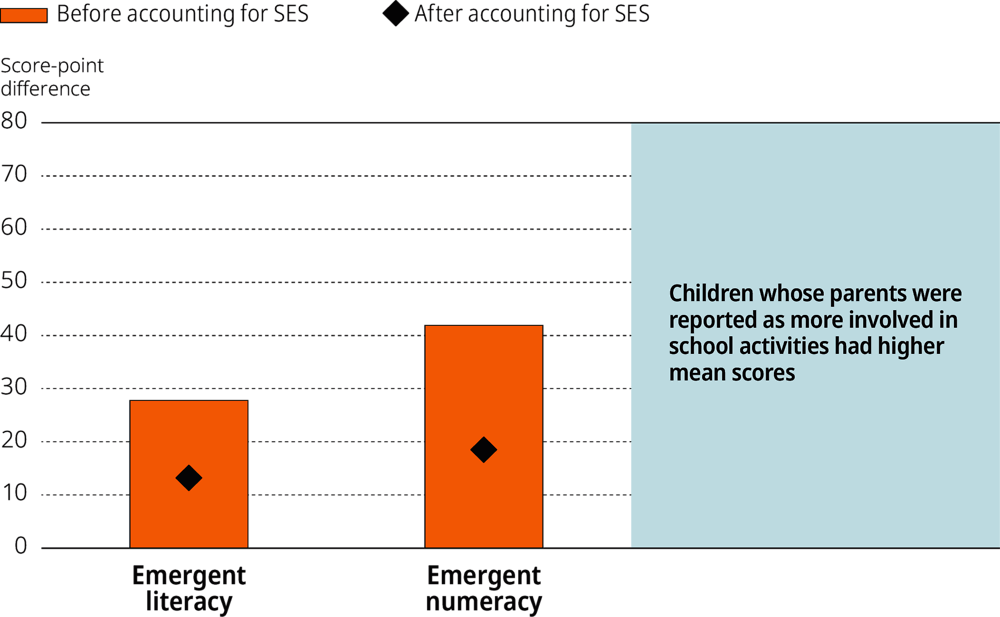
Note: All differences are statistically significant.
Moderate use of digital devices is associated with higher emergent literacy scores than both no use and frequent use
In the United States, approximately half (49%) of five-year-olds used a desktop or laptop computer, tablet device, or smartphone every day, according to their parents, more than the 39% in both England and Estonia. A further 40% of the US children used such devices at least once a week but not daily, while 7% did so monthly but not weekly, and 5% never or hardly ever did so. After accounting for SES, the mean emergent literacy score of children who never or hardly ever used devices was 40 points lower than those who used such devices monthly (a significant difference), and 28 points lower than those who used them weekly (also significant). Their mean scores did not differ significantly from those of children who used them every day (Figure 3.16). For emergent numeracy, the frequency of use of technological devices was not significantly associated with IELS scores after accounting for SES. There was no significant association between the frequency of device use and gender.
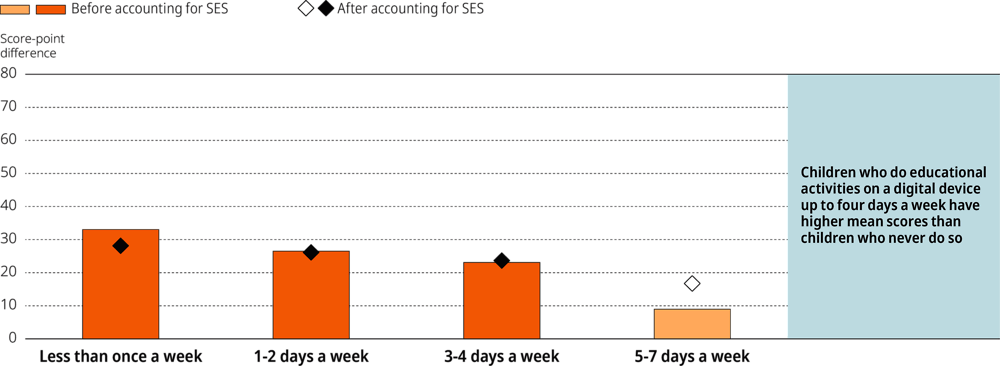
Parents were also asked to indicate how often children engaged in educational activities on a computer, tablet or smartphone (e.g. used an educational app). According to their parents, 20% of five-year-olds in the United States did so 5-7 days a week, 27% did so 3-4 days a week, 28% did so 1-2 days a week, 15% did so less than once a week, and 10% never did so. Children who never engaged in educational activities on devices had a significantly lower mean emergent literacy score than children who did so less than once a week or on 1-2 days per week, but were not significantly different from children who did so on either 3-4 or 5-7 days each week, after accounting for socio-economic status (Figure 3.17). There was no equivalent effect for numeracy.

Note: Statistically significant differences are shown in a darker tone.
Note: Statistically significant differences are shown in a darker tone.
copy the linklink copied!ECEC background and emergent literacy and emergent numeracy scores
Five-year-olds who have attended ECEC have higher mean emergent literacy and emergent numeracy scores than those who have not
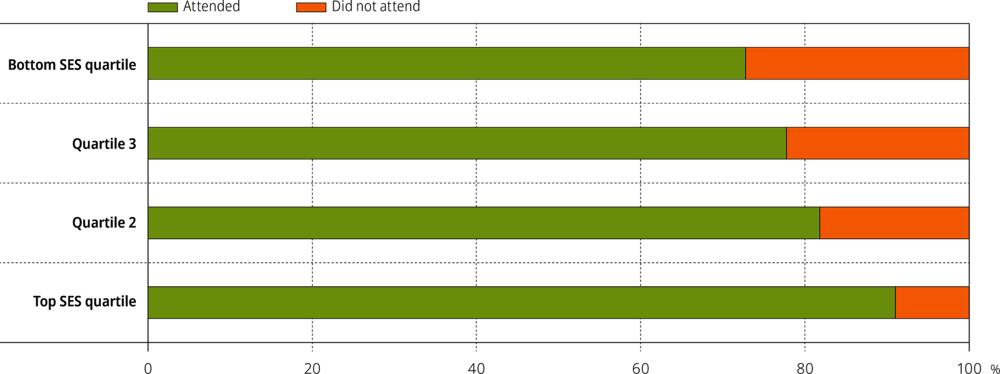
In the United States, 80% of the five-year-olds had attended an ECEC setting (ISCED 01 or 02)14 before starting school. Attendance varied significantly by socio-economic status, with 73% of children in the lowest SES quartile having attended, compared to 91% of children in the top SES quartile (Figure 3.23). Attendance did not vary significantly by racial or ethnic group, and boys and girls were equally likely to have attended.
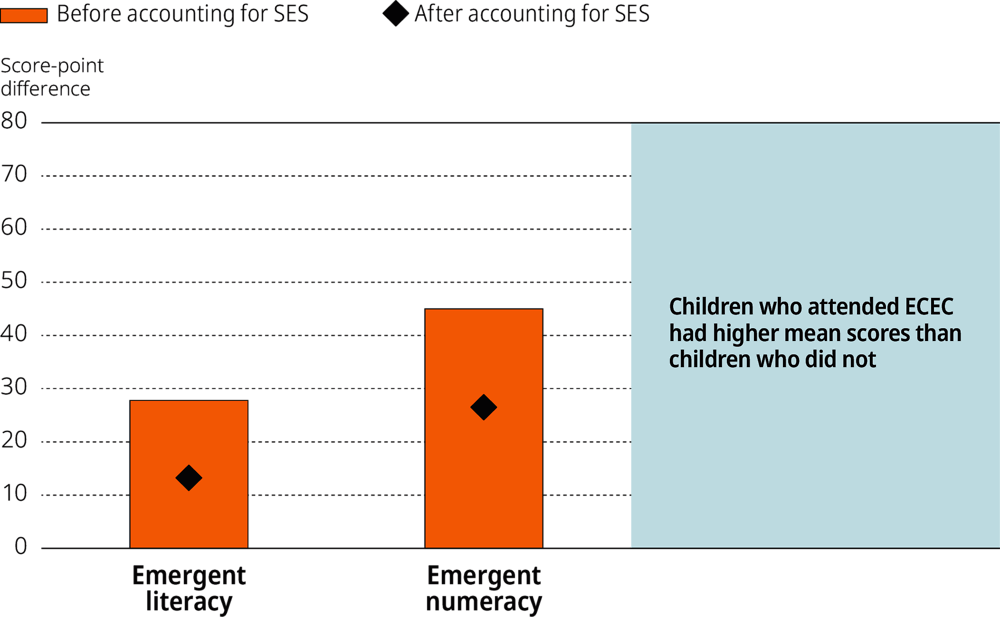
Children who had attended ECEC had significantly higher mean emergent literacy and emergent numeracy scores than children who had not: 28 points higher for literacy and 44 points for numeracy. After accounting for SES, the difference in mean scores between children who had attended ECEC and those who had not were 13 points for literacy and 26 points for numeracy, both statistically significant differences (Figure 3.24).
Note: All differences are statistically significant.
There were no significant interactions between ECEC attendance and socio-economic status, meaning that the strength of the relationships between attending ECEC and emergent literacy and emergent numeracy scores were similar for children from different socio-economic backgrounds in the United States.
Of those children who attended an ECEC programme before starting school, 38% started before the age of three and 62% started at three or four years old.15 After accounting for SES, the scores of children who started earlier did not differ significantly from those who started later.
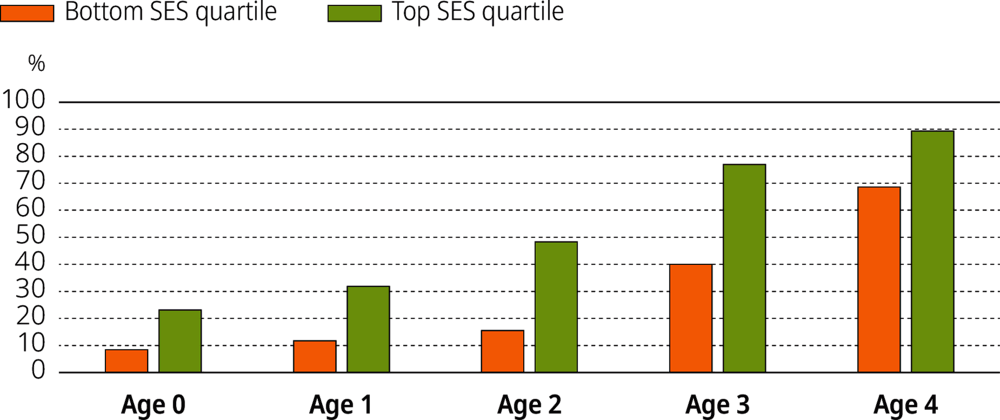
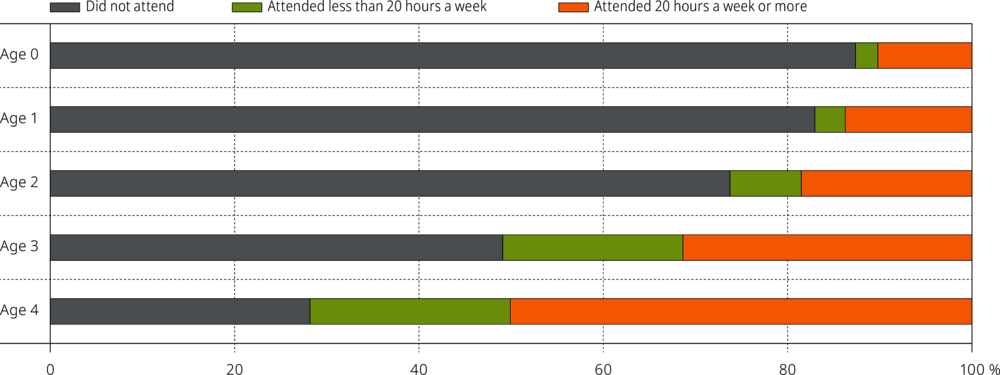
Figure 3.25 shows the ECEC participation rates of children in the top and bottom quartiles of SES. Participation was higher among children in the top quartile at every age. Figure 3.26 shows the breakdown of children who attended ECEC for longer or shorter hours at each age up to five.
copy the linklink copied!Assessing the combined effects of child, family and ECEC characteristics on emergent literacy and emergent numeracy scores
So far, this chapter has analysed the relationships between children’s scores and a series of characteristics individually or, in many instances, after accounting for the effects of a third variable (such as SES). It is also of interest to examine the statistical effects of these characteristics or factors in combination. In order to do so, variables that were significantly related to emergent literacy and emergent numeracy scores when examined individually were included in two regression models (one for emergent literacy and one for emergent numeracy) in order to assess how well they explained variation in the scores. Variables that were not significant in the models were removed one at a time16 until all the remaining variables were significantly related to the outcome.
A range of individual characteristics and contextual factors significantly predict the emergent literacy scores of children in the United States when examined in combination
Seven variables were significant predictors in the final model of emergent literacy: age; home language; socio-economic status; learning difficulties; social, emotional or behavioural difficulties; number of children’s books in the home; and frequency of use of digital devices at home (Table 3.7). Holding other variables in the model constant, children with learning difficulties had a mean literacy score that was 35 points lower than children without; the corresponding point difference for social, emotional or behavioural difficulties was 26 points. Each month of increasing age was associated with an increase in emergent literacy scores of 8 points. Everything else being equal, children from homes where at least one parent mainly spoke a language other than English had a mean score that was 34 points lower than children whose parent or parents mainly spoke English. Children with 10 books or fewer at home had a mean emergent literacy score that was significantly lower than children with 26 to 50 books (by 32 points), 51 to 100 books (by 40 points), and over 100 books (by 51 points), when all other variables in the model were held constant. Children who never used digital devices had a mean emergent literacy score that was significantly lower than the means of children who used them monthly or weekly, but not significantly different from the mean of children who used them daily, all else being equal. A one standard deviation increase in the index of socio-economic status was associated with an increase of 19 score points in emergent literacy, after accounting for the effects of all other variables in the model. The final model explains 30% of the variance in the emergent literacy scores of five-year-olds in the United States.
A range of individual characteristics and contextual factors significantly predict the emergent numeracy scores of children in the United States when examined in combination
Six explanatory variables were significant in the final model of emergent numeracy: age, learning difficulties, socio-economic status, ECEC attendance, parental involvement in school, and number of children’s books in the home (Table 3.8). Each month of increasing age was associated with an average increase of 8 points in emergent numeracy. All else being equal, children identified by their parents as having learning difficulties had a mean emergent numeracy score that was 47 points lower than other children. Children who had 10 or fewer books at home had significantly lower mean emergent numeracy scores than those with more. The gap between the scores of children with fewer than 10 books and those with more than 100 books was equivalent to 61 points on the emergent numeracy scale. One standard deviation increase in SES was associated with an increase in emergent numeracy score of 28 points. Children whose teachers indicated that their parents were moderately or strongly involved in school activities had a mean emergent numeracy score that was 15 points higher than children whose parents were less involved, when all other variables in the model were held constant. Finally, holding everything else equal, children who had attended an ECEC programme (ISCED 01 or ISCED 02) had a significantly higher mean emergent numeracy score than those who had not, by a margin of 20 points. The final model explains 36% of the variance in children’s emergent numeracy scores in the United States.17
copy the linklink copied!Relations between early literacy and numeracy scores and scores in other learning domains
Children’s early language and numeracy skills develop at the same time that they are developing a host of other skills, including self-regulation and a range of social-emotional competencies. Skills development in each of these areas is theorised to be mutually reinforcing. Young children with better language skills, for example, may be able to engage more successfully with their peers in interactions that support their prosocial development. Better prosocial skills may lead to further opportunities to interact with others in ways that are support their vocabulary development and oral comprehension. As IELS assessed a broad range of children’s early skills, it enables relations between these learning domains among five-year-olds to be examined.
Emergent literacy and emergent numeracy skills were strongly related to one another, and were also related to self-regulation and social-emotional scores
Figure 3.27 shows the correlations in the United States between five-year-olds’ emergent literacy scores and scores in each of the other learning domains assessed in IELS. Emergent literacy and emergent numeracy were very strongly positively correlated (r = .8). Moderate to strong correlations were also present between emergent literacy and the self-regulation subdomains of working memory and mental flexibility. The correlations between emergent literacy and most of the social-emotional skills were weaker, although still statistically significant and positive. The exception was children’s assessment scores for emotion identification, which were strongly correlated with emergent literacy scores.

Note: All correlations are statistically significant.
Similarly, emergent numeracy scores correlated strongly with working memory, mental flexibility and emotion identification scores. Correlations between emergent numeracy and educators’ assessments of prosocial behaviour, disruptive behaviour and trust, and the direct assessment of the self-regulation subdomain of inhibition, were weaker (Figure 3.28).
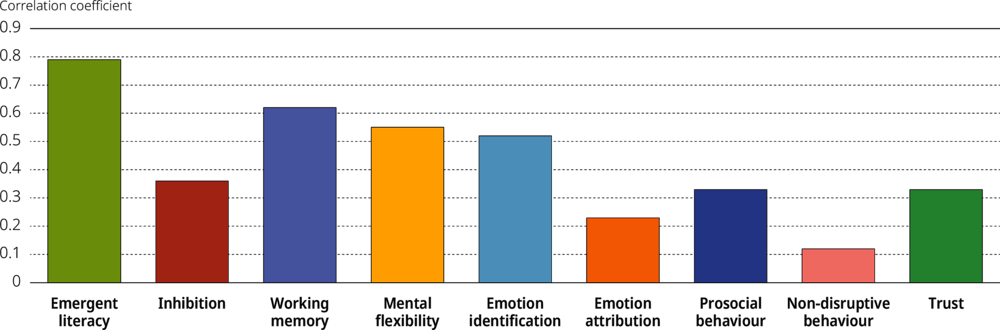
Note: All correlations are statistically significant.
copy the linklink copied!Summary
Five-year-olds in the United States had lower average scores in the emergent literacy and emergent numeracy assessments than those in the two other countries participating in IELS, England and Estonia.
Very few children had parents who indicated that their language or numeracy development was below average for a five-year-old. Parents were considerably less likely than educators were to indicate that their child’s development was below average, and parents’ evaluations were less strongly associated with children’s actual emergent literacy and emergent numeracy scores than educators’.
Five-year-old girls had a significantly higher mean emergent literacy score than boys in the United States. The gender gap was in the same direction and of similar size to gaps in England and Estonia. This finding is in line with assessments of reading achievement with older children in the United States and worldwide, where girls consistently outperform boys. Gender differences in affective factors relating to reading (such as reading attitudes, interest and motivation), as well as differences in reading behaviour (such as the nature and extent of leisure reading) have been implicated in the later gender reading gaps found consistently worldwide. The findings from IELS indicate that the roots of these gender gaps may be found before children are independently reading and that other factors may be involved in their formation.
In the United States, as in England and Estonia, five-year-old boys and girls had similar emergent numeracy scores. This stands in contrast to findings of assessments of mathematics undertaken with older students in the United States, where gender gaps in mathematics in favour of boys in the United States have been found in TIMSS (Grade 4), TIMSS Advanced and PISA, for example. The IELS findings suggest that gender gaps in mathematics may emerge later than age five, as children progress through school, perhaps due to the development over time of the socialised views about gender and mathematics ability that have been shown to affect girls’ mathematics self-concepts. Despite the fact that boys and girls had similar emergent numeracy scores in the United States, parents were more likely to characterise girls’ mathematics development as being above average.
Similar proportions of children in England, Estonia and the United States had experienced low birth weight or premature birth; learning difficulties; and social, emotional or behavioural difficulties. In the United States, boys were significantly more likely than girls to have had learning difficulties and twice as likely to have had social, emotional or behavioural difficulties, according to their parents. Children of lower socio-economic status were more likely to have experienced each of these issues, but there were no significant associations with race or ethnicity.
Socio-economic status was strongly associated with emergent literacy and emergent numeracy scores in the United States, with large gaps between the scores of children in the top and bottom SES quartiles. The gaps were considerably larger in the United States than in Estonia for both emergent literacy and emergent numeracy. The correlation between SES and emergent literacy scores was similar in magnitude in England and the United States, but the correlation with emergent numeracy scores was stronger in the United States.
Children in the United States from homes where at least one parent mainly spoke a language other than English had a lower mean emergent literacy score than other children, even after accounting for SES. These children also had a significantly lower mean emergent numeracy score than their peers, but the gap in mean scores was smaller. The assessments were, however, only offered in English and children were not screened for English proficiency. Thus, these findings may be due to the language demands of the assessment. Nevertheless, these findings point to a need for increased language support for children in the United States who have home languages that are not English. Differences in scores between children with and without an immigrant background appear primarily to be explainable by differences in socio-economic status and home language; when these variables were held constant there were no differences between the emergent literacy and emergent numeracy scores of five-year-olds with immigrant backgrounds and those without.
At the age of five, White children, Black children, Asian children and children of two or more races or ethnicities had similar average emergent literacy and emergent numeracy scores in the United States. After accounting for socio-economic status, there were also no significant differences in either domain between the mean scores of White and Hispanic children.
Several aspects of the home learning environment were associated with children’s emergent literacy and emergent numeracy skills in the United States as assessed in IELS. Children whose parents read books and sang songs to them more frequently had significantly higher emergent literacy scores, on average, than children whose parents did so less frequently. Children with access to more children’s books at home had higher mean scores in both domains. Additionally, children whose educators reported that the child’s parents were moderately or strongly involved in their schooling had significantly higher mean emergent literacy and emergent numeracy scores than children whose parents were reportedly less involved.
How frequently children use digital devices at home was also related to children’s scores. Children who never used these devices had a mean emergent literacy score that was significantly lower than that of children who used them with moderate frequency, but not significantly different from children who used them daily. There were no corresponding effects on emergent numeracy scores.
One in five children in the United States had not attended ECEC before starting kindergarten, and larger proportions of children in the top SES quartile attended than those in the bottom quartile. Children who had not attended had significantly lower mean scores in both emergent literacy and emergent numeracy than those who did attend ECEC, even after accounting for socio-economic status.
When looked at in combination, age; home language; SES; number of children’s books in the home; whether the child had learning difficulties or social, emotional or behavioural difficulties; and the frequency of using digital devices all significantly predicted five-year-olds’ emergent literacy scores in the United States. For emergent numeracy, age, whether the child had learning difficulties, number of children’s books in the home, SES, the level of parental involvement in school, and ECEC attendance were all significant predictors of children’s scores at the age of five.
Five-year-olds’ emergent literacy and emergent numeracy scores in the United States were also positively related to their social-emotional scores and their self-regulation scores, in line with previous research that suggests that these skills are mutually reinforcing. Children’s scores in these other learning domains are explored in Chapter 4 (self-regulation) and Chapter 5 (social-emotional learning).
References
[14] Beck, I., M. McKeown and L. Kucan (2013), Bringing words to life : robust vocabulary instruction, The Guilford Press.
[13] Downey, D. (2001), “Number of siblings and intellectual development: The resource dilution explanation”, American Psychologist, Vol. 56/6, pp. 497-504, https://doi.org/10.1037/0003-066X.56.6-7.497.
[1] Duncan, G. et al. (2007), “School readiness and later achievement”, Developmental Psychology, Vol. 43/6, pp. 1428-1446, https://doi.org/10.1037/[0012-1649.43.6.1428].supp.
[6] Kautz, T. et al. (2014), “Fostering and measuring skills: Improving cognitive and non-cognitive skills to promote lifetime success”, NBER Working Paper Series, No. 20749, National Bureau of Economic Research, Cambridge, MA, https://doi.org/10.3386/w20749.
[4] OECD (2019), PISA 2018 Results (Volume I): What Students Know and Can Do, PISA, OECD Publishing, Paris, https://dx.doi.org/10.1787/5f07c754-en.
[9] OECD (2016), Skills Matter: Further Results from the Survey of Adult Skills, OECD Skills Studies, OECD Publishing, Paris, https://dx.doi.org/10.1787/9789264258051-en.
[5] OECD (2013), OECD Skills Outlook 2013: First Results from the Survey of Adult Skills, OECD Publishing, Paris, https://dx.doi.org/10.1787/9789264204256-en.
[10] OECD (2013), Time for the U.S. to Reskill?: What the Survey of Adult Skills Says, OECD Skills Studies, OECD Publishing, Paris, https://dx.doi.org/10.1787/9789264204904-en.
[11] Raghubar, K. and M. Barnes (2017), “Early numeracy skills in preschool-aged children: A review of neurocognitive findings and implications for assessment and intervention”, Clinical Neuropsychology, Vol. 31/2, pp. 329-351, https://doi.org/10.1080/13854046.2016.1259387.
[2] Reynolds, A. et al. (2002), “Age 21 Cost-Benefit Analysis of the Title I Chicago Child-Parent Centers”, Educational Evaluation and Policy Analysis, Vol. 24/4, pp. 267-303, https://doi.org/10.3102/01623737024004267.
[7] Rigney, D. (2010), The Matthew Effect: How Advantage Begets Further Advantage, Columbia University Press.
[8] Ritchie, S. and T. Bates (2013), “Enduring links from childhood mathematics and reading achievement to adult socioeconomic status”, Psychological Science, Vol. 24/7, pp. 1301-1308, https://doi.org/10.1177/0956797612466268.
[3] Schweinhart, L. (2013), “Long-term follow-up of a preschool experiment”, Journal of Experimental Criminology, Vol. 9/4, pp. 389-409, https://doi.org/10.1007/s11292-013-9190-3.
[12] Snow, C. and T. Matthews (2016), Reading and Language in the Early Grades, www.futureofchildren.org (accessed on 5 December 2019).
Notes
← 1. Scoring at or below Proficiency Level 1 in PISA Reading.
← 2. Scoring at or below Proficiency Level 1 in PIAAC Reading.
← 3. Beck, McKeown and Kucan (2013[14]) propose a three-tier model of vocabulary development, where Tier 1 words are common words used in everyday speech (e.g. table and blue), Tier 2 words are high-frequency words that occur across contexts and are more common in written than spoken language (e.g. compare and coincidence). Tier 3 words are low-frequency words used in domain-specific contexts (e.g. thesis and ecosystem).
← 4. For more information, see the IELS assessment framework (OECD, 2020).
← 5. While a small number of children in the sample were aged 5 years, 0 months or 6 years, 1 month at the time of the assessment, there were too few of these children to meet reporting standards and so the mean scores of these children are not considered in this section.
← 6. A birth weight lower than 5lbs, 8oz was defined as low.
← 7. Where educational attainment information was available for two parents, the higher of the two was used.
← 8. The Gini coefficient is a measure of income or wealth distribution, where 1 corresponds to maximal inequality and 0 represents perfect equality.
← 9. The IELS assessments cannot tell us anything about children’s early literacy skills in these other languages.
← 10. Defined has having two parents who were born in a country or economy other than that in which the child participated in IELS (or one parent if information on only one parent was provided).
← 11. There were too few Pacific Islander and American Indian/Alaska Native children to reliably assess their abilities, and so their mean scores are not considered here.
← 12. Throughout this report, the term “effect” is used in a statistical sense only. The data collected do not permit causal attributions to be made.
← 13. Household income rather than the index of socioeconomic status in this case, because the SES index includes parental education levels.
← 14. Defined as a preschool, pre-kindergarten or transitional kindergarten in a public or private preschool, centre or place of worship, or childcare or day care in a centre with an educational component. Childcare or day care in the child’s home or someone else’s home are not categorised as ISCED settings.
← 15. A very small number of children started at the age of five, according to their parents. These children were too few to meet reporting standards and are not considered further here.
← 16. In order of descending p-value.
← 17. The variance explained by all the predictors in the model except the missing indicator for the parental involvement variable.
Metadata, Legal and Rights
https://doi.org/10.1787/198d8c99-en
© OECD 2020
The use of this work, whether digital or print, is governed by the Terms and Conditions to be found at http://www.oecd.org/termsandconditions.