
Measuring distance to the SDG targets – Hungary
Hungary has already achieved 16 of the 121 SDG targets for which comparable data are available and, based on most recent trends, is expected to meet 10 additional targets by 2030 (Figure 1). As virtually all OECD countries, Hungary has already met (or is close to meeting) most targets related to securing basic needs and implementing the policy tools and frameworks mentioned in the 2030 Agenda (see details in Table 1). Hungary’s economic outlook looks strong but more needs to be done to foster inclusion and strengthen the accountability and diversity of public institutions.
This country profile provides a high-level overview of some of Hungary’s strengths and challenges in performance across the SDG targets. As such, it differs in nature from Voluntary National Reviews (VNRs) or other reporting processes. To ensure international comparability, this assessment draws on the global indicator framework and relies on data from the SDG Global Database and the OECD. VNRs typically use national indicators that reflect national circumstances and are more up-to-date (See section How to read this country profile that provides some methodological details on country profiles).

Source: All data is taken and adapted from (UNDESA, 2021[1]), SDG Global Database, https://unstats.un.org/sdgs/unsdg and (OECD, 2021[2]), OECD.Stat, https://stats.oecd.org/ (accessed on 29 October 2021).
Hungary is among the fastest growing OECD economies. Over the past 15 years and despite the COVID-19 pandemic and the 2008 global financial crisis, average growth of GDP per capita was 1.6% (Target 8.1). The labour market is dynamic. The unemployment rate is around half the OECD average (Target 8.5) but earnings remain low. Despite the existence of a national strategy for youth employment (Target 8.b), too many youths are not in employment, education or training (Target 8.6). Hungary attracts large inflows of FDI. It is well integrated into the multilateral trading system and facilitates market access to least developed countries (Targets 10.a, 17.10 and 17.12).
Hungary has a well-developed network of protected areas. Protecting Hungarian biodiversity, which includes the largest continuous natural grassland in Europe, is key. In that respect, Hungary has exceeded the Aichi target, with protected areas covering 23% of the territory. In addition, more than 80% of freshwater, terrestrial and mountain areas that are considered to be key for biodiversity are protected (Targets 15.1 and 15.4). Hungary has also done well at mainstreaming biodiversity into the strategic plans for agriculture, forestry and fisheries sectors (Targets 14.6, 15.6, 15.8 and 15.9). All forest area under a long-term management plan although the proportion of forest area within legally established protected areas is below 25% (Target 15.2). A significant share or forest consists of plantations of mainly non-native species, including some that could be harmful to biodiversity. The built-up area is increasing faster than population growth and around 13% of it is degraded (Target 15.3). As a result, the extinction risk across different groups of species is above the OECD average (Target 15.5).
Social inclusion has been declining. Poverty and inequality are below the OECD average but have increased over the past decade (Targets 1.2, 10.1 and 10.2), partly reflecting weaker social protection and redistribution through taxes and transfers (Targets 1.3 and 10.4). For instance, only a quarter of unemployed persons receives unemployment cash benefit while recipients of out-of-work benefits (safety nets) only account for 13% of the poor working-age population. Hungary is also further away from achieving gender equality (Goal 5): it lacks comprehensive legal frameworks enforcing and monitoring gender equality (Target 5.1 and 5.3). While gender gap in managerial positions is relatively small, women are underrepresented in the political sphere (Target 5.5), holding only 13% of the seats in the National Assembly in 2021, less than half the OECD average. Women also bear the lion’s share of unpaid domestic and care work, with a gender gap over 2 hours per day (Target 5.4).Differences in gender, socio-economic background, immigration status and location explain a significant share of disparities in education outcomes (Target 4.5).
Risk factors weighing on health are very high in Hungary. High levels of fine particulate matter in the air result in a mortality from household and ambient air pollution which is more than twice the OECD average (Target 3.9). Unhealthy behaviours also have a severe impact on health outcomes. Hungary has a much higher mortality rate from cardiovascular disease, cancer, diabetes or chronic respiratory disease than in most OECD countries (Target 3.4). The prevalence of alcohol use disorders is almost three times the OECD average (Target 3.5) while tobacco consumption and obesity are well above the OECD average (Targets 2.2 and 3.a). Deaths from suicide are also much higher than the OECD average (Target 3.4).
There is scope to improve the accountability and diversity of public institution. While global data to monitor the accountability and transparency of public institutions are not yet available, proxy measures show that only half of citizens reported having confidence in their country's judicial system and courts (Target 16.6). On diversity, youths and women are not well represented in the parliament and Hungary reports a low score on diversity of central government workforce (Targets 5.5 and 16.7). Finally, available measures focusing on the rule of law, suggest that there is scope for improvement. In particular, the index of civil justice from the World Justice Project is one of the lowest of the OECD (Target 16.6).
Like in many other OECD countries, data availability remains a challenge when measuring distances to targets (see the Overview chapter for details). For Hungary, available data on the level of the different indicators allow covering 121 of the 169 targets. As shown in Figure 2 below, indicator coverage is uneven across the 17 goals. While seven goals (within the People, Planet and Prosperity categories) have most of their targets covered (the indicator coverage exceeds 80%), coverage is lower for Goal 11 on cities and Goal 13 on climate action (as well as for Goal 14 on life below water – but Hungary is a landlocked country and some Goal 14 Targets may not apply.), with half or fewer of their targets covered. Data gaps become starker when focusing on performance indicators, i.e. excluding those providing contextual information. In this case, coverage exceeds 80% for only Goal 3 on health and Goal 4 on education. Moreover, for seven goals, mostly within Planet category (Goals 12, 13, 14 and 15) but also in Goals 5 on gender equality, 11 on cities and 17 on partnerships, data are lacking to monitor progress over time for more than two in three targets.
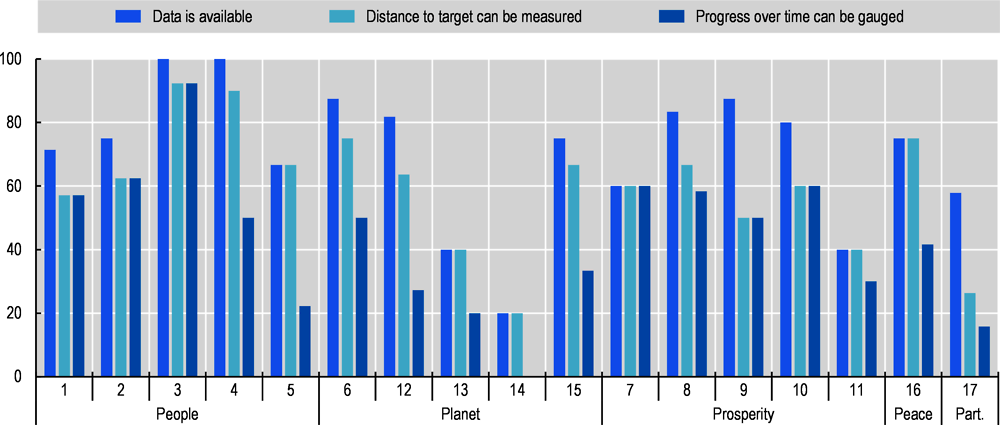
Note: The figure represents Hungary's share of targets covered by at least one indicator for each SDG. Numbers from 1 to 17 stand for the goals: 1 No poverty, 2 Zero hunger, 3 Good health and well-being, 4 Quality education, 5 Gender equality, 6 Clean water and sanitation, 7 Affordable and clean energy, 8 Decent work and economic growth, 9 Industry, innovation and infrastructure, 10 Reduced inequalities, 11 Sustainable cities and communities, 12 Responsible consumption and production, 13 Climate action, 14 Life below water, 15 Life on land, 16 Peace, justice and strong institutions and 17 Partnerships for the goals. These goals are grouped under five broad themes (the “5Ps”): People, Planet, Prosperity, Peace and Partnership. Beyond data availability, other statistical gaps such as timeliness or granularity also need to be considered. For instance, given the lag in available data, the effects of the pandemic on current distance and trajectories may not be reflected in the estimates.
Source: All data is taken and adapted from (UNDESA, 2021[1]), SDG Global Database, https://unstats.un.org/sdgs/unsdg and (OECD, 2021[2]), OECD.Stat, https://stats.oecd.org/ (accessed on 29 October 2021).
While some SDG Targets are, on average, close to being met, performance is very uneven across the 17 Goals of the 2030 Agenda for Sustainable Development. Table 1 presents an overview of Hungary’s progress towards targets based on available data for each of the 17 Goals. It shows that distances to Targets and trends over time differ significantly even when considering a specific goal.
The OECD report The Short and Winding Road to 2030: Measuring Distance to the SDG Targets evaluates the distance that OECD countries need to travel to meet SDG targets for which data are currently available. It also looks at whether countries have been moving towards or away from these targets, and how likely they are to meet their commitments by 2030, based on an analysis of recent trends and the observed volatility in the different indicators.
As most authors and international organisations, this report adopts a rather simple geometric growth model for assessing the direction and pace of recent changes in the context of the SDGs. Yet, instead of making direct estimates of the value of the indicator by 2030, it models the likelihood of achieving a specific level using Monte Carlo simulations.
While the report provides an overview of where OECD countries, taken as a whole, currently stand, country profiles provide details of the performance and data availability of individual OECD countries.
How to read the OECD SDG Wheel?
Progress on SDGs requires a granular understanding of countries’ strengths and weaknesses based on the consideration of the 169 targets of the 2030 Agenda. Figure 1 shows both current achievements (in the inner circle; the longer the bar, the smaller the distance remaining to be travelled) as well as whether OECD countries are on track (or are at least making progress) to meet their commitments by 2030 (in the outer circle).
The length of each bar shows current level of achievement on each target. As detailed in the Methodological Annex, countries’ distance to target is measured as the “standardised difference” between a country’s current position and the target end-value. For each indicator, the standardised measurement unit (s.u.) is the standard deviation observed among OECD countries in the reference year (i.e. the year closest to 2015). Therefore, the longer the bar, the shorter the distance still to be travelled to reach the target by 2030. The colours of the bars applied to the various targets refer to the goals they pertain to.
The outer ring shows how OECD countries are performing over time and how likely they are to meet the different targets by 2030 based on the observed trends of the various indicators. It uses stoplight colours to classify the progress towards the target:
green is used to indicate those countries that (based on the change in the different indicators over a recent period) should meet the target in 2030 just by maintaining their current pace of progress (i.e. more than 75% of (randomised) projections meet the target);
yellow for those countries whose current pace of progress is insufficient to meet the target by 2030 (i.e. less than 75% of randomised projections meet the target, while the correlation coefficient between the indicator and the year is high and statistically significant, implying that a significant trend could be detected); and
red for those countries whose recent changes have been stagnating or moving them further away from the target (i.e. less than 75% of randomised projections meet the target and the correlation coefficient between the indicator and the year is low or statistically insignificant, implying that no statistical trend could be identified).
How to read the Strength and Challenges sections?
With the aim of helping its member countries in navigating the 2030 Agenda and in setting their own priorities for action, this report relies on a unique methodology for measuring the distance that OECD countries have to travel to achieve SDG targets. The identification of the main strengths and challenges proposed in this report relies on current performances only:
A target is considered to be a strength when the distance to the target end-value is lower than 0.5 s.u. (i.e. the distance is deemed to be small) or when the country is closer to the target than the OECD average. For instance, while Korea's distance to Target 2.2 on malnutrition is 1.4 s.u. (i.e. classified as medium distance), the average OECD distance is 2.5 s.u. Therefore, Target 2.2 is categorised as being a strength for Korea.
A target is considered to be a challenge when the distance to target is greater than 1.5 s.u. (i.e. distance is deemed to be long) or when the country is further away from the target than the OECD average. For instance, Estonia's distance to Target 4.2 on pre-primary education is 1.1 s.u. (i.e. medium distance), which is higher than the 0.24 s.u. distance for the OECD average. Target 4.2 is therefore classified as a weakness for Estonia.
While the lack of consistent time series often prevents an exhaustive assessment of trends, they are discussed when available and relevant in nuancing the assessment of current performance.
How to read the Statistical Gaps section?
In total, this report relies on 537 data series supporting 183 of the 247 indicators listed in the global indicator framework (or for close proxies of these indicators). These indicators cover 134 of the 169 SDG targets. Yet, target coverage is uneven across the 17 goals and among OECD member countries.
Figure 2 summarises data availability:
darker blue bars indicate the share of targets for which at least one indicator (including indicators providing context information) is available
lighter blue bars indicate the share of targets for which the available indicator(s) include those having a clear normative direction (i.e. allowing to distinguish between good and bad performance), which are the only ones used to measure distances to target levels.
medium blue bars indicate the share of targets for which progress over time can be gauged (i.e. at least three observations are available over a five-year period).
All methods and concepts are further detailed in the Methodological Annex.