
Indicator C6. On what resources and services is education funding spent?
On average across OECD countries, staff compensation and other current expenditure represents about 90% of the spending in educational institutions, regardless of the level of education. The only exception is the tertiary level in Greece, where it is only 52% of total expenditure, meaning the remaining 48% of spending at tertiary level goes towards capital expenditure.
Staff compensation represents the largest share of current expenditure, accounting for a higher share in non-tertiary levels (primary, secondary and post-secondary non-tertiary education) (78%) than in tertiary education (67%) where expenditure also supports research and development (R&D).
On average across OECD countries, 82% of resources devoted to staff compensation at primary, secondary and post-secondary non-tertiary levels are allocated to staff salaries, 13% to pensions, and the remainder to other non-salary staff compensation including health care or health insurance, disability insurance, unemployment compensation, maternity and childcare benefits, and other forms of social insurance.
Context
How education spending is allocated between current and capital expenditure affects the provision of services such as meals, transport, housing and research activities; the level of staff salaries; the material conditions under which instruction takes place (via the expenditure on school buildings and maintenance); and the ability of the education system to adjust to changing demographic and enrolment trends.
Decisions about the resources devoted to educational institutions and their allocation between short-term and long-term goods and services can thus influence the quality of instruction and, by extension, student learning outcomes. Striking a proper balance that reflects their country’s educational priorities is a challenge all governments and institutions face, especially in times of crisis and competing priorities. Comparing the amount and distribution of educational expenditure across resource categories, and over time, can shed some light on the various organisational and operational arrangements developed by countries.
The allocation of education spending between public and private educational institutions also has equity implications, inasmuch as enrolment in private educational institutions is driven, among other factors, by family income and is associated with earning advantages.
This indicator describes how money for educational institutions from all funding sources (governments, international sources and the private sector) is spent on educational goods and services, both overall and by type of institution (public or private). It also analyses how total resources on compensation of staff, capital, and research and development (R&D) is allocated between public and private institutions, and how spending has varied over time.
Other findings
R&D represents an important share of expenditure at tertiary level and, as with the other expenditure categories, most of R&D expenditure at tertiary level is devoted to public institutions. Public tertiary institutions account for about two-thirds of the tertiary students enrolled across OECD countries, but account for an even larger share of R&D expenditure. Expenditure on R&D per student in public tertiary institutions (USD 6 200) is more than twice that in private ones (USD 2 900) on average across OECD countries.
Between 2012 and 2019, current expenditure per full-time equivalent student in public institutions from primary to tertiary education grew by an average of 2% per year across OECD countries. The greatest increases (over 4%) were observed in Hungary, Iceland, Lithuania, the Slovak Republic and Türkiye, with large increases in teachers’ compensation per student in Iceland and the Slovak Republic.
Public and private institutions divide their spending in similar ways: on average across OECD countries, both spend about 90% on current expenditure and 10% on capital expenditure. From primary to tertiary education, private institutions devote 68% of their current expenditure to staff, while the share is 76% in public institutions.
Distribution of educational institutions’ current and capital expenditure by education level
Expenditure on education is composed of current and capital expenditure. Current expenditure includes staff compensation and spending on the goods and services needed each year to operate schools and universities, while capital expenditure refers to spending on the acquisition or maintenance of assets which last longer than one year (see Definitions section). Differences in current and capital expenditure allocation across countries reflect the degree to which countries have invested in the construction of new buildings – for example as a response to increases in enrolment – or in the restoration of existing school premises, due to obsolescence and ageing of existing structures, or the need to adapt to new educational, societal or safety needs. Unlike current expenditure, capital expenditure can show large fluctuations over time, with peaks in years when investment plans are implemented, followed by years of troughs.
Given the labour-intensive nature of education, current expenditure represents the largest proportion of total expenditure on education in OECD and partner countries. In 2019, current expenditure accounted for 91% of total expenditure on primary to tertiary educational institutions in OECD countries, with the remainder devoted to capital expenditure (Figure C6.1). On average, the overall share of current expenditure does not differ by more than 3 percentage points across education levels, but there are larger differences across countries. The share of current expenditure on institutions at primary, secondary and post-secondary non-tertiary levels ranges from 82% in Latvia to 98% in Greece, and from 52% in Greece to 97% in Iceland at tertiary level (Table C6.1). Larger differences across educational levels are observed when considering current expenditure per student. In 2019, average current expenditure across OECD countries was almost USD 11 400 per student, with higher values at tertiary level (USD 16 500) than at non-tertiary levels (almost USD 10 000). Across all education levels, current expenditure per student varies widely across OECD and partner countries, ranging from about USD 5 100 in Greece to almost USD 22 500 in Luxembourg (Table C6.1).
Capital expenditure represents 9% of expenditure on primary to tertiary educational institutions on average across OECD countries, but reaches 12% or more in Australia, Estonia, Greece, Japan, Korea, Latvia and Norway (Figure C6.1). The share of capital expenditure is higher at tertiary level (10%) than at non-tertiary levels (8%). Greece has invested the largest share in infrastructure at tertiary level, and by a long way: in 2019, capital expenditure reached 48% of its total expenditure on tertiary education. At non-tertiary levels, Latvia allocates 18% of its education budget to capital expenditure, the highest share across countries with available data (Table C6.1). Average capital expenditure across OECD countries at all levels from primary to tertiary is slightly over USD 1 000 per student. Australia, Japan, Korea, Luxembourg, Norway and the United States invested the most per student in long-term assets in 2019 (over USD 1 500 per student), while Chile, Colombia, Italy and Lithuania invested the least (less than USD 500) among OECD and partner countries. Similar to current expenditure, on average across OECD countries, capital expenditure per student at tertiary level (USD 1 600) is far higher than at primary, secondary and post-secondary non-tertiary levels (USD 900) (Table C6.1, available on line).
Distribution of current expenditure
Current expenditure in educational institutions can be further subdivided into three broad functional categories: 1) compensation of teachers; 2) compensation of other staff; and 3) other current expenditure (including teaching materials and supplies, ordinary maintenance of school buildings, provision of meals and dormitories to students, and rental of school facilities). Current and projected changes in enrolment, changes to the salaries of education personnel, and the different costs of maintaining education facilities over time and across education levels can affect not only the amounts, but also the shares, allocated to each category.
In 2019, compensation of teachers and other staff employed in educational institutions comprised the largest share of current expenditure from primary to tertiary education (74% on average across OECD countries). This share has been stable on average over time, but varies significantly across countries and within education levels (Table C6.2). On average across OECD countries, staff compensation as a share of total current expenditure is higher in non-tertiary education (78%) than in tertiary education (67%), due to the higher costs of facilities and equipment in tertiary education. Belgium, Costa Rica, France, Greece and Poland report the greatest share of current expenditure allocated to staff compensation at tertiary level (75% or more) among OECD and partner countries. At non-tertiary levels, Belgium, Colombia and Greece devoted 85% or more of their educational expenditure to staff compensation, meaning they devoted less to other contracted and purchased services, such as support services (e.g. building maintenance), ancillary services (e.g. meal programmes) and rent for school buildings and other facilities (Table C6.2).
In countries with available data, compensation of teachers represents a larger share of current expenditure than that of other non-teaching staff, especially in non-tertiary education (Table C6.2). The difference in spending between teaching and non-teaching staff reflects the degree to which educational institutions count non-teaching personnel (such as principals, guidance counsellors, bus drivers, school nurses, janitors and maintenance workers) among their staff members.
In all OECD and partner countries with available data, teachers in tertiary education receive a smaller share of current expenditure than teachers in primary, secondary and post-secondary non-tertiary institutions. The largest difference is observed in the United Kingdom where tertiary teachers receive 32% of current expenditure compared to 71% for non-tertiary teachers. This reflects the complex nature of tertiary education where current expenditure is spent across a greater variety of staff and functions. For example, the compensation of staff involved in R&D activities and the purchase of related material can represent a significant share of current expenditure at tertiary level (Table C6.2).
Staff compensation relative to the number of students shows that remuneration of teachers and other staff is higher at tertiary education levels than at non-tertiary ones. In 2019, OECD countries spent on average about USD 8 200 per full-time equivalent student on staff compensation from primary to tertiary levels, ranging from USD 10 700 per student at tertiary level to USD 7 700 at non-tertiary. However, there were substantial variations across OECD and partner countries and levels of education. At primary, secondary and post-secondary non-tertiary levels, expenditure per student on staff compensation ranges from less than USD 3 000 in Colombia to more than USD 10 000 in Austria, Belgium, Iceland, Luxembourg, Norway and the United States. At tertiary level, spending on staff compensation per student exceeds USD 15 000 in Belgium, Luxembourg, Sweden and the United States (Table C6.2).
Variations in the share of current expenditure for expenses other than staff compensation (such as equipment available to staff, contracted services and rent) reflect the different cost structures of educational institutions across countries. Facilities and equipment costs are generally higher in tertiary education than at other levels. In addition, in some countries, tertiary institutions may be more likely to rent their premises, which can account for a substantial share of current expenditure. Chile and Italy devote the largest share to other current expenditure at tertiary level (almost 50% of total current expenditure), while at non-tertiary levels the share reaches 38% in the Czech Republic and Finland (Table C6.2).
Distribution of current and capital expenditure, by type of educational institution
On average, public and private institutions in OECD countries divide their spending between current and capital expenditure in a similar way. This conceals wide variation across countries, however. The share of current expenditure is at least 10 percentage points higher in public institutions than in private ones at non-tertiary levels in Poland and Portugal, and at tertiary level in Australia and Türkiye. Similarly, at non-tertiary levels, capital expenditure accounts for more than 15% of total expenditure in public institutions in Korea and Latvia, while the share is over 15% in private institutions in Australia, Latvia, Poland, and Türkiye. Costa Rica, Greece, Mexico and the United Kingdom record the lowest share of capital expenditure in public institutions at this level (less than 3%). At tertiary level, public institutions in Greece, Hungary and New Zealand have the highest shares of capital expenditure, at over 15%, while the highest shares for private institutions are in Australia, Hungary, Latvia, and Türkiye, also over 15% (Table C6.3).
Larger differences are observed when looking at capital expenditure per student, with values slightly higher in public than in private educational institutions on average. In public institutions, values are about twice as high at tertiary level (USD 1 600) as at non-tertiary levels (USD 900). Similarly, in private institutions, capital expenditure per student is also much higher at tertiary (USD 1 400) than non-tertiary (USD 770) level. At non-tertiary levels, the highest capital expenditure per student is observed in public institutions in Luxembourg (USD 3 000), and similarly in about 60% of countries, spending is higher in public than in private institutions. At tertiary level, the highest amounts are observed for private institutions in Australia and the United States (over USD 4 700), but in about two-thirds of countries, capital expenditure is higher in public institutions. From primary to tertiary education, the lowest values in public institutions (less than USD 400) are observed in Argentina, Brazil, Colombia, Costa Rica, Mexico, Portugal and the United Kingdom (Table C6.3, available on line).
The management of resources and the organisation of education systems can differ according to the type of institution. Staff compensation accounts for a larger share of current expenditure in public institutions across OECD countries: 79% compared to 72% in private ones at non-tertiary levels, and 68% compared to 61% at tertiary level. Private institutions may be more likely to contract services from external providers, or to rent school buildings and other facilities (as opposed to public institutions operating in state-owned properties). They may also be more likely to be at a disadvantage when purchasing teaching materials, as they cannot benefit from the same economies of scale in procurement as the public sector. In a number of countries, however, the share of current expenditure allocated to staff compensation is higher in private institutions, with differences of over 5 percentage points in the Czech Republic, the Netherlands, and the Slovak Republic at non-tertiary levels, and in Finland, Israel, Japan, Korea, the Netherlands and the Slovak Republic at tertiary level (Table C6.3).
In most OECD countries there are both public and private institutions at each level of education, with the share of students enrolled in private institutions often higher at tertiary level. This is the case for example in Chile, Israel, Korea, Latvia and the United Kingdom where at least 80% of tertiary students are enrolled in private institutions. The size of the private sector at different levels of education is important contextual information when considering the distribution of resources between public and private institutions. In most OECD and partner countries with available data, tertiary teachers receive a smaller share of current expenditure than teachers in non-tertiary education in both public and private institutions. Greece is the country where teachers in public institutions receive the largest share of current expenditure, both at tertiary (67%) and at non-tertiary levels (92%). In contrast, non-tertiary teachers in private institutions in Greece receive a much lower share of current expenditure (52%), although only about 5% of students are enrolled in private institutions at primary and secondary level, and tertiary education is only provided by public institutions. The pattern is similar in Italy and Spain where teachers in the public sector receive a larger share of current expenditure (at least 5 percentage points more) than teachers in the private sector at both tertiary and non-tertiary levels. This raises questions about spending choices in the private sector in these countries, given that teachers have a large impact on the quality of education systems (Figure C6.2 and Table C6.3).
Expenditure per student on compensation of teachers in non-tertiary public institutions is generally higher than in private institutions for countries with available data, amounting to about USD 6 300 per student on average across OECD countries. The biggest differences (over USD 3 000) are found in Italy, Luxembourg and Spain. In contrast, in Colombia, Estonia and the United Kingdom not only is the expenditure on staff compensation per student higher in private institutions than public ones, but the difference also exceeds USD 1 000. At tertiary level, the largest difference between staff compensation per student in public and private institutions among countries with available data is observed in Australia, Austria, the Czech Republic, Finland and Spain (above USD 3 500). However, Latvia, the Slovak Republic and the United States spend more on staff compensation per student in private tertiary institutions than in public ones (Table C6.3).
Allocation of staff compensation and capital and R&D expenditure between public and private educational institutions
The debate over the benefits and disadvantages of public and private education systems is long-standing and focuses on two main points. There is the concept of education as a public common good on the one side, as discussed by Reid (2003[1]) for example. On the other side, private educational institutions could provide a more innovative and performing educational environment (Alderman, Orazem and Paterno, 2001[2]), although this might lead to social segregation (Courtioux and Maury, 2020[3]).
Enrolment in private educational institutions is driven by many factors, including family income (Curi and Aquino Menezes-Filho, 2007[4]; Murnane et al., 2018[5]). It is associated with a significant and positive earning advantage compared to public institutions, even after controlling for school quality, family background and educational achievement (Sandy and Duncan, 1996[6]). The choice between investing in public or private educational institutions therefore has an important effect on equity and inclusiveness.
Across OECD countries, from primary to tertiary level, around 80% of the resources devoted to staff compensation, capital expenditure and expenditure on R&D are allocated to public educational institutions. The shares are higher at non-tertiary levels than at tertiary level, where less than three-quarters of total resources devoted to compensation of personnel and capital expenditure are invested in public educational institutions (Table C6.4, available on line).
In Belgium, Chile, Colombia, Finland, Israel, Japan, Korea, Latvia, the United Kingdom and the United States, the share of staff compensation allocated to private institutions in tertiary education is higher than the OECD average. The Czech Republic, Denmark, Estonia, Lithuania and Slovenia have the lowest shares (lower than 5%). Private institutions account for more than half of the share of capital expenditure in Belgium, Chile, Colombia, Israel, Japan, Korea, Latvia and the United Kingdom at tertiary education level, and in Chile, Colombia, Portugal and the United Kingdom at non-tertiary levels (Table C6.4, available on line). It should be noted, however, that the allocation of resources between public and private institutions is heavily influenced by the number of students enrolled in the two types of institutions.
At tertiary level, spending on research and development (R&D) is the category of expenditure with the largest share of funds allocated to public institutions (OECD average 83%). In Belgium, Chile, Korea, Latvia and the United Kingdom, however, more than half of the resources devoted to R&D are spent on private educational institutions (Table C6.4, available on line). Expenditure on R&D per student in public tertiary institutions (USD 6 200) is more than twice that in private ones (USD 2 900) on average across OECD countries. In Denmark, Finland, Luxembourg, Norway, Sweden and Switzerland, expenditure on R&D per student in public educational institutions was over USD 10 000 in 2019, while expenditure per student on R&D in private institutions exceeds USD 8 300 in Denmark and Sweden (Table C6.3).
Distribution of expenditure on staff compensation: salaries, pensions and other non-salary staff compensation
Robust pension schemes support good living standards in retirement and help to attract and retain high-quality teaching staff. However, spending on pension obligations must be appropriately balanced against expenditure on teachers’ salaries and other non-salary staff compensation. This can be difficult to achieve as countries’ pension expenditure depends on a variety of factors, such as the organisation of the education system and the general demographic and macroeconomic trends. Moreover, pension obligations that were entered into the past can affect pension expenditure for many decades in the future (OECD, 2021[7]).
Pension spending varies between levels of education. Primary and secondary levels often have greater pension expenditure than tertiary education, which may have more temporary staff. Similarly, there may be differences in pension benefits and coverage between public and private institutions as staff in public institutions may benefit from greater coverage. Underlying economic and demographic trends including population ageing and labour-market shocks also significantly affect the future organisation of pension schemes. The size of the working-age population is projected to decline by over one-quarter by 2060 in most European countries as well as in Japan and Korea, resulting in long-term financial pressures on pensions as the working-age population decreases (OECD, 2021[7]). This will be particularly felt by today’s young workers, who may have significantly worse pension coverage than their older colleagues.
Across OECD countries with available data, expenditure for salaries comprises the largest share of current expenditure for staff compensation in public institutions from primary to tertiary levels, ranging from 67% in the United Kingdom to at least 90% in Austria, Italy, and Mexico. Half of the countries allocated 14% or more to expenditure for retirement pension, with Greece (27%) and the United Kingdom (31%) allocating the most. Austria, Canada, Italy and Mexico allocated the least to staff pensions (5% or less). In Canada, Estonia, the Slovak Republic and Sweden, expenditure for other non-salary compensation exceeded 10% of current expenditure on staff compensation from primary to tertiary levels (Figure C6.3).
At the tertiary level, over 80% of resources are allocated to staff salaries in Austria, Canada, Finland, Japan, Korea, Luxembourg, Mexico, Slovenia and Türkiye. In Greece, Italy and Norway, more than 20% of expenditure on tertiary staff compensation is allocated to pensions, while in Canada, Poland, the Slovak Republic and Sweden, at least 14% of expenditure is allocated to non-salary compensation. In Costa Rica, only one-third of staff compensation at the tertiary level is allocated to salaries, while 58% is allocated to non-salary staff compensation (Table C6.6, available on line).
Austria, Italy and Mexico allocate the largest amount to staff salaries at the non-tertiary levels (more than 90%). Australia, Hungary, Italy, Poland and Sweden allocate at least 5 percentage points more to non-tertiary staff salaries than to tertiary staff salaries, while Japan and Korea allocate at least 7 percentage points less. The countries that allocate the largest share to staff retirement pensions at the non-tertiary levels (over 24%) include Greece, Japan and the United Kingdom, while Italy and Mexico allocate 2% or less to pensions (Table C6.6, available on line).
Trends in current expenditure
Between 2015 and 2019, total current expenditure at primary to tertiary levels grew by 7% on average (in constant 2015 prices), with large differences between countries. Current expenditure at all education levels grew by at least 23% in the Czech Republic, Israel and Türkiye between 2015 and 2019, but by 5% or less in Austria, France, Hungary, Italy and Japan. Argentina, Brazil, Finland, Latvia, Mexico and the United Kingdom were among the countries where current expenditure declined during this time. In over half of the countries with available data, current expenditure at tertiary level increased more than at non-tertiary levels, particularly in Hungary, Israel, Latvia, Luxembourg and Türkiye where the change in tertiary expenditure was at least 10 percentage points higher than for non-tertiary expenditure. Changes in expenditure on staff salaries from primary to tertiary level also varied markedly between countries, ranging from increases of 8% or less in Austria, Canada, Latvia and the United States, to increases of at least 34% in the Czech Republic, Lithuania and Türkiye. In Hungary, Latvia and Türkiye, the change in expenditure on staff salaries was at least 20 percentage points higher at tertiary level than at non-tertiary levels, while in the Czech Republic, Korea, Poland, Slovenia and Sweden, the change was at least 6 percentage points lower for expenditure on tertiary staff salaries than non-tertiary (Table C6.7, available on line).
Trends in the share of current expenditure devoted to staff pensions
The evolution of the share of expenditure devoted to staff compensation, and its distribution across salaries, pensions and other non-salary compensation, can provide information on spending priorities across OECD countries over time. In 2019, the share of current expenditure devoted to staff retirement pensions from primary to tertiary levels ranged from over 18% in Greece, Japan and the United Kingdom, to under 5% in Austria, Costa Rica, Ireland, Italy and Mexico. Between 2012 and 2019, the share of current expenditure devoted to staff pensions fell by 0.8 to 2.7 percentage points in Austria, Finland, Hungary, Japan and Türkiye, while in the United Kingdom, expenditure increased by 4 percentage points during this period (Figure C6.4 and Table C6.7, available on line).
Between 2015 and 2019, even after considering inflation, most countries with available data increased their expenditure on staff pensions in public primary to tertiary institutions, ranging from increases of over 20% in the Czech Republic, the Slovak Republic, Slovenia and Türkiye, to 10% and under in Germany, Korea, Latvia, Luxembourg, Norway and Poland. In contrast, Austria and Hungary are among the countries with the largest decreases (27%) over this period.
Notably, while the trend data show the changes in current expenditure devoted to pensions up to 2019, it does not necessarily capture future changes that will have a significant impact on the organisation and long-term sustainability of national pension systems. For example, In Italy, even though only 3% of current expenditure was devoted to staff retirement pensions in 2019 (Figure C6.4), the country’s rapidly ageing population is likely to put considerable pressure on the national pension scheme, requiring increased pension expenditure and raising the retirement age and/or reducing pension benefits (OECD, 2021[7]).
Trends in expenditure per student
The share of resources devoted to a given category of expenditure highlights how those resources are allocated compared to other costs, but provides no information about whether that funding is sufficient to cover students’ educational needs or the requirements of teachers. Although the shares devoted to current and capital expenditure do not show much variation on average over time – with current expenditure remaining at about 90% of total expenditure – the amount of current and capital expenditure per student shows greater variability both across countries and over time. These changes are due to the combination of changes in the resources devoted to education and in the student population.
Between 2012 and 2019, the average annual growth rate of current expenditure per student in public institutions from primary to tertiary education was 2% across OECD countries. The greatest increases (over 4%) were observed in Hungary, Iceland, Lithuania, the Slovak Republic and Türkiye, driven by large increases in teachers’ compensation per student in the cases of Iceland and the Slovak Republic. In Finland, Greece and Mexico, in contrast, current expenditure per student fell, mostly due to a reduction in staff compensation per student. In private institutions, current expenditure per student at primary to tertiary level remained generally stable on average between 2012 and 2019 in countries with available data, although it increased by at least 4% per year in Hungary, Iceland and Latvia, and fell by more than 8% in Türkiye (Table C6.5, available on line).
Teachers’ compensation per student in public institutions increased slightly between 2012 and 2019 in most countries with available data, with larger increases at tertiary level than at lower levels of education on average. At tertiary level, teachers’ compensation increased the most in the Czech Republic, Iceland, Lithuania and the Slovak Republic (between 5% and 11% on average per year), while the biggest annual decrease was recorded in Mexico (over 5%). At non-tertiary levels, Colombia, Iceland and the Slovak Republic experienced the largest increases (4% or more per year), while the largest annual decreases were observed in Finland and Mexico (Table C6.5, available on line).
The average annual growth rate in expenditure on R&D per student in public tertiary institutions between 2012 and 2019 shows wide variation across countries. Average increases exceeded 5% per year in Brazil, Hungary, Luxembourg and Poland. Luxembourg is also the OECD country with the highest expenditure on R&D per full-time equivalent tertiary student (see Indicator C1). In contrast, spending on R&D per student in public institutions fell by more than 1% in Chile, Mexico, Portugal and Türkiye. In most of these countries the negative trend is partly explained by an increase in the number of students without any proportional increase in funds devoted to R&D (Table C6.5, available on line).
Comparing trends in R&D spending per student in public and private institutions in countries with available data, the picture is somewhat mixed. In Belgium and Finland, both trends are positive, but R&D expenditure in public institutions grew faster than in private ones. Between 2012 and 2019, spending on R&D rose in public institutions but fell in private ones in Slovenia and Sweden. In Italy and Türkiye, spending on R&D fell in both public and private institutions, but faster in private institutions (Table C6.5, available on line).
Capital expenditure refers to spending on assets that last longer than one year, including construction, renovation or major repair of buildings and new or replacement equipment. The capital expenditure reported here represents the value of educational capital acquired or created during the year in question (i.e. the amount of capital formation), regardless of whether the capital expenditure was financed from current revenue or through borrowing. Neither capital nor current expenditure includes debt servicing.
Current expenditure refers to spending on staff compensation and on “Other current expenditure”, i.e. on goods and services consumed within the current year, which require recurrent production in order to sustain educational services (expenditure on support services, ancillary services like preparation of meals for students, rental of school buildings and other facilities, etc.). These services are obtained from outside providers, unlike the services provided by education authorities or by educational institutions using their own personnel.
Research and development includes research performed at universities and other tertiary educational institutions, regardless of whether the research is financed from general institutional funds or through separate grants or contracts from public or private sponsors.
Staff compensation (including teachers and non-teaching staff, see below) includes: 1) salaries (i.e. gross salaries of educational personnel, before deduction of taxes, contributions for retirement or health-care plans and other contributions or premiums for social insurance or other purposes); 2) expenditure on retirement pensions (actual or imputed expenditure by employers or third parties to finance retirement benefits for current educational personnel); and 3) expenditure on other non-salary compensation (health care or health insurance, disability insurance, unemployment compensation, maternity and childcare benefits, and other forms of social insurance). The “teachers” category includes only personnel who participate directly in the instruction of students. The “non-teaching staff” category includes other pedagogical, administrative and professional personnel as well as support personnel (e.g. head teachers, other school administrators, supervisors, counsellors, school psychologists and health personnel, librarians, and building operations and maintenance staff). At tertiary levels, “teaching staff” includes personnel whose primary assignment is instruction or research. This category excludes student teachers, teachers’ aides and paraprofessionals.
The annual average growth rate is calculated using the compound annual growth rate, which is the “common ratio” of a geometric progression over the time period under analysis. A geometric progression, in turn, is a sequence of numbers where each term after the first one is obtained by multiplying the previous one by a fixed, non-zero number (the common ratio). Assuming a linear trend, the compound growth rate hence represents the constant percentage change between one year’s value and the previous years.
Expenditure per student on educational institutions at a particular level of education is calculated by dividing total expenditure on educational institutions at that level by the corresponding full-time equivalent enrolment. Only educational institutions and programmes for which both enrolment and expenditure data are available are taken into account. Expenditure in national currencies is converted into equivalent USD by dividing the national currency figure by the purchasing power parity (PPP) index for gross domestic product. The PPP conversion factor is used because the market exchange rate is affected by many factors (interest rates, trade policies, expectations of economic growth, etc.) that have little to do with current relative domestic purchasing power in different OECD countries (see Annex 2 for further details).
The ranking of OECD countries by annual expenditure on educational services per student is affected by differences in how countries define full-time, part-time and full-time equivalent enrolment. Some OECD countries count every participant at tertiary level as a full-time student while others determine students’ intensity of participation by the credits that they obtain for the successful completion of specific course units during a specified reference period. OECD countries that can accurately account for part-time enrolment have higher apparent expenditure per full-time equivalent student on educational institutions than those that cannot differentiate between the different types of attendance.
For more information, please see the OECD Handbook for Internationally Comparative Education Statistics 2018 (OECD, 2018[8]) and Annex 3 for country-specific notes (https://www.oecd.org/education/education-at-a-glance/EAG2022_X3-C.pdf).
Data refer to the financial year 2019 (unless otherwise specified) and are based on the UNESCO, OECD and Eurostat (UOE) data collection on education statistics administered by the OECD in 2021 (for details see Annex 3 at https://www.oecd.org/education/education-at-a-glance/EAG2022_X3-C.pdf). Data from Argentina, the People’s Republic of China, India, Indonesia, Saudi Arabia and South Africa are from the UNESCO Institute of Statistics (UIS).
Data on expenditure for 2012 to 2019 were updated based on a survey in 2021-22, and expenditure figures for 2012 to 2019 were adjusted to the methods and definitions used in the current UOE data collection.
References
[2] Alderman, H., P. Orazem and E. Paterno (2001), “School quality, school cost, and the public/private school choices of low-income households in Pakistan”, The Journal of Human Resources, Vol. 36/2, pp. 304-326, https://doi.org/10.2307/3069661.
[3] Courtioux, P. and T. Maury (2020), “Private and public schools: A spatial analysis of social segregation in France”, Urban Studies, Vol. 57/4, pp. 865-882, https://doi.org/10.1177/0042098019859508.
[4] Curi, A. and N. Aquino Menezes-Filho (2007), “Os determinantes dos gastos com educação no Brasil”, Pesquisa e Planejamento Econômico, Vol. 40/1, http://repositorio.ipea.gov.br/handle/11058/5102.
[5] Murnane, R. et al. (2018), “Who goes to private school?”, Education Next, Vol. 18/4, pp. 58-66, https://www.educationnext.org/who-goes-private-school-long-term-enrollment-trends-family-income/.
[7] OECD (2021), Pensions at a Glance 2021: OECD and G20 Indicators, OECD Publishing, Paris, https://doi.org/10.1787/ca401ebd-en.
[8] OECD (2018), OECD Handbook for Internationally Comparative Education Statistics 2018: Concepts, Standards, Definitions and Classifications, OECD Publishing, Paris, https://doi.org/10.1787/9789264304444-en.
[1] Reid, A. (2003), “Public education as an education commons”, Discussion Paper, Australian Council of Deans of Education, Bundoora, Victoria, https://www.acde.edu.au/?wpdmact=process&did=MjEuaG90bGluaw==.
[6] Sandy, J. and K. Duncan (1996), “Does private education increase earnings?”, Eastern Economic Journal, Vol. 22/3, pp. 303-312, https://www.jstor.org/stable/pdf/40325720.pdf.
Cut-off date for the data: 17 June 2022. Any updates on data can be found on line at: https://doi.org/10.1787/eag-data-en. More breakdowns can also be found at http://stats.oecd.org, Education at a Glance Database.
Table C6.1. Share of current and capital expenditure, by level of education (2019) |
|---|
Distribution of current and capital expenditure from public and private sources |
 |
Note: Data on expenditure per student for primary to tertiary education (Columns 17 to 22) are available for consultation on line (see StatLink below). The figures for current and capital expenditure reported on line might not correspond to the total expenditure on educational institutions reported in Table C1.1. This is because the institutions have either increased or reduced their fund balances during the period in question and because the figures presented in Indicator C1 cover expenditure inside and outside educational institutions, while figures presented here only cover expenditure on educational institutions. See Definitions and Methodology sections for more information. Data and more breakdowns available at: http://stats.oecd.org/, Education at a Glance Database. |
2. Post-secondary non-tertiary figures are treated as negligible. |
Source: OECD/UIS/Eurostat (2022). See Source section for more information and Annex 3 for notes (https://www.oecd.org/education/education-at-a-glance/EAG2022_X3-C.pdf). Please refer to the Reader’s Guide for information concerning symbols for missing data and abbreviations. |
Table C6.2. Share of current expenditure, by resource category (2019) |
|---|
Distribution of current expenditure from public and private sources as a percentage of total current expenditure |
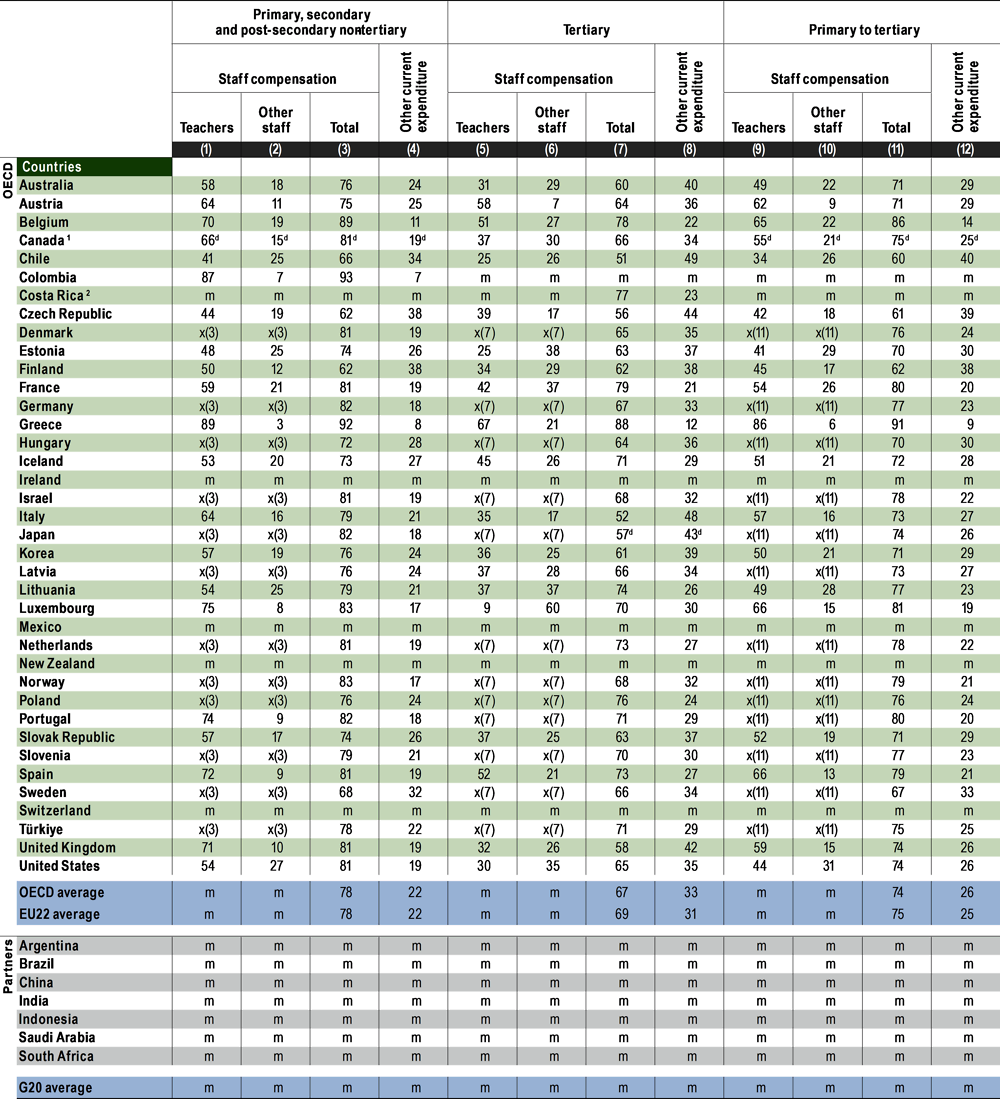 |
Note: Some levels of education are included with others. Refer to "x" in Table C6.1 for details. Data on expenditure on staff compensation per student for primary to tertiary education (Columns 13 to 15) are available for consultation on line (see StatLink below). "Tertiary staff" includes personnel employed whose primary assignment is instruction or research (Column 14, available on line). See Definitions and Methodology sections for more information. Data and more breakdowns available at: http://stats.oecd.org/, Education at a Glance Database. |
Source: OECD/UIS/Eurostat (2022). See Source section for more information and Annex 3 for notes (https://www.oecd.org/education/education-at-a-glance/EAG2022_X3-C.pdf). Please refer to the Reader’s Guide for information concerning symbols for missing data and abbreviations. |
Table C6.3. Share of current expenditure, by resource category and type of institution (2019) |
|---|
Distribution of current expenditure by educational institutions |
 |
Note: Some levels of education are included with others. Refer to "x" in Table C6.1 for details. Data on staff compensation as a percentage of current expenditure (Columns 17 to 24), on expenditure on compensation of teachers per student for primary to tertiary education (Columns 25 to 30), on capital expenditure per student (Columns 31 to 36) and on research and development (Columns 37 to 38) are available for consultation on line (see StatLink below). See Definitions and Methodology sections for more information. Data and more breakdowns available at: http://stats.oecd.org/, Education at a Glance Database. |
Source: OECD/UIS/Eurostat (2022). See Source section for more information and Annex 3 for notes (https://www.oecd.org/education/education-at-a-glance/EAG2022_X3-C.pdf). Please refer to the Reader’s Guide for information concerning symbols for missing data and abbreviations. |