copy the linklink copied!Health expenditure by type of service
Factors such as how care is organised and prioritised across providers, input costs and population needs all affect the level of spending across different services. Inpatient and outpatient services comprise the greatest share – typically accounting for around 60% of all health spending across OECD countries (Figure 7.14). Medical goods (mostly pharmaceuticals) take up a further 20%, followed by a growing share on long-term care, which in 2017 averaged around 14% of health spending. Administration and overall governance of the health system, together with preventive care covered the remainder.
The structure of spending across the various types of care can vary considerably by country. About 42% of health spending in Greece can be attributed to inpatient (curative and rehabilitative) care services. This is by far the highest share and some 14 percentage points above the OECD average. At the other end of the scale, many of the Nordic countries, but also Canada and the Netherlands, saw inpatient services account for a quarter or less of all spending. Outpatient care, covering generalist and specialist consultations, was particularly high in Portugal and Israel relative to the OECD average of 32%. Greece and Belgium spent the lowest proportion on outpatient services.
Spending on medical goods comprises the third largest category. Prices of goods generally tend to be less variable across countries than services (see indicator on Prices in the health sector). This means that spending on pharmaceuticals and medical devices often accounts for a higher share of health spending in lower income countries. As such, medical goods accounted for more than a third of all health spending in the Slovak Republic. By contrast, in Denmark, Norway, the Netherlands and Sweden, the share was much lower, at between 10 and 12%.
Where formal arrangements are in place for the care of the elderly and the dependent population such as in Norway, Sweden and the Netherlands, a quarter or more of all health spending can relate to long-term care services. In countries with a more informal long-term care sector such as in many Southern, Central and Eastern European countries, spending on long-term care is much lower – around 5% or less in Greece, Portugal, Hungary and Latvia.
A vital component of any health system that stretches across the different types of services described above is primary care. As a proxy for this complex concept, primary care is here defined to include a variety of different services such as general outpatient care, preventive services, dental care services and home-based curative services when provided by ambulatory care providers. Using this proxy measure, primary care accounts for around 13% of all health spending across the OECD, ranging from around 10% in Switzerland, the Slovak Republic, the Netherlands and Austria to 18% in Australia and Estonia (Figure 7.15).
Growth in health expenditure resumed across all areas following the general slowdown after the economic crisis (Figure 7.16). During the years of the economic downturn, some governments introduced policies to protect expenditure for primary care and front-line services while looking to make cost savings elsewhere in the health system. Reducing wages in public hospitals, postponing staff replacement and delaying investment in hospital infrastructure were among the most frequent measures taken in OECD countries to balance health budgets. While outpatient care and long-term care continued to grow annually during the period 2009-13, spending on inpatient care and administration stalled in many countries, and decreased for pharmaceuticals and prevention services.
These cuts have since been reversed, and prevention was the fastest growing area between 2013-17 at 3.2% on average, annually. The rate of growth for outpatient care has more than doubled (2.8% vs 1.1%), and inpatient care grew by 2.4%. Spending on pharmaceuticals and administration increased more modestly at 1.6% and 2.0% per year, respectively. Finally, spending on long-term care has continued to grow at a consistent rate since 2003.
The System of Health Accounts (OECD, Eurostat and WHO, 2017[1]) defines the boundaries of the health care system from a functional perspective, with health care functions referring to the different types of health care services and goods. Current health expenditure comprises personal health care (curative care, rehabilitative care, long-term care, ancillary services and medical goods) and collective services (prevention and public health services as well as administration – referring to governance and administration of the overall health system rather than at the health provider level). Curative, rehabilitative and long-term care can also be classified by mode of provision (inpatient, day care, outpatient and home care).
A key health service that has been notably missing in the SHA framework is primary care. Efforts have been made in recent years to develop a methodology using the SHA framework to develop a proxy indicator for primary care spending (Mueller and Morgan, 2018[2]). Comparability of primary care figures is mainly affected by the extent to which countries are able to distinguish between generalist and specialist services and the methods used to implement such a split.
For the calculation of growth rates in real terms, AIC deflators are used.
References
[2] Mueller, M. and D. Morgan (2018), “Deriving preliminary estimates of primary care spending under the SHA 2011 framework”; http://www.oecd.org/health/health-systems/Preliminary-Estimates-of-Primary-Care-Spending-under-SHA-2011-Framework.pdf.
[1] OECD/Eurostat/WHO (2017), A System of Health Accounts 2011: Revised edition, OECD Publishing, Paris, https://doi.org/10.1787/9789264270985-en.
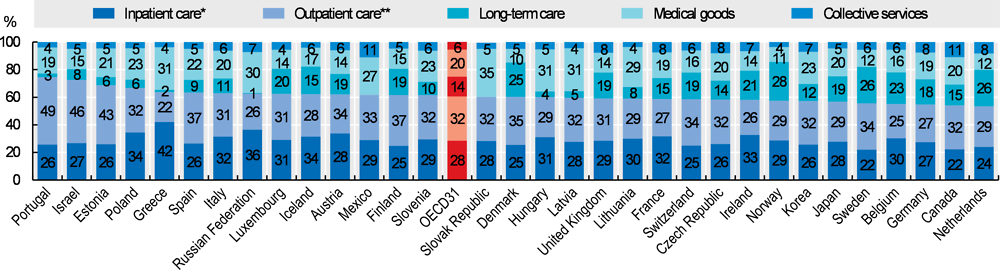
Note: Countries are ranked by curative-rehabilitative care as a share of current expenditure on health.
* Refers to curative-rehabilitative care in inpatient and day care settings. ** Includes home care and ancillary services.
Source: OECD Health Statistics 2019.

Source: OECD Health Statistics 2019.
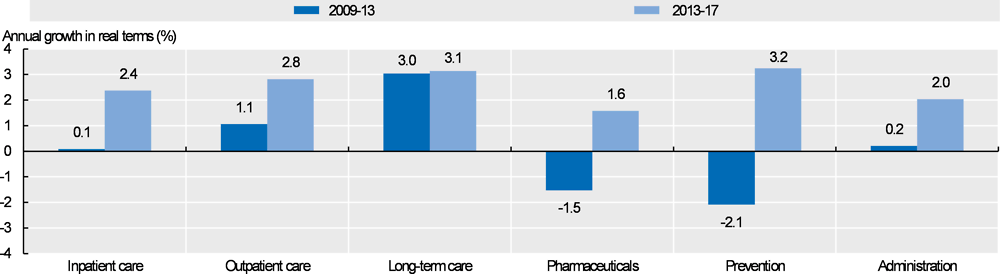
Source: OECD Health Statistics 2019.
Metadata, Legal and Rights
https://doi.org/10.1787/4dd50c09-en
© OECD 2019
The use of this work, whether digital or print, is governed by the Terms and Conditions to be found at http://www.oecd.org/termsandconditions.