
4. Work and Job Quality
This chapter addresses both the quantity of jobs and their quality – i.e. the material and non-material aspects of people’s working conditions. Since 2010, Work and Job Quality has generally improved across OECD countries: employment rates among adults have risen by 5 percentage points, and real earnings have increased, on average, by 7%, cumulatively. Long-term unemployment, the share of youth not in employment, education or training (NEET), labour market insecurity, the number of employees working long hours and job strain have each improved for the OECD on average – though not for all countries. Women are less likely to be employed and more likely to be long-term unemployed or NEET, relative to men. Men earn 13% more than women, but have higher rates of job strain and are more likely to regularly work long hours. Young adults and those without a tertiary education fare less well than older and more educated workers.
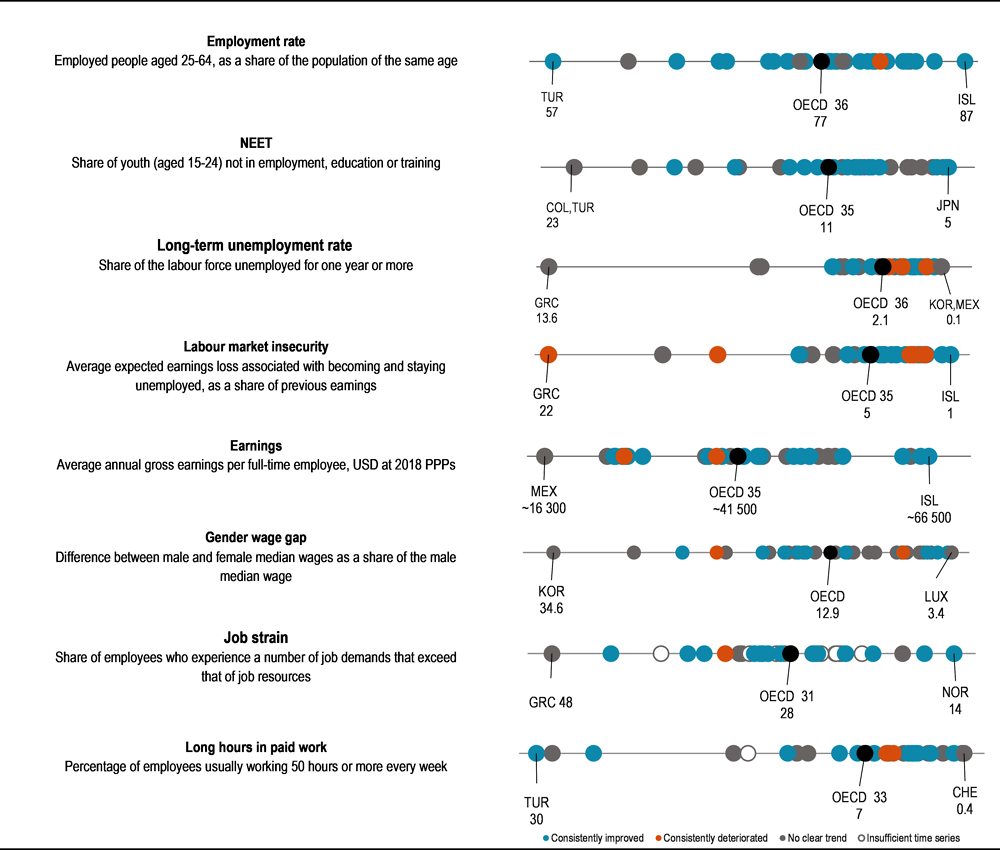
Note: The snapshot depicts data for 2018, or the latest available year, for each indicator. The colour of the circle indicates the direction of change, relative to 2010, or the closest available year: improvement is shown in blue, deterioration in orange, and no clear or consistent change in grey, and insufficient time series to determine trends in white. For each indicator, the OECD country with the lowest (on the left) and highest (on the right) well-being level are labelled, along with the OECD average. For full details of the methodology, see the Reader’s Guide.
Source: OECD calculations based on OECD Labour Force Statistics by Sex and Age – Indicators (database), https://stats.oecd.org/Index.aspx?DataSetCode=LFS_SEXAGE_I_R; OECD Transition from school to work (database), https://stats.oecd.org/Index.aspx?DataSetCode=EAG_TRANS; OECD Unemployment by duration (database), https://stats.oecd.org/Index.aspx?DataSetCode=DUR_I; OECD Average annual wages (database), https://stats.oecd.org/Index.aspx?DataSetCode=AV_AN_WAGE; OECD Indicators of gender equality in employment (database), https://stats.oecd.org/Index.aspx?DataSetCode=GENDER_EMP and OECD Job quality (database), http://stats.oecd.org/Index.aspx?DataSetCode=JOBQ.
On average, across OECD countries, 77% of the adult population (aged 25 to 64) is employed (Figure 4.2), ranging from 87% in Iceland to less than 60% in Turkey. Broadly speaking, employment is lower in southern European countries and in Latin America, and higher in northern and central Europe, Japan and New Zealand. Compared to 2010, in the aftermath of the crisis, the share of employed adults in the OECD has increased by 5 percentage points, with the largest increases occurring in Hungary (14 percentage points), followed by the Baltic States (around 10 percentage points). The share of employed adults is, however, still below its 2010 level in Greece and Brazil (by 4 percentage points).
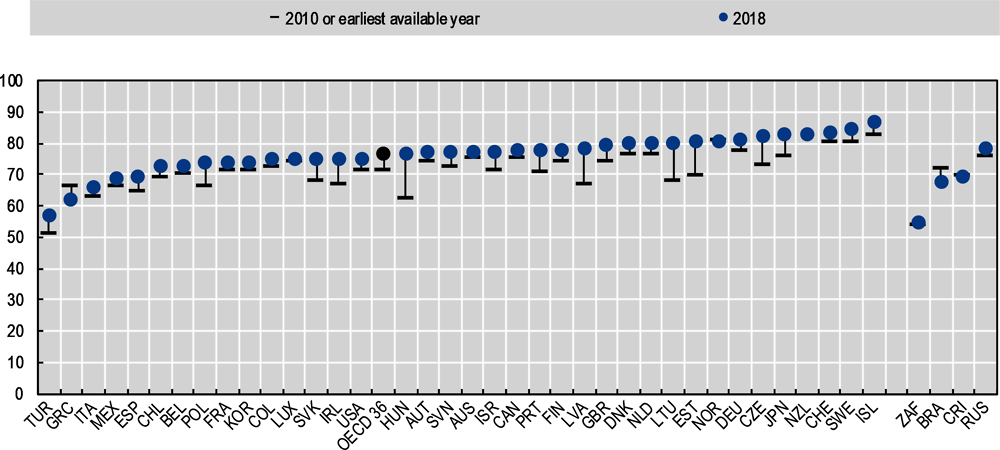
Note: The earliest available year is 2011 for Portugal, Germany and Brazil. The OECD average excludes New Zealand, due to breaks in the time series.
Source: OECD Labour Force Statistics by Sex and Age – Indicators (database), https://stats.oecd.org/Index.aspx?DataSetCode=LFS_SEXAGE_I_R.
The employment figures shown above exclude youths and young adults (aged 15-24), since many people in this age group are in full-time education or training. Thus, countries with high participation rates in upper secondary and tertiary education, or vocational study, are penalised when a 15-64 age range is considered for employment. Nevertheless, the availability of jobs for youths who are not in full-time study is an important issue. Across OECD countries on average, one youth in every 10 is not in employment, education or training (NEET) (Figure 4.3). Around 5% of youths in Japan and Iceland are NEET, but this contrasts with more than 20% in Turkey and Colombia. Compared to 2010, the NEET share has fallen by 2 percentage points on average across OECD countries. Much larger falls occurred in Latvia (by 11 percentage points), Greece (by 6 points), Ireland, Spain and Turkey (by 5 points). At the same time, the NEET rate remained stably high in Chile, and increased slightly in Colombia.
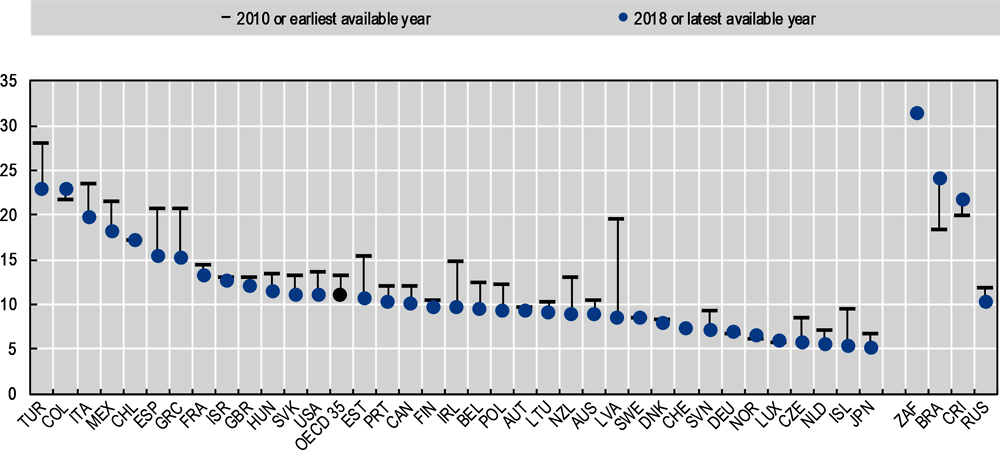
Note: The OECD average excludes Korea and Switzerland, due to incomplete time series.
Source: OECD Transition from school to work (database), https://stats.oecd.org/Index.aspx?DataSetCode=EAG_TRANS.
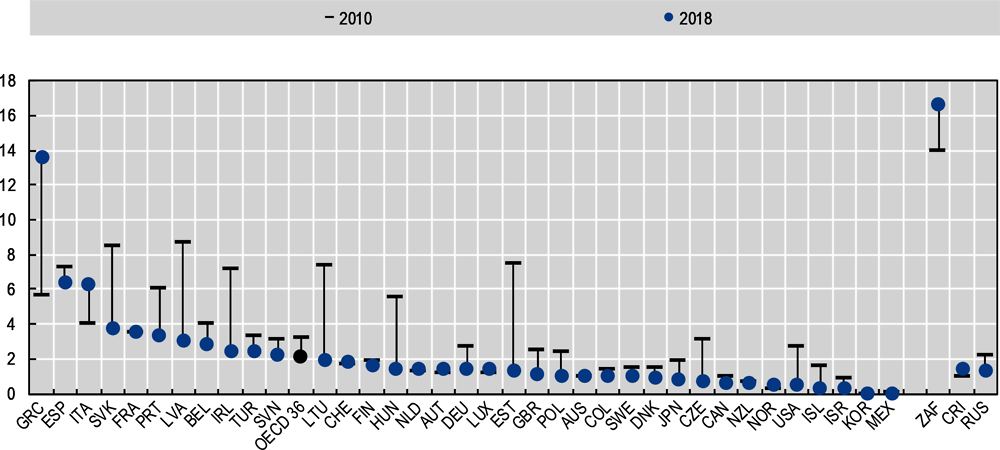
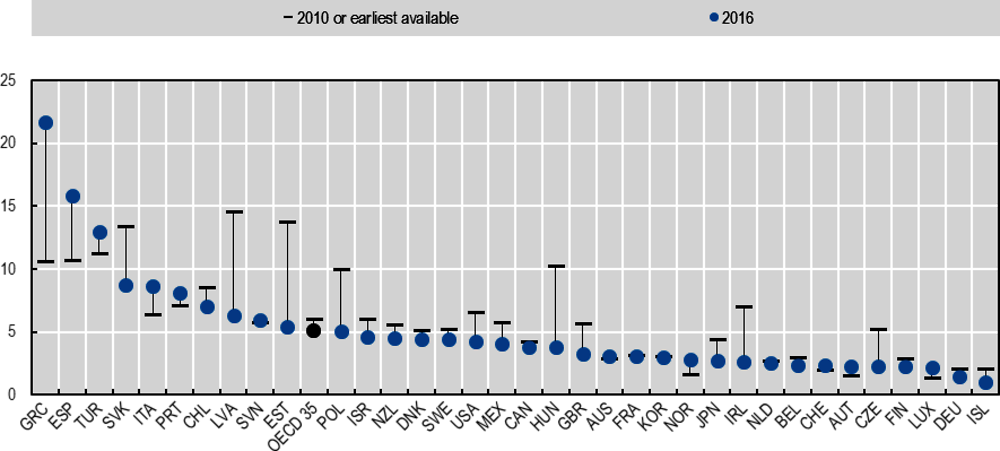
Long-term unemployment refers to people who have been out of work for one year or more, but who have been actively seeking employment within the last four weeks, and would be available to take up a job within two weeks. While most spells of unemployment tend to be short, long-term unemployment weighs heavily on the well-being of individuals and their families. On average, 2.1% of the total labour force in OECD countries have been unemployed for one year or more (Figure 4.4). The long-term unemployment rate is highest in Greece (at almost 14%) and South Africa (where it is almost 17%), while it is lowest in Mexico and Korea (close to zero). Compared to 2010, the share of people in long-term unemployment has fallen by about 1 percentage point for the average OECD country, with the largest falls (between 6 to 8 percentage points) recorded in the Baltic States and Ireland. The long-term unemployment rate has increased since 2010, however, in Greece (by 7 points), in South Africa (by 3 points) and in Italy (by 2 points).
The risk of job loss impacts all workers, albeit often unequally. On average across OECD countries, the expected monetary loss associated with becoming and staying unemployed, as a share of previous earnings, was around 5% in 2016 (Figure 4.5). This measure reflects both the risk of losing one’s job and the protections available in case this risk materialises, in the form of social programmes available to the unemployed. This figure ranged from 8% in southern Europe, the Slovak Republic and Turkey (and exceeds 20% in Greece), to just 2% in Iceland and Germany. Between 2010 and 2016, the OECD average measure of labour market insecurity fell by 1 percentage point, with much larger falls in Estonia, Latvia and Hungary (between 7 and 8 percentage points). However, over the same period, labour market insecurity increased in several countries with already high rates, including in Greece (by 11 percentage points), Spain (5.1) Italy (2.3) and Portugal (1). Although starting from a lower base, it also increased in Norway (by 1.2 percentage points).
Note: The earliest available year is 2011 for Germany, Portugal and Brazil. The OECD average excludes Chile, as data are not available.
Source: OECD Labour Force Statistics by Sex and Age – Indicators (database), https://stats.oecd.org/Index.aspx?DataSetCode=LFS_SEXAGE_I_R.
Note: The earliest available year is 2011 for Chile. The OECD average excludes Colombia and Lithuania, as comparable data are not available.
Source: OECD Job quality (database), http://stats.oecd.org/Index.aspx?DataSetCode=JOBQ.
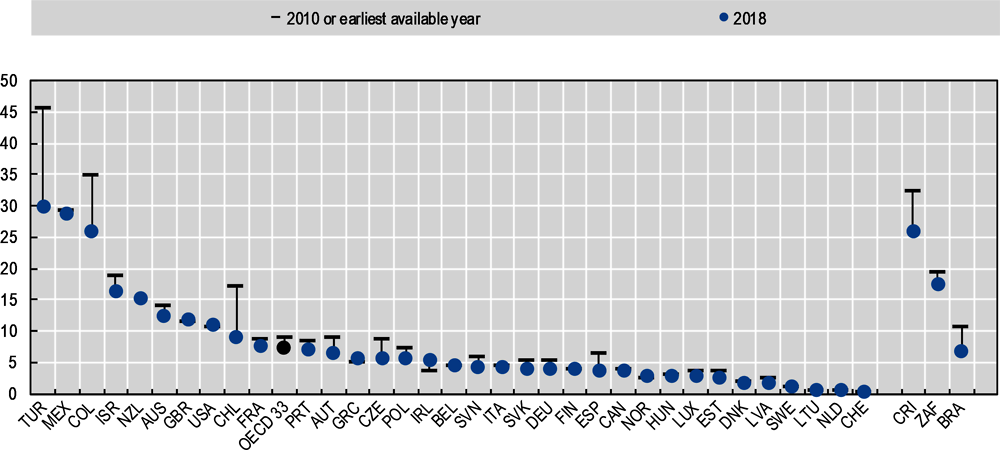
Earnings are an important component of job quality. The average annual gross earnings of full-time employees stand at USD 41 500 in the OECD (Figure 4.6), ranging from less than USD 20 000 in Mexico to more than USD 60 000 in Iceland, Luxembourg, Switzerland and the United States. Between 2010 and 2018, this earnings measure increased by 7%, cumulatively (about USD 2 700) in real terms, on average across OECD countries. The largest increases occurred in Iceland (by 45%), followed by the Baltic States and Poland (between 23% and 41%), while the measure declined the most in Greece (-15%), followed by other southern European countries: Spain, Portugal (-6%) and Italy (-3%).
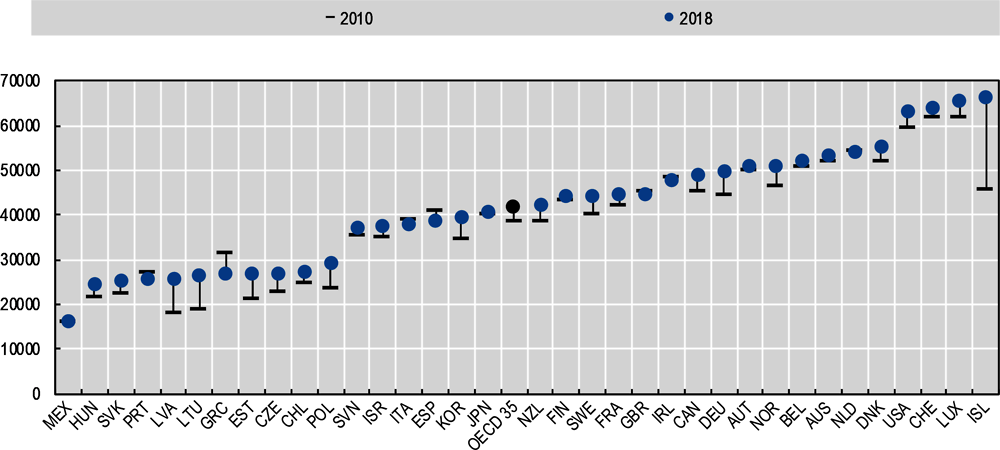
Note: The OECD average excludes Colombia and Turkey, as comparable data are not available.
Source: OECD Average annual wages (database), https://stats.oecd.org/Index.aspx?DataSetCode=AV_AN_WAGE.
The distribution of earnings within countries can be assessed by looking at the ratio between earnings at the 90th percentile (i.e. at the beginning of the top 10%), and those at the 10th percentile (i.e. at the beginning of the bottom 10%). On average across OECD countries, earners at the 90th percentile earn more than 3 times those at the 10th percentile (Figure 4.7). The ratio ranges from 5 in the United States and Israel, to 2 in Sweden and Italy.
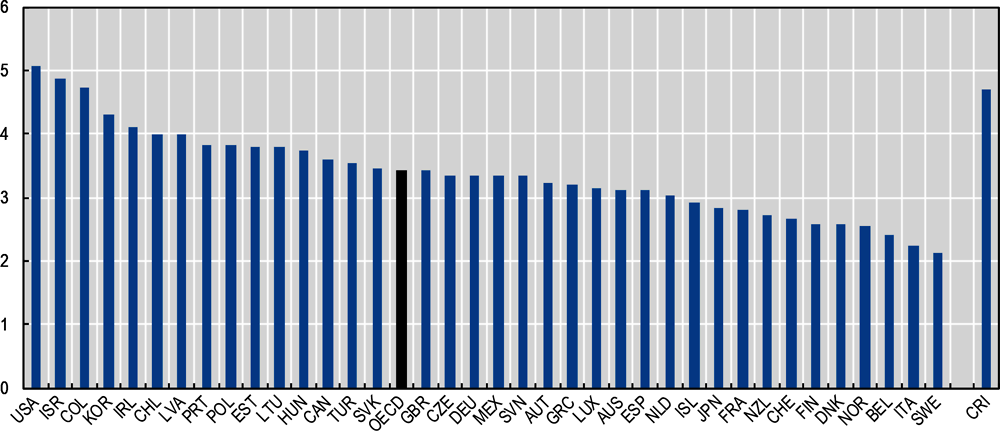
Note: The latest available year is 2018 for Australia, Colombia, the Czech Republic, Mexico, New Zealand, the United Kingdom and Costa Rica, 2016 for Belgium, Hungary, Iceland, Italy, Poland and Switzerland, 2015 for Norway, 2014 for Estonia, France, Latvia, Lithuania, Luxembourg, the Netherlands, Slovenia, Spain and Turkey, and 2017 for all the other countries.
Source: OECD Decile ratios of gross earnings (database), https://stats.oecd.org/Index.aspx?DataSetCode=DEC_I.
Full-time employees earning less than two-thirds of gross median earnings for all full-time employees are considered to experience low pay. Across OECD countries, on average, 15% of full-time employees experience low pay, ranging from 25% in Latvia and in the United States, to fewer than 5% in Belgium and Turkey.
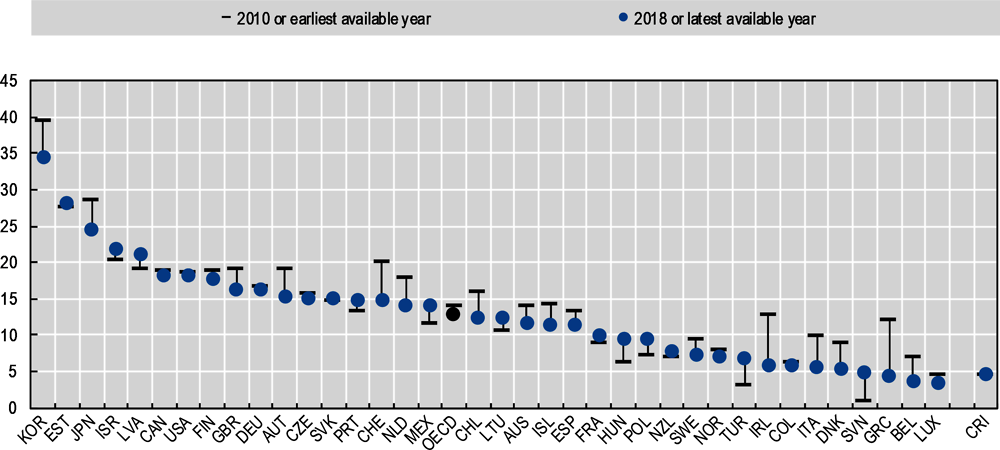
Job strain is about the quality of the working environment. It is defined as a situation where the job demands experienced by workers (i.e. physical demands, work intensity, inflexible working hours) exceed the resources available to them (i.e. task discretion, training, career advancement). On average, almost one-third of employees in OECD countries experienced job strain in 2015 (Figure 4.8). This share is generally higher in central and southern European countries (peaking at almost 50% in Greece), while affecting around 20% of employees in northern Europe and New Zealand. Between 2005 and 2015, the number of employees experiencing job strain fell by almost 8 percentage points on average across OECD countries, with the largest falls (between -15 and -16 percentage points) in northern and central Europe.
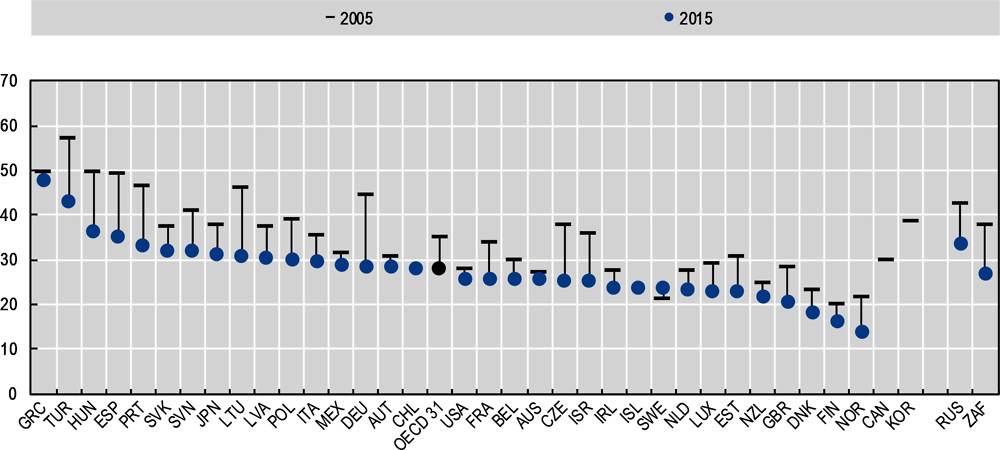
Note: The OECD average excludes Canada, Chile, Colombia, Iceland, Korea and Switzerland, due to incomplete time series. Data for Korea and Canada refer to 2005 only.
Source: OECD Job quality (database), http://stats.oecd.org/Index.aspx?DataSetCode=JOBQ.
Long hours spent in paid work can impinge on leisure time, personal care, and a person’s ability to contribute to unpaid work (such as housework and caring for family members) within a household. On average, around 7% of employees in OECD countries routinely work 50 hours or more each week (Figure 4.9). This rises to more than 25% in Turkey, Mexico and Colombia, but is almost zero in Switzerland, the Netherlands and Lithuania. Relative to 2010, the share of employees who spend long hours in paid work has fallen by 1.7 percentage point, on average, with much larger falls in Turkey (-16 percentage points), Colombia (-9) and Chile (-8). However, it increased slightly in a few countries, with the strongest increase (of 2 percentage points) occurring in Ireland.
Note: The earliest available year is 2011 for Portugal, Germany and Brazil. The OECD average excludes Iceland, Japan, Korea and New Zealand, due to breaks in the time series or incomplete time series.
Source: OECD Labour Force Statistics by Sex and Age – Indicators (database), https://stats.oecd.org/Index.aspx?DataSetCode=LFS_SEXAGE_I_R.
Work and Job Quality are generally better for men
Across OECD countries, men aged 25-64 are more likely than women of the same age to be employed (83% to 70%, respectively, on average). Gender differences in long-term unemployment are much smaller, but still favour men (2%, compared to 2.2% for women). When aged 15-24, young men are less likely to be NEET (not in employment, education or training) than young women (10% compared to 12%). Men’s hourly earnings are also 13% higher than women’s (Figure 4.10). When accounting for differences in working time, employment rates and the gender wage gap, men’s labour income overall is 40% higher than for women (OECD, 2018[1]). However, men are 20% more likely than women to experience job strain, and they are also more likely to spend long hours in paid employment (10% of male employees usually work 50 hours or more per week, compared to only 4% female employees). This contrasts with the pattern that emerges when both paid and unpaid working time are combined (see Reference Chapter 10 on Work-Life Balance), which shows women in OECD countries working 25 minutes per day longer than men, on average.
Note: The latest available year is 2018 for Australia, Colombia, Costa Rica, the Czech Republic, Mexico, New Zealand and the United Kingdom; 2016 for Belgium, Hungary, Iceland, Italy, Portugal and Switzerland; and 2014 for Estonia, France, Latvia, Lithuania, Luxembourg, the Netherlands, Slovenia, Spain and Turkey. The earliest available year is 2011 for Chile and Costa Rica.
Source: OECD Indicators of gender equality in employment (database), https://stats.oecd.org/Index.aspx?DataSetCode=GENDER_EMP.
Middle-aged adults enjoy more and better jobs
Across OECD countries, on average, young adults (aged 15 to 24) are 50% less likely to be employed than middle-aged adults (aged 25 to 54). They are also 20% more likely to be in long-term unemployment, 20% more likely to experience job strain, and their hourly earnings are 30% lower when compared to middle-aged adults. However, only 5% of young adults usually work 50 hours or more per week (compared to 8% of middle-aged adults). At the other hand of the age spectrum, older adults (aged 55-64) are 20% less likely to be employed than middle-aged adults, and 30% more likely to be long-term unemployed. However, when employed, their hourly earnings are 4% higher. Similarly to middle-aged workers, 27% of older employees experience job strain and 8% of them usually work 50 hours or more per week.
Tertiary-educated adults generally enjoy better Work and Job Quality
On average across OECD countries, adults aged 25 to 64 with less than an upper secondary education are 30% less likely to be employed than adults with a tertiary education. When employed, their hourly earnings are 40% lower; the share experiencing job strain is more than twice the rate among the tertiary educated; and they are more than three times as likely to be in long-term unemployment. By contrast, adults with an upper secondary education are almost as likely as adults with tertiary education to be employed – although their hourly earnings are 30% lower, and their incidence of job strain is 4 times higher. Adults with an upper secondary education are also 70% more likely to be in long-term unemployment, when compared to tertiary-educated adults.
Work refers to productive activity (whether paid or unpaid), and job quality is about both material and non-material aspects of people’s working conditions. This chapter focuses on paid work, and is complemented by the Reference Chapter 10 on Work-Life Balance, which also considers unpaid work. Material aspects of working conditions include issues such as remuneration (e.g. salary), the availability of jobs, and the risk of job loss. Non-material aspects relate to the quality of the working environment, measured through workers’ self-reports about their physical safety, the content of their job, how well this matches their skills and abilities, the autonomy afforded, their learning opportunities, working time arrangements (including the length of working hours and the possibility of working flexibly), and relationships with co-workers (such as the level of social support at work). Some, but not all, of these aspects of Work and Job Quality are reflected in the indicators used in this chapter (Table 4.1).
Employment rate refers to the share of the adult population (people aged 25 to 64) who report having worked in gainful employment for at least one hour in the previous week. It also includes persons who, having already worked in their present job, were temporarily absent from work during the reference period of the survey while having retained a formal attachment to their job (e.g. due to parental leave, sickness, or annual leave). The data come from national Labour Force Surveys (LFSs) as compiled in the OECD Annual Labour Force Statistics (ALFS) Database, and are consistent with the standards set by the International Conference of Labour Statisticians.
Long-term unemployment rate refers to the number of people who have been unemployed for one year or more, as a share of the labour force (i.e. the sum of employed and unemployed persons). Unemployed persons are those who did not perform any paid work in the survey reference week, but who actively searched for work within the last 4 weeks, and would be available to start work within the next 2 weeks. The data are drawn from national Labour Force Surveys, as available in the OECD Employment Outlook Database, and are consistent with the standards set by the International Conference of Labour Statisticians.
Youth not in employment, education or training (NEET) refers to the number of youth (i.e. people aged 15-24) who are not in employment, education or training, as a share of the population of the same age. The transition of younger individuals from education to working life varies with educational opportunities and social and economic contexts. In low-income countries, this indicator should be analysed in combination with the share of youth in vulnerable and informal jobs to better grasp the marginalization of young people on the labour market (ILO, 2015[2]). Education and training refer to courses currently being attended in the regular educational system, either during the previous four weeks or over a shorter period. Some OECD countries may include some people who are not classified as being in formal education, but who are in training (or education) for employment or for tertiary entrance examinations (OECD, 2017[3]). The data are compiled from National Labour Force Surveys by the OECD Labour Market and Social Outcomes of Learning Network though an annual questionnaire.
Labour market insecurity refers to the expected monetary loss that an employed person would incur upon becoming and staying unemployed, expressed as a share of previous earnings. This loss depends on the risk of becoming unemployed, the expected duration of unemployment and the mitigation against these losses provided by unemployment benefits (effective insurance). Data on unemployment duration are used to measure the probability of entering unemployment (people who report having been unemployed for 1 month or less are assumed to have been employed in the previous month), as well as the average expected duration of completed unemployment spells (in months). Unemployment insurance is calculated as the product of the coverage of unemployment insurance/assistance (the share of the unemployed who declare receiving an unemployment benefit) and (model-based estimates of) the replacement rates (the ratio of public transfers received by recipients of unemployment benefits and previous earnings). These replacement rates include benefits from unemployment insurance and unemployment assistance but exclude social assistance benefits; they are computed by averaging replacement rates for different configurations of earnings levels and family types. The indicator combines data from the OECD Unemployment Duration Database, the OECD Benefit Recipients Database, the OECD Labour Market Programmes Database and the OECD Taxes and Benefits Database.
Earnings refer to the average annual earnings of employees working in all sectors of the economy and in all types of dependent employment, expressed on a full-time and full-year equivalent basis. The earnings concept used, which is sourced from the National Accounts, includes employees’ gross remuneration (i.e. including employers’ social security contributions) before any deductions are made by the employer in respect of taxes, contributions to social security and pension schemes, life insurance premiums, union dues and other employee obligations. This value (“Wages and salaries”) is divided by the number of full-time equivalent employees in the economy (obtained by multiplying data on the number of employees by the ratio of hours worked by all employees and by those working full-time, in order to correct for the prevalence of part-time work). This indicator hence combines data from the OECD National Accounts Database, the OECD Earnings Distribution Database and the OECD Average Annual Earnings per Full-time and Full-year Equivalent Dependent Employee Database, which are based on data from the National Accounts, Labour Force Surveys, establishment/employer surveys, household income surveys and administrative registers from tax files. The gender wage gap and the risk of low pay indicator (deprivation) are calculated for full-time employees (not in full-year equivalent terms, as all the other indicators). Earnings are expressed in US dollars (USD) using purchasing power parities (PPPs) for private consumption.
Job strain considers the incidence of job strain among employees. Job strain is defined as a situation in which the job demands reported by employees (e.g. time pressure, and exposure to physical health risks) exceed their job resources (e.g. work autonomy, opportunities for learning and good workplace relationships). The data used to compute this indicator refer to three types of job demands (namely a) physical demands related to hard physical work such as carrying and moving heavy loads; b) work intensity, which relates to longer-than-average working hours; and c) working time inflexibility); and three types of job resources (namely 1) work autonomy, which includes workers’ freedom to choose and change their work tasks and methods; 2) training and learning opportunities, which include training and informal learning opportunities at work; and 3) perceived opportunity for career advancement, which is linked to workers’ motivation at work). Job strain refers to instances where employees report more job demands than job resources. As no single data source covers all OECD countries, the job strain index is obtained by combining data from the European Working Conditions Survey (EWCS) and the Work Orientations modules of the International Social Survey Program (ISSP).
Long hours in paid work refers to the share of employees (of all ages) whose usual working hours are 50 hours or more per week. The threshold is set at 50 hours because, after commuting, unpaid work and basic needs (such as sleeping and eating) are taken into account, workers routinely working more than 50 hours per week are likely to be left with very few hours (one or two per day) for other activities. Moreover, in countries where there is a regulation on maximum working time, this is generally limited to 48 hours per week. Data are sourced from national Labour Force Surveys and are broadly comparable across countries.
Correlations among Work and Job Quality indicators
There are moderate-to-strong correlations among many of the Work and Job Quality indicators (Table 4.2). The main exception is long hours in paid work, which has a strong positive correlation only with the NEET rate (0.7) and a negative one with employment (-0.5). There is little evidence of a trade-off between job quantity and job quality: on the contrary, countries with better outcomes for job quantity (employment, long-term unemployment, NEETs) tend to also have better outcomes for job quality (earnings, labour market insecurity, long working hours, job strain).
Statistical agenda ahead
The current indicator set is aligned with the international concept of “decent work” (ILO, 2013[4]) and “job quality” (OECD, 2018[1]). However, it can be strengthened in a number of ways:
Broadening the frequency, timeliness and scope of job quality data in order to cover other dimensions and characteristics of the working environment. Missing elements include the relationships with co-workers (e.g. social support at work), organisational culture and workers’ motivation, as defined in the OECD Guidelines on measuring the quality of the working environment (OECD, 2017[5]).
Broadening the scope of job quality to better account for the self-employed (or more broadly, the informally employed). Methodological work on how to tailor the job strain indicator to the self-employed is currently ongoing (Cazes, Hijzen and Saint-Martin, 2015[6]).
Including a measure of job satisfaction: some national well-being frameworks include a measure of job satisfaction (i.e. Australia, Germany, Israel, Italy, Japan, Korea, New Zealand, the United Kingdom, Wales), but measures are not harmonised across countries.
Better accounting for the impacts of the digital transformation on work (e.g. platform work). An ILO-EU-OECD Technical Expert Group on measuring platform work was created in September 2019 to provide guidance on concepts and measurement approaches. The conceptual work by the Technical Expert Group will inform the pilot testing planned by several European Statistical Offices in the context of the Eurostat Labour Market Statistics Task Force.
The long-term unemployment indicator used here follows a relatively narrow definition – i.e. people who have been actively seeking work within the last 4 weeks, and who are available to take up work within 2 weeks. It thus excludes the long-term jobless who wish to work, but have not sought work recently (e.g. due to a perceived lack of suitable job opportunities). These “discouraged workers” form one component of the labour underutilisation indicator included in the Reference Chapter 15 on Human Capital.
References
[6] Cazes, S., A. Hijzen and A. Saint-Martin (2015), “Measuring and Assessing Job Quality: The OECD Job Quality Framework”, OECD Social, Employment and Migration Working Papers, No. 174, OECD Publishing, Paris, https://dx.doi.org/10.1787/5jrp02kjw1mr-en.
[2] ILO (2015), “What does NEETs mean and why is the concept so easily misinterpreted?”, ILO, Youth Employment Programme, https://www.ilo.org/wcmsp5/groups/public/---dgreports/---dcomm/documents/publication/wcms_343153.pdf (accessed on 4 October 2019).
[4] ILO (2013), Decent Work Indicators: Guidelines for Producers and Users of Statistical and Legal Framework Indicators, ILO Manual, https://www.ilo.org/wcmsp5/groups/public/---dgreports/---integration/documents/publication/wcms_229374.pdf (accessed on 23 August 2019).
[1] OECD (2018), Good Jobs for All in a Changing World of Work: The OECD Jobs Strategy, OECD Publishing, Paris, https://dx.doi.org/10.1787/9789264308817-en.
[5] OECD (2017), OECD Guidelines on Measuring the Quality of the Working Environment, OECD Publishing, Paris, https://dx.doi.org/10.1787/9789264278240-en.
[3] OECD (2017), OECD Handbook for Internationally Comparative Education Statistics: concepts, standards, definitions and classifications, OECD Publishing, https://doi.org/10.1787/9789264279889-en (accessed on 4 October 2019).