Chapter 2. The context of Argentinian agriculture
Argentina is an upper-middle income country well-endowed with natural resources and human capital. Its history of macroeconomic instability and volatility in policy orientations from open markets to import substitution has led to overall poor long-term economic performance. The main exception has been the agricultural sector which, despite policy impediments, has innovated and grown over the last two decades. Driven by higher international agricultural prices, Argentinian agriculture – in particular, in the extended Pampas region – has experienced a major structural transformation in production and productivity, in on-farm practices and technologies, and in its institutions and contractual arrangements. This has been reflected in large changes in the use of land and the portfolio of commodities in favour of soybean, and in the composition and destination of exports towards Asia. However, other agricultural production lags behind – notably that in regional economies (outside of the Pampas), including tobacco, cotton and fruits and vegetables.
2.1. An economy marked by the strength of the agricultural exporting sector
The Argentinian economy has been subject to many severe fluctuations and economic crises over the last decades. One hundred years ago, income per capita was 92% of the average of the 16 richest economies, while today is only 43% (Bolt and van Zanden, 2014[1]). Argentina’s low population density and abundant fertile land have contributed to its comparative advantage in agricultural commodities, exports of which were the basis of the high income per capita in the early 20th century. The tension between agricultural export growth and the development of a domestic industrial sector has been at the core of recurrent policy cycles that have been described as “stop and go” (Gerchunoff, 2016[2]).
After decades of trade openness from the end of the 19th century, Argentina suffered from the demand contraction of 1929 and began a more inward-looking cycle (OECD, 2017[3]). After World War II, import substitution policies to develop an industrial sector were deployed under a succession of military and civilian governments, until the return to democracy in the 1980s. Two episodes of hyperinflation occurred in 1975 and 1989-90, respectively. In the 1990s, the country opened again to trade with a currency pegged to the US dollar and reduced inflation; however, rising fiscal imbalances led to the 2001 debt default (Lence, 2010[4]).
In the period 2002-10, the economy grew, supported by rising commodity prices and despite the reintroduction of import restrictions and agricultural export taxes. However, growth stalled to virtually zero in the period 2009-14, with an overvalued fixed exchange rate, capital controls and trade restrictions. The new government, elected in November 2015, has taken important steps to correct various imbalances. It has done so through the abolition of capital controls and most export taxes, simplification of import procedures, and correction of the national statistics. In September 2018 a temporary tax on all exports was introduced to raise fiscal revenue.
Reflecting these decades of policy and economic volatility, trade as a percentage of GDP has also been erratic, falling from 36% in 2005 to 21% in 2016 (Table 2.1). Primary agricultural production represented 8% of the GDP in 2016, while the whole agro-industrial transformation sector was estimated to be 32% of GDP (Regúnaga and Tejeda Rodriguez, 2015[5]). Due to this high share of the agro-food sector in the economy in general and in exports in particular (64% in 2016), Argentina’s fiscal and external balances are highly sensitive to developments in this sector.
Total agricultural production in Argentina is dominated by extensive farming and the use of mechanisation and modern technologies in the Pampas. This explains one of the lowest shares of the agricultural sector in employment in the world: 2% in 2016. However, the extended agro-food and agro-industrial sector is estimated to provide 18-35% of total employment (Regúnaga and Tejeda Rodriguez, 2015[5]).
2.2. An upper-middle income country with high urban poverty
Argentina is the second largest country of Latin America, just after Brazil, at 2.78 million km2, and the fourth most populous (after Brazil, Mexico and Colombia) with a population of 44 million people, of which 92% live in urban areas1 (INDEC, 2010[8]; WDI, 2018[6]). Argentina is well-endowed with natural resources, including land for farming and water. The country is a federal constitutional republic and a representative democracy. The President is both the head of state and of the government. Presidential elections take place every four years, with the possibility of one re-election. Argentina is a federation of 23 provinces and the autonomous city of Buenos Aires. Provinces are further divided into 512 departments and 2 164 municipalities (INDEC, 2017[9]).
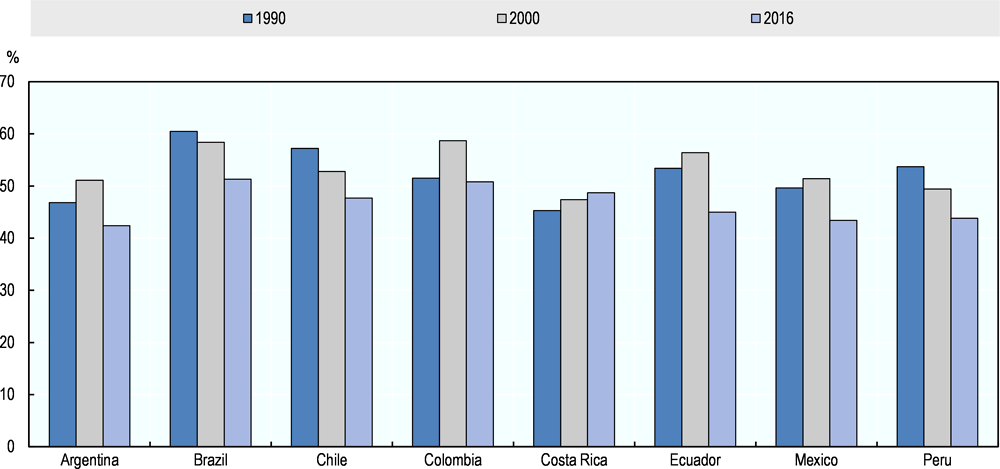
With a GDP per capita of USD 18 489 [PPP 2011] Argentina is an upper-middle income country (WDI, 2018[6]). In terms of income distribution, it has similar level of inequality as the rest of Latin America, with a Gini coefficient of 43% in 2016, and has participated in the region’s decreasing trend (with the exception of Costa Rica). The country nonetheless compares unfavourably to OECD standards (31.6% in 2012).
Note: 1990 or closest available year.
Source: World Development Indicators of the World Bank (WDI, 2018[6]).
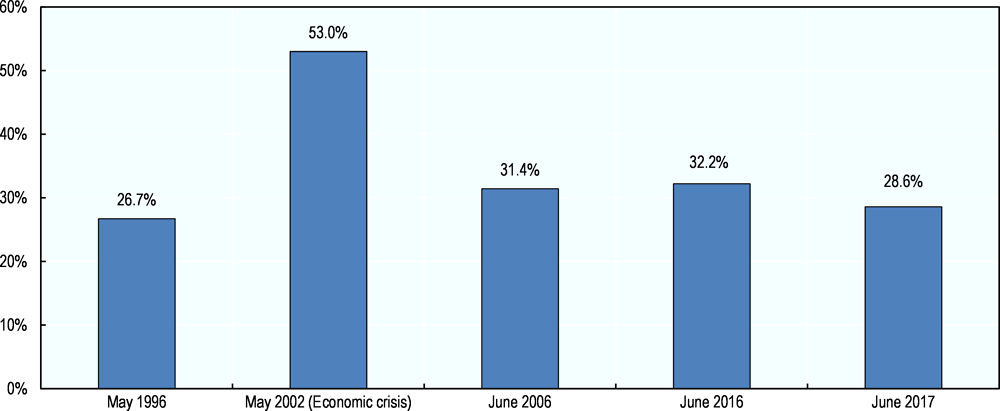
The incidence of extreme poverty measured as the percentage of the population (headcount ratio in urban areas) living under the USD 1.90 a day (2011 PPP) poverty line is very small, at 1.7% in 2014 (WDI, 2018[6]). However, according to the national poverty line2, almost a third of the population is considered to live in poverty in urban areas: 32.2% in 2016 and 28.6% in 2017. Despite these relatively high rates, the country has witnessed progress in reducing poverty in recent years (INDEC, 2017[9]). The rate of the national poverty line reached its highest level (53% in 2002) in the years after the financial and economic crisis of 2001 (Figure 2.2). Contrary to Latin American countries, rural poverty is relatively low; most poverty is located in urban areas (INDEC, 2017[9]); (Ministerio de Agroindustria, 2018[10]).
Source: (INDEC, 2017[12]).
Argentina has relatively high standards of human development in terms of human capital, education, health, housing and security compared to other countries in the Latin American region. In 2016, the country ranked 45th on the UNDP Human Development Index, the only country in the region apart from Chile (ranked 38th) in the category of “very high human development” (UNDP, 2017[11]). Over the years, the Argentine government has demonstrated sustained commitment to the provision of basic public services. For instance, public spending on health amounted to 2.7% of GDP in 2014 (WDI, 2018[6]); average life expectancy at birth was 76.5 years in 2015 (UNDP, 2017[11]); and access to electricity is approximately 99% (WDI, 2018[6]).
The country also has high literacy rates and full school enrolment for primary education, with literacy rates of 98% for ages of 15 and above (WDI, 2018[6]). Furthermore, around 58% of the rural population has at least seven years of schooling; at the national level (urban and rural) this figure rises to 86% of the population (INDEC, 2010[8]). Public expenditure on education was around 5.3% of GDP in 2014 (WDI, 2018[6]). Argentina’s well-educated labour force in agriculture, with an average of 12 years of schooling, has been and remains an important factor for the development of the sector (Ministerio de Agroindustria, 2018[10]). A 2012 survey from Austral University estimates that in the Pampas region 70% of producers were younger than 55% and 37% had a university degree (Feeney et al., 2012[12]).
2.3. Dynamic grain and oilseed production but other sectors lagging
There has been significant growth in crop production, particularly cereals and oilseeds, over the last 30 years in Argentina. This growth has been driven not only by improvements in productivity for the main crops (i.e. soybeans, maize and wheat), but also by an increase in land devoted to cereals (Figure 2.3). Some of this increase has come from changes in land use (e.g. pastures for beef production) while some is from an expansion of the overall area devoted to agriculture.
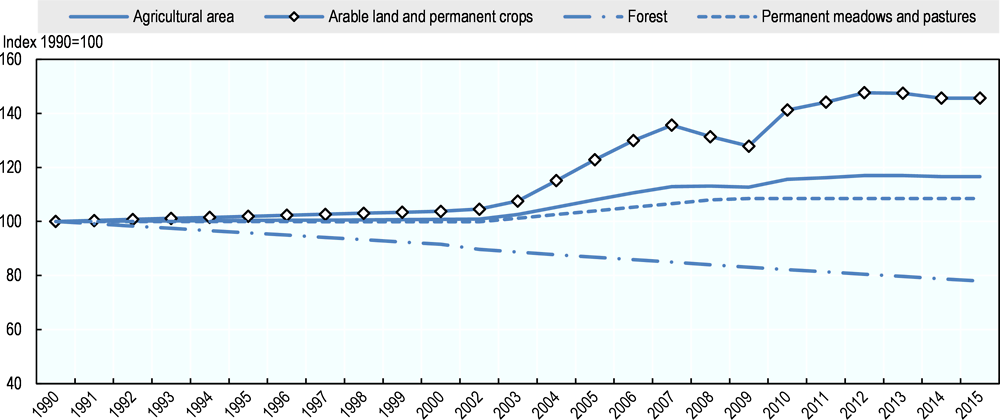
Source: Land Use Data (FAOSTAT, 2018[13]).
Land used for the production of soybeans has seen the biggest change, from 2 million in 1980 to 20 million hectares in 2017, followed by maize, from 3.3 to 8.4 million hectares during the same period. The impressive growth of crops is also reflected in production: soybeans increased from 3.5 to 55 million of tonnes in the period 1980-2017, and maize also experienced a large increase, from 6.4 to 49.5 million tonnes (Figure 2.4.A).
Livestock production has also experienced growth. For example, poultry increased from 335 720 tonnes in 1990 to 2 055 000 tonnes in 2016 Figure 2.4.B). Pigmeat also saw a significant increase: from 140 548 tonnes to 522 429 tonnes over the same period. Bovine meat, on the other hand, experienced a significant decrease in recent years, from 3 007 000 tonnes to 2 643 000 tonnes between 1990 and 2016. This decrease was due to a reduction in the number of animals, resulting from policies such as an export ban, taxes and macroeconomic policy uncertainty. These policies discouraged domestic livestock production and favoured crop production, which has shorter cycles and requires less upfront investment.

Source: (FAOSTAT, 2018[13]).
Figure 2.5 shows the contribution of leading products to the value of agricultural production. Soybean is the first commodity and has experienced an increase in its contribution in the last two decades, but recent evidence suggests a partial reversal of this trend since 2016.
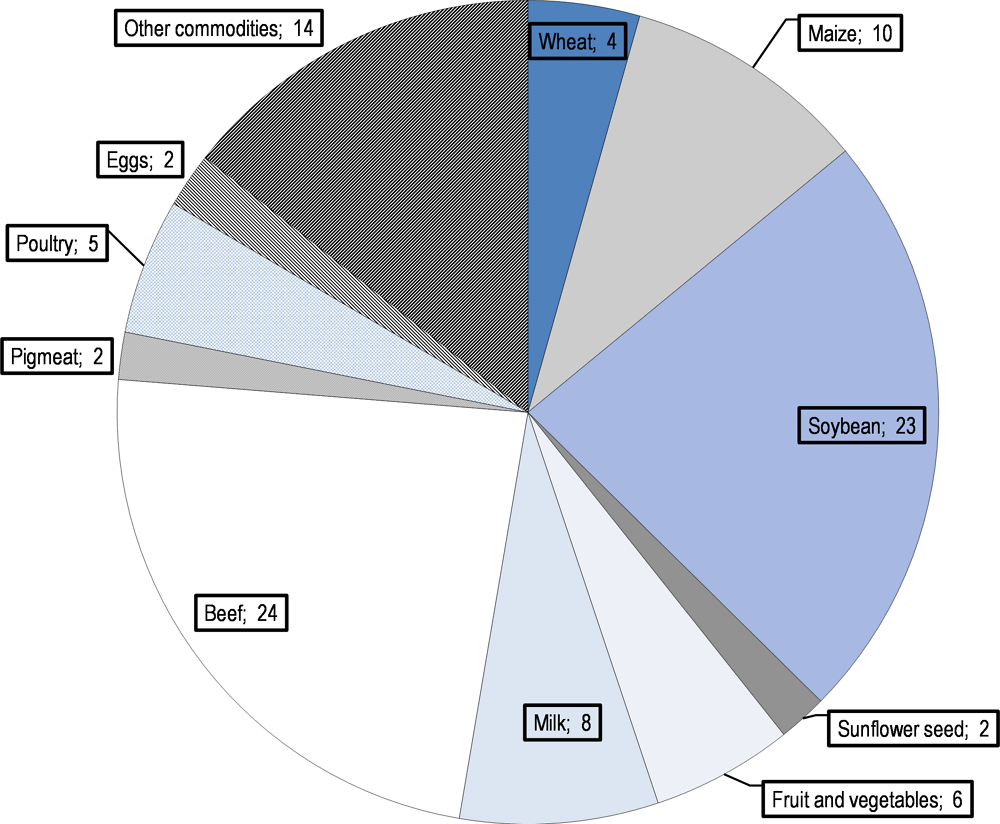
Source: OECD (2018), “Producer and Consumer Estimates”, OECD Agriculture Statistics Database.
The Total Factor Productivity (TFP) of agriculture has grown in Argentina at an average annual rate of 1.4% over the last twenty years. This rate is less than half that of Brazil and below the performance of Chile and the United States (Figure 2.6A). That said, it is in line with productivity growth across the Southern Cone countries and that of Australia. The use of inputs on agricultural production also increased at 1.4% on average, adding to a total growth of agricultural production of 2.8% in the last two decades. However, the rates of production growth and TFP growth have decelerated in the last ten years compared to the previous decade.
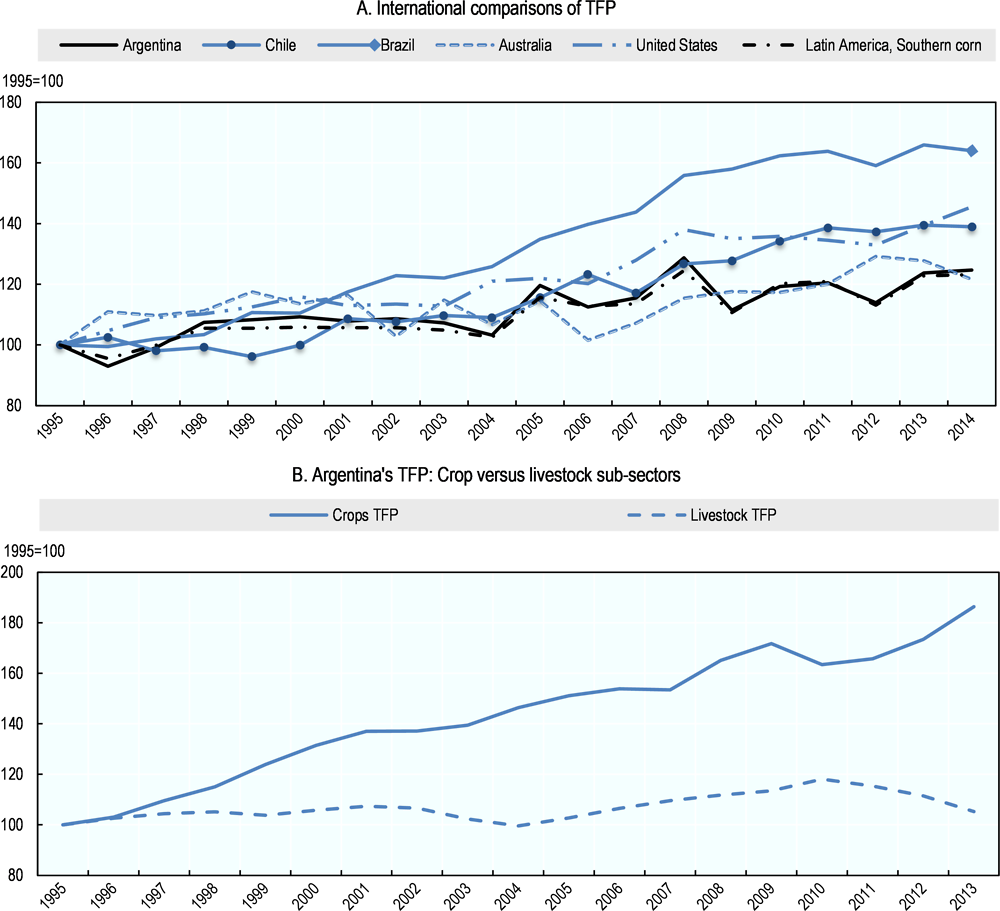
Source: International Comparisons from (Fuglie, 2012[17]); Argentina’s crops and livestock (Lema, 2015[18]).
According to estimations by the World Bank (Lema, 2015[14]) this total productivity growth hides significant differences between plant and animal products. Productivity growth in plant products has been higher than 2% over the last two decades, above that of other countries in the Southern Cone, while animal production and overall TFP were well below 1% on average (Figure 2.6.B).
This differentiated behaviour of TFP, with high increases in crops and stagnation in livestock, reflects the duality of innovation in Argentina’s agriculture. New technological packages for production systems – including GMO seeds, no-till farming and increased use of pesticides – have rapidly been adopted in crop production in the Pampas, together with large-scale contract farming; meanwhile, livestock and other regional products have not encountered a similar situation.
2.4. A changing export profile and participation in value chains
In 2016, Argentina exports were valued at 10.6% of GDP and its imports at 10.2%. The agro-food trade surplus is almost as large as the deficit in non-agricultural trade (Figure 2.7). The role of the agro-food sector is crucial as a source of foreign exchange earnings. The value of agro-food exports tripled between 2002 and 2017, driven by high world prices and increased output. Agrofood exports accounted for more than 60% of total exports in 2017.

Note: Agro-food trade includes fish and fish products.
Source: Comtrade Database (UN, 2018[7]).
The bulk of the increase in exports was soybean (beans, oil and cake), maize and wheat. Oil cake and soybean-related exports were almost 50% of all agricultural exports in 2015-17. Other significant export products are maize, wheat, fruits and vegetables (fresh and prepared), followed by bovine meat and wine (Figure 2.8). According to the OECD Agricultural Outlook, bovine exports are likely to grow in the upcoming decade (Box 2.1). However, there may be risks associated with the duration and uncertainties in biosafety regulatory in main importing countries such as the European Union and China. The adoption of genetically modified crops and the use of certain agrochemicals are becoming a major concern in some countries and, if brought to labelling or biosafety legislations, may condition the seeds and inputs to be used and the functioning of the whole value chain in Argentina.
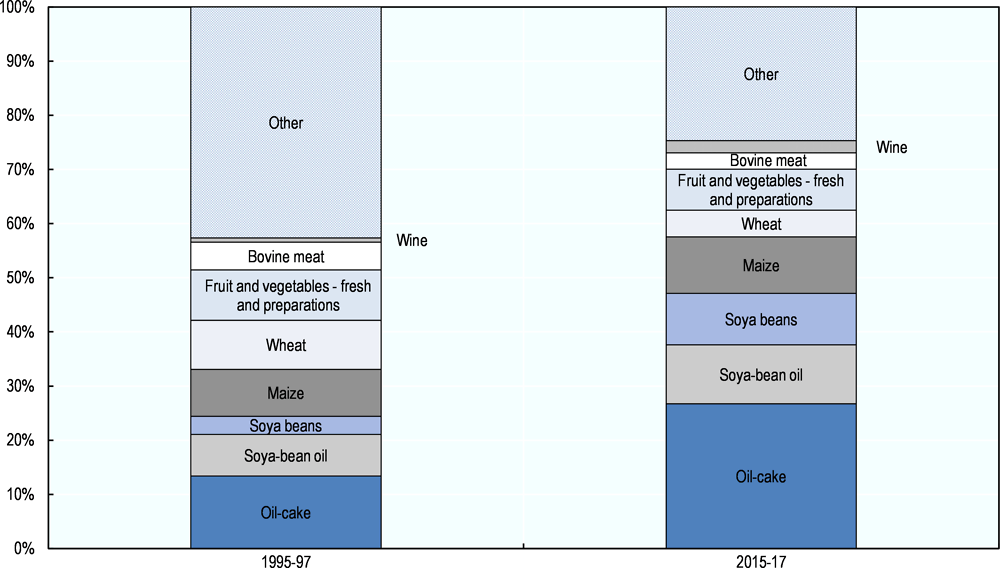
Source: Comtrade Database (UN, 2018[7]).
The Agricultural Outlook 2018-2027 is a collaborative effort of the Organisation for Economic Co-operation and Development (OECD) and the Food and Agriculture Organization (FAO) of the United Nations. The baseline projection is not a forecast about the future, but rather a plausible scenario based on specific assumptions regarding the macroeconomic conditions, the agriculture and trade policy settings, weather conditions, longer-term productivity trends and international market developments.
The Agricultural Outlook projects that production in Argentina will increase faster than consumption. Consequently, exports will continue to grow as for the Americas as a region. More and more of these exports are destined towards Asia and Africa.
In the case of Argentina, the annual growth rate of major crops, soybeans, maize, wheat and barley (other coarse grains) will be smaller than over the last ten years. Area planted of major crops will expand at slower pace. In case of sunflowers (other oilseeds), area planted will increase in contrast to a declining trend over the past decade. Crushing of soybeans and other oilseeds is projected to grow at a faster rate than production, enhancing the effect of domestic processing.
Poultry and pigmeat production will continue to grow fast but at lower rates than over the previous decade. In contrast, beef and milk production are projected to grow considerably fast in the coming decade, reversing years of decline. Milk production remained almost constant over the last ten years and will grow now considerably at 1.3% p.a. Thus, exports of especially whole milk powder (WMP) will expand rapidly. The turnaround in beef production is even stronger as it had been declining over the last ten years and a solid increase by 1.6% p.a. is projected forward. This will result in a considerable expansion of beef exports.
The underlying assumptions do not include any potential impact of the turmoil and policy changes during 2018. A stable policy environment is especially important for the ruminant production for export, as it requires access to international markets. In addition, normal weather pattern are assumed but as the crop year 2017/18 in Argentina has shown this may not be the case. Therefore, large uncertainties need to be attached to the projections in the Agricultural Outlook 2018-2027.
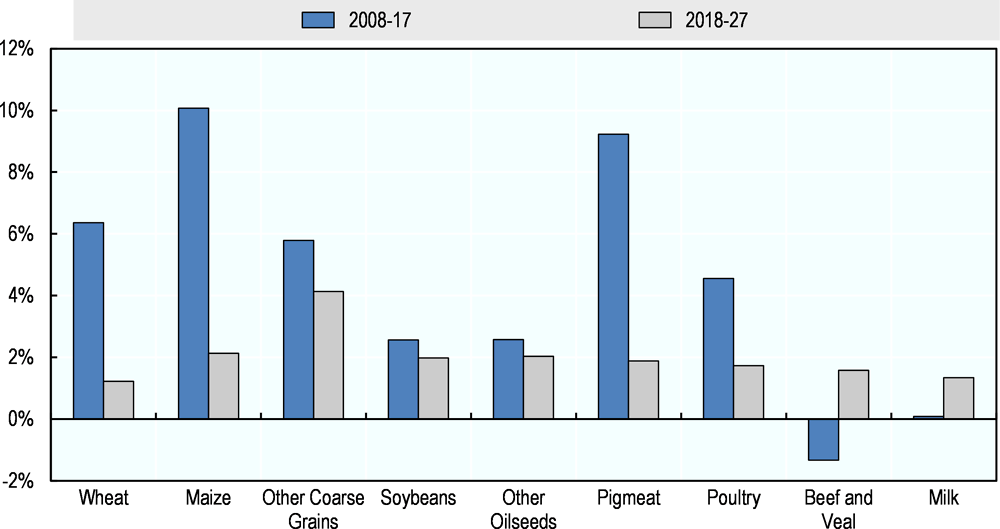
Source: OECD/FAO (2018), “OECD-FAO Agricultural Outlook”, OECD Agriculture Statistics Database.
The last two decades have also seen a marked change in the main destinations for agro-food exports. In line with a broader trend in Latin America towards a more intense trade and investment relationship with China (OECD/CAF/ECLAC, 2015[15]), the share of most OECD countries and of Brazil in Argentine exports has been reduced, while the share of Asian countries, in particular China but also Viet Nam and India, has significantly increased. China is now the primary market for Argentine agricultural exports (11.3%), well above Brazil at 8% (Figure 2.10). The countries in the European Union as a whole continue to be the first trading partner of Argentina, but their shares are falling.
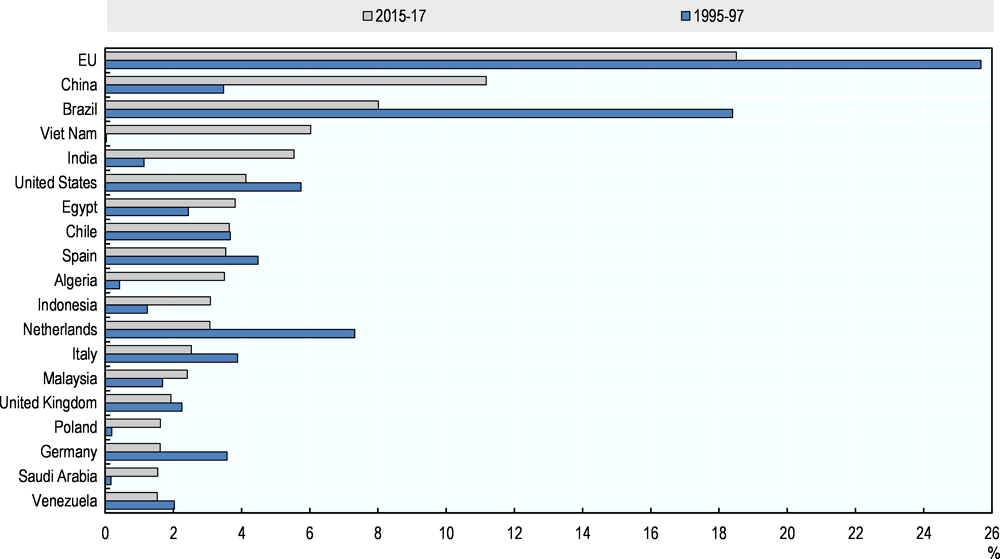
Notes: EU15 in 1995-97 and EU28 in 2015-17.
Source: Comtrade Database (UN, 2018[7]).
Argentina’s participation in general Global Value Chains across all sectors is low compared with other OECD and non-OECD countries. According to the OECD-WTO TiVA Database, in 2011 the total (forward plus backward) indicator of Argentina’s participation in GVCs was 30%, compared with an average of 48% in both developing and developed economies (WTO, 2017[16]). The backward indicator (participation by buying foreign inputs) was relatively lower than the forward indicators (participation by selling inputs for other countries’ exports). For the agricultural sector, backwards and forward GVC participation (10% and 14% respectively) is also low compared with other countries. For the food sector is even lower (Greenville, Kawasaki and Beaujeu, 2017[17]).
However, the value-added flows between Argentina’s agriculture sector and other domestic and foreign sectors is larger than what these indicators may seem to reveal. For instance, 44% of agricultural value added is coming from other domestic sectors, which represents a significant backwards linkage to domestic value chains; and 33% of agricultural value added is exported compared to 23% in Brazil and 32% in Chile (Table 2.2), which represents a significant forward linkage with foreign value chains. The degree of forward integration of Argentine agriculture on value chains is particularly high when considering both domestic and foreign markets. An additional 55% of agricultural value added ends in the production of other sectors in the country, which makes a total 88% share of value added entering longer domestic or global value chains – one of the highest shares in the world.
2.5. The farming sector is dominated by big farms in the Pampas region
No up-to-date information exists regarding the structure of the farming sector in Argentina; the last agricultural census dates from 2002 (Box 2.2). According to this, the total number of agricultural holdings in the country was 297 425, with an average size of around 588 hectares (Table 2.3).The average size of farms devoted to grains tends to be higher, at 2 000 hectares, while farm size for land used for fruits and vegetables is relatively smaller, at 30 hectares.
Land ownership is generally high: almost 99% of all farm area is under the private system of land tenure, and property rights are secure. In 2002, around 74% of land in production was worked by the owner, and 11.5% was considered to be rented. The remainder was accounted for by other arrangements, including sharecropping.
The quality of Argentine statistics deteriorated over 2007-15. The frequency and quality of underlying censuses, surveys and procedures declined and some data on inflation, GDP and poverty levels became unreliable. In July 2011, the IMF found Argentina to be in breach of its minimum reporting requirements because of its inadequate provision of Consumer Price Index (CPI) and GDP data (IMF, 2013[18]). Since 2016, the national statistics institute INDEC has been completely reformed and its leadership changed. Argentina is now working with the OECD to improve the quality of its statistics.
In the case of agricultural statistics relevant for this study, several areas have been affected by the absence or unreliability of statistical data. This is particularly the case for household data and farming surveys, but also for the Agricultural Census, which has not been updated since 2002. Information on the value of agricultural production is incomplete, food inflation data is not reliable, and no information is available on rural poverty and farm structures. Production and trade information is more reliable. But the only available structural information on the farming sector dates from 2002 and, given the dynamic transformation of the sector in the last two decades, it is likely to provide an inaccurate picture of the current situation.
References
[1] Bolt, J. and J. van Zanden (2014), “The Maddison Project: Collaborative research on historical national accounts”, The Economic History Review, Vol. 67/3, https://doi.org/10.1111/1468-0289.12032.
[13] FAOSTAT (2018), Food and Agriculture Data, Food and Agriculture Organization of the United Nations.
[12] Feeney, R. et al. (2012), Encuesta Sobre las Necesidades del Productor Agropecuario Argentino 2012, Centro de Estudios en Agronegocios y Alimentos, Universidad Ausral.
[2] Gerchunoff, P. (2016), ¿Por Que Argentina No Fue Australia?, Siglo Veintiuno, http://www.sigloxxieditores.com.ar/fichaLibro.php?libro=978-987-629-699-1 (accessed on 6 April 2018).
[17] Greenville, J., K. Kawasaki and R. Beaujeu (2017), “A method for estimating global trade in value added within agriculture and food value chains”, OECD Food, Agriculture and Fisheries Papers, No. 99, OECD Publishing, Paris, https://doi.org/10.1787/f3a84910-en.
[18] IMF (2013), Press Release: Statement by the IMF Executive Board on Argentina, http://www.imf.org/en/News/Articles/2015/09/14/01/49/pr1333 (accessed on 5 June 2018).
[9] INDEC (2017), Encuesta Permanente de Hogares, Instituto Nacional de Estadística y Censos, República Argentina.
[8] INDEC (2010), Censo Nacional de Poblacion, Hogares y Viviendas 2010, Instituto Nacional de Estadistica y Censos, Republica Argentina.
[14] Lema, D. (2015), Crecimiento y Productividad Total de Factores en la Agricultura: Argentina y Países del Cono Sur 1961-2013, World Bank, Washington, DC.
[4] Lence, S. (2010), The Agricultural Sector in Argentina: Major Trends and Recent Developments, Iowa State University.
[10] Ministerio de Agroindustria (2018), Sector background information provided by the Ministry of Agroindustry for the OECD Review of Agricultural Policies of Argentina.
[3] OECD (2017), OECD Economic Surveys: Argentina 2017: Multi-dimensional Economic Survey, OECD Publishing, Paris, https://doi.org/10.1787/eco_surveys-arg-2017-en.
[15] OECD/CAF/ECLAC (2015), Latin American Economic Outlook 2016: Towards a New Partnership with China, OECD Publishing, Paris, https://doi.org/10.1787/9789264246218-en.
[5] Regúnaga, M. and A. Tejeda Rodriguez (2015), Argentina’s agricultural policies, trade and sustainable development objectives, International Center for Trade and Sustainable Development (ICTSD).
[7] UN (2018), UN Comtrade database.
[11] UNDP (2017), Human Development Report, United Nations Development Programme.
[6] WDI (2018), World Development Indicators, World Bank, Washington, DC.
[16] WTO (2017), Trade in value-added and global value chains: Statistical profile of Argentina, https://www.wto.org/english/res_e/statis_e/miwi_e/countryprofiles_e.htm.
Notes
← 1. Urban refers to the population that resides in areas of 2 000 or more inhabitants; rural areas are, in turn, those with less than 2 000 inhabitants.
← 2. The national official poverty line is based on the cost of the basic needs. It consists of establishing whether households have the capacity to satisfy – through the purchase of goods and services – a set of needs both food as non-food (including: clothing, transportation, health, housing, education, etc.) considered essential (INDEC, 2017[9]).