Chapter 1. Trends and challenges: An updated snapshot of Småland-Blekinge
This chapter provides a diagnosis of Småland-Blekinge, identifying major trends, strengths and bottlenecks to development. It first explores how conditions have changed since the 2012 Territorial Review of Småland-Blekinge, including population and demography, economic performance and inter-regional disparities. Following this, it examines some of the main factors of growth and bottlenecks to development including: accessibility, mobility and digitalisation; innovation; and human capital and skills.
In 2012, the OECD published the Territorial Review of Småland-Blekinge, Sweden.1 Building on the evidence-based analysis of regional policies, the report provides 12 recommendations and 32 sub-recommendations to the region and its 4 counties (OECD, 2012[1]). The review highlighted the need to:
-
Shift towards higher value-added industries and businesses and to focus more on knowledge-intensive production.
-
Adopt programmes to help to strengthen the links between the regional education system and the private sector.
-
Enhance its supports for entrepreneurship and, more generally, make better use of the region's many assets in order to improve its attractiveness to residents and migrants alike.
This Monitoring Review of Småland-Blekinge follows up the recommendations made in the earlier 2012 review. The objectives of the review are to: i) assess the main regional policy changes since 2012 and the extent to which the recommendations from the territorial review have been implemented; and ii) examine the processes of recent migrant settlement and integration in Småland-Blekinge and offer a number of recommendations.
Between 2012 and 2017, some conditions in the region have changed substantially. The four counties of Småland-Blekinge were negatively impacted by the 2007 financial crisis. However, the economy has rebounded over the past five years and the counties are now recording positive economic and employment growth. These changed conditions impact how the counties work together with municipalities and private and third sectors to address the common challenges of growing labour market demand and housing shortages in some areas. A second change is that there have been administrative mergers at county-level in Jönköping and Kronoberg wherein competencies for regional development have been incorporated directly elected county council structure. Blekinge and Kalmar are expected to adopt a similar structure in 2019. Finally, over the past five years, Småland-Blekinge has also seen an unprecedented population increase, fuelled by a rise in migration, mostly from asylum seekers and refugees. The four counties recorded among the highest net migration rates per capita in Sweden during this period. The pace at which newcomers have arrived in Småland-Blekinge has challenged the region to provide suitable housing and to reorient services and develop new ones to meet the needs of this diverse group. Migrant integration and retention in the region will be critical for its future development. This monitoring review dedicates a special focus chapter on migration.
The OECD team, together with international experts as peer-reviewers, carried out an official mission in 24-27 October 2017 to evaluate progress in the four counties of Småland-Blekinge. The OECD team held bilateral interviews with public officials from the four counties and from selected municipalities as well as with actors from the private sector and public research institutions to understand challenges and bottlenecks and assess progress in implementing recommendations.
The structure of this review is organised as follows:
-
The present Chapter 1 introduces the methodology and evolving context in the four counties since the elaboration of the territorial review.
-
Chapter 2 assesses progress in each of the 12 recommendations. It offers a summary of progress and a detailed analysis of the changes promoted. It also indicates how the four counties can continue making progress in these areas. It is complemented by the detailed table of Annex 2.A, which tracks down progress in each of the 32 sub-recommendations.
-
Chapter 3 examines the processes of recent migrant settlement and integration in Småland-Blekinge and offers a number of recommendations. Inclusion and equal access to opportunities is a major aim of the migrant integration in Sweden and achieving these goals requires the different levels of government to work together – local, regional and national.
Adjusting to new conditions
Småland-Blekinge is evolving under a different scenario than the one in 2012 when the OECD conducted the territorial review of the region. There are several differences to note: i) ongoing waves of administrative mergers at county-level; ii) arrival of a large number of humanitarian migrants; and iii) a different macroeconomic context after the effects of the global financial crisis.
The merger of the regional council and the county council in the four counties of Småland-Blekinge happened after the former regionalisation reform plans were abandoned. The regionalisation reform was one of the main motivations of the county authorities for carrying out the territorial review of Småland-Blekinge in 2012, but in 2017, it is no longer in the agenda. Instead, the current project of mergers has been developed to bring together two administrative institutions that, despite sharing common responsibilities, differ in purpose and organisational culture to at a large extent.
The merger process has been finalised in the counties of Jönköping and Kronoberg, and it is expected to commence in Blekinge and Kalmar Counties in 2019 after the next regional elections take place. No set system, configuration or process is uniformly implemented in order to carry out these fusions; each county is to use trial and error in order to adapt the process to their own specificities. Given that both Jönköping and Kronoberg have reported difficulties, systematically documenting these difficulties may ease this transition process to Blekinge and Kalmar Counties. Likewise, identifying pitfalls and best practices from other Swedish and OECD countries may prove useful to ensure that this new governance structure works at its best.
The second major change – a wave of humanitarian and family reunification migration – has challenged the four countries to quickly build internal capacity to receive newcomers and provide settlement and integration services. While a great deal of progress has been made in a short amount of time, there remains a need to take stock of what has worked or not in the intervening period and to continue to build capacity and partnerships among the various actors supporting migrant settlement and integration. The counties’ experiences and policy recommendations on how processes could be improved form the subject of Chapter 3.
The macroeconomic context differs significantly than the one from 2012. In that time, only timid signs of recovery from the 2007 financial crisis could be observed – especially as the data analysis referred to the period from 2008 and 2009. Since then, the four counties of Småland-Blekinge have experienced a climate of economic recovery and have been expanding their economic base.
An evolving national context
According to the recent OECD Economic Survey of Sweden (OECD, 2017[2]), Sweden weathered the global financial and economic crisis with limited damage, thanks to strong macroeconomic, fiscal and financial fundamentals, as well as a competitive and diversified business sector. Output has grown faster than in most other OECD countries over recent years (Figure 1.1, Panel A). Population increases, to a large part related to immigration, have contributed significantly to growth. Even so, the country’s gross domestic product (GDP) per capita has expanded faster than in most OECD countries (Figure 1.1, Panel B). Business investment has picked up, which has contributed to reviving labour productivity, now increasing rapidly. Employment has also increased more rapidly than in most OECD countries over recent years, and the unemployment rate has receded and is now around 7%. In a weak global environment, Sweden’s growth has been primarily driven by strong domestic consumption and investment. The trend of growth is expected to remain solid over the coming years.
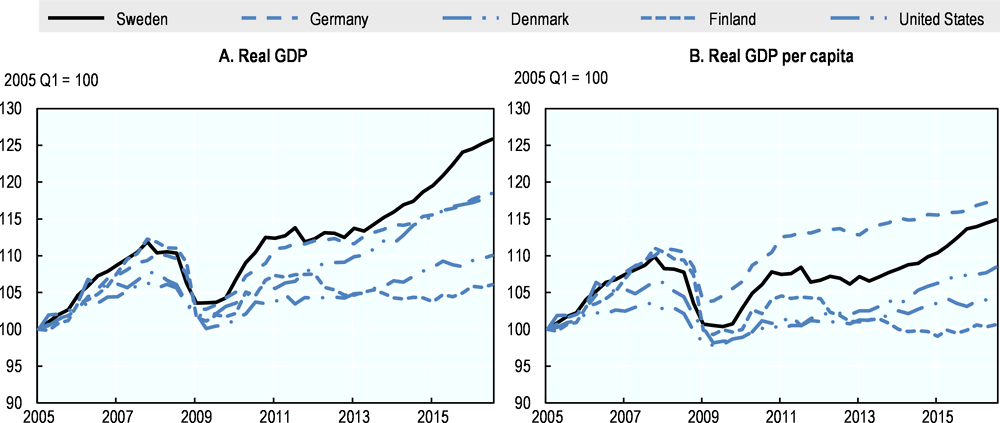
Source: OECD (2018[3]), Economic Surveys: Sweden 2017, OECD, Paris.
Over the past two decades, inclusive, sustainable and green growth has underpinned a high quality of life for Swedes. The country has welcomed a large number of immigrants, which have both contributed to and benefitted from economic prosperity. The foreign-born accounted for over 16% of the population in 2015, up from 10% in 1993 at the low point of the early-1990s recession. The country faces challenges of integrating foreign-born, which are less likely to be employed, often earn less and work in occupations with lower status than natives with similar education.
The areas of relative weakness highlighted by the Better Life Index and identified in previous OECD Economic Surveys include:
-
Housing market which penalised households with low income and wealth, leading to a widening of inequalities despite remaining relatively low.
-
Rigidities in the labour market, hampering access to jobs for the low-skilled and putting pressure on inequality.
-
Declining educational performance.
-
Persistent gender gap, particularly for foreign-born women, despite Sweden being one of the most gender-equal countries in the OECD.
Sweden has maintained a high level of performance in science, technology and innovation (STI) but there are signs of weakening. As the OECD Review of Innovation Policy: Sweden 2012 (OECD, 2013[4]) observed, Sweden’s research performance has lost some ground vis-à-vis traditional comparators such as Denmark, the Netherlands and Switzerland, and a number of emerging economies are catching up fast. Business research and development expenditure has declined in the wake of the restructuring and change in ownership of large multinational enterprises of Swedish origin, which now have new global corporate strategies. Sweden’s overall research and development intensity is no longer the highest in the world.
Against this backdrop, the government introduced the Research and Innovation Bills of 2008 and 2012 aimed at strengthening the performance of the Swedish STI system. These include:
-
A significant increase in the “block funding” for universities and the introduction of a performance-based allocation mechanism.
-
Additional funding for selected Strategic Research Areas (SFOs); an enhanced role and funding for research institutes (RIs).
-
The development and funding of public-private partnerships within selected Strategic Innovation Areas (SIOs).
-
The initiation of a Challenge-driven Innovation (UDI) programme focusing on societal challenges.
-
Improved prioritisation and support for Swedish participation in European research and innovation activities.
These efforts have reached mixed results with limited success in strengthening the university research base, commendable efforts to link research and innovation with some concerns, a need for more concerted effort to tackle societal challenges and prioritisation and strategy development constrained by weak governance (OECD, 2016[5]). Despite these mixed results, Sweden remains one of the most innovative countries in the OECD with business research and development expenditure standing at 2.31% of GDP well above the OECD average (Figure 1.2). Government research and development expenditure also stands above the OECD average with a large share allocated for research to Swedish universities, well placed in global rankings of world-class universities and publications. Higher education research and development, at 0.92 in 2014, is amongst the highest in the OECD (OECD, 2017[6]).
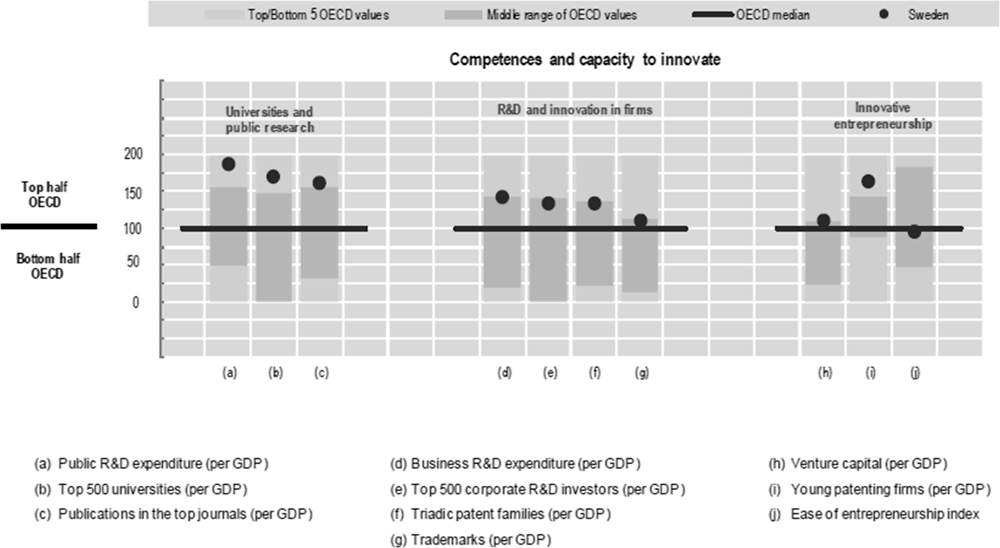
Note: Normalised index of performance relative to the median values in the OECD area (Index median=100).
Source: OECD (2016[7]), “Sweden”, in OECD Science, Technology and Innovation Outlook 2016, https://doi.org/10.1787/sti_in_outlook-2016-88-en.
Population and demography
Settlement patterns and population dynamics
The population in Småland-Blekinge amounted to 948 117 people in 2017, which is equal to 9.5% of Sweden’s population, with the largest share of inhabitants living in Jönköping (352 735), followed by Kalmar (242 301), Kronoberg (194 628) and Blekinge (158 453).
Overall, the population in Småland-Blekinge increased annually on average by 0.33% between 1968 and 2016 against 0.58% in Sweden. The population dynamics show a relatively flat trend from 1970 to 2011 and a significant increase since 2011 (Figure 1.3). Over this latter period (since 2011), the increase amounted to 0.89% annually, below the average in Sweden (1.23%) – primarily driven by Stockholm (2.09%) – but slightly above the un-weighted average of Swedish counties (0.88%). Amongst the 4 counties from Småland-Blekinge, Kronoberg experienced the highest annual growth (1.16%) adding 10 688 inhabitants over 2011-17 and Jönköping experienced the highest absolute growth (15 869). This rise in population is primarily driven by an increase in migrants (see next section and also Chapter 3).
The population growth was highly concentrated in a few municipalities. Only 4 municipalities, Habo, Jönköping, Kalmar and Växjö out of the region’s 39 municipalities contributed to 46% of the net population growth (39 498) in the region during 2011-16. In total, 19 municipalities recorded population declines over the 1991-2016 period (Figure 1.4). The municipalities experiencing population growth were, in general, the largest and most densely populated in the region and home to almost half its population.
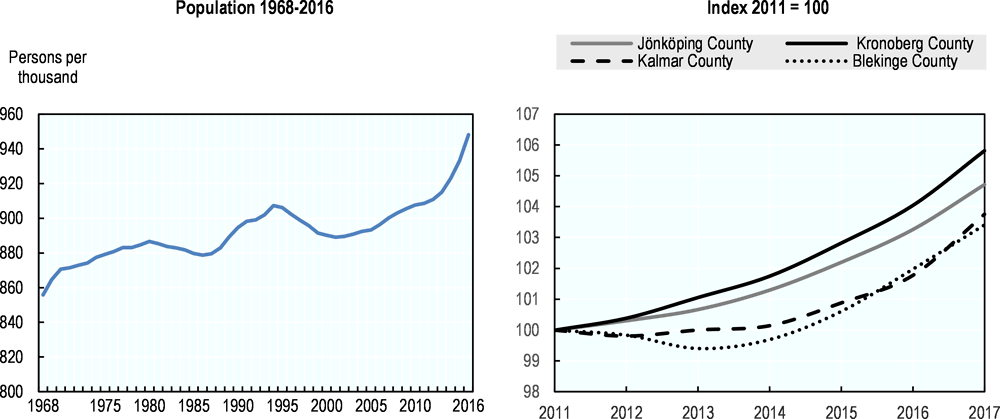
Sources: Statistics Sweden, (2018[8]), Befolkningsstatistik i Sammandrag 1960-2016 [Population Statistics in Summary 1960–2016], https://www.scb.se/hitta-statistik/statistik-efter-amne/befolkning/befolkningens-sammansattning/befolkningsstatistik/pong/tabell-och-diagram/helarsstatistik--riket/befolkningsstatistik-i-sammandrag/ (accessed on 31 January 2018); Statistics Sweden (2018[8]), Population by County, 1968-2016, http://www.statistikdatabasen.scb.se/pxweb/en/ssd/START__BE__BE0101__BE0101A/BefolkningNy/table/tableViewLayout1/?rxid=709a880a-2c74-413a-9dd8-dc463b18f609 (accessed on 31 January 2018).
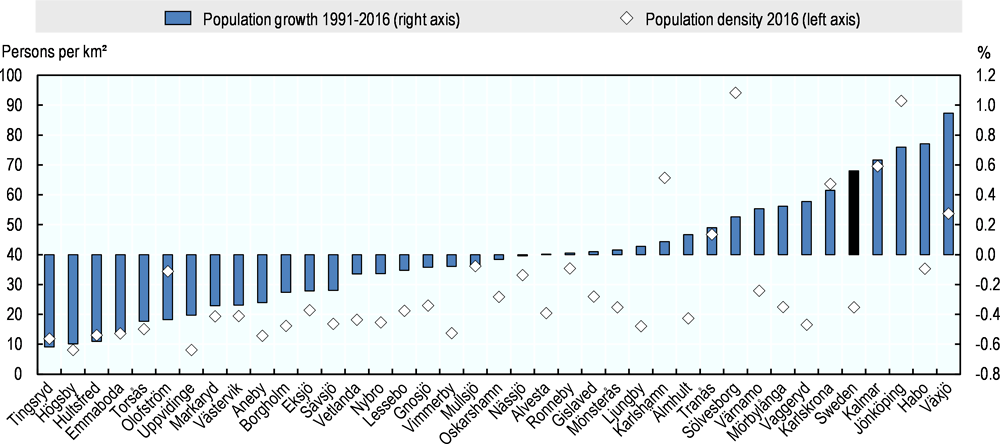
Note: Population growth is percentage change between 1991-2016 and population density is population per km², 2016.
Source: Statistics Sweden, (2018[8]), Befolkningsstatistik i Sammandrag 1960-2016 [Population Statistics in Summary 1960–2016], https://www.scb.se/hitta-statistik/statistik-efter-amne/befolkning/befolkningens-sammansattning/befolkningsstatistik/pong/tabell-och-diagram/helarsstatistik--riket/befolkningsstatistik-i-sammandrag/ (accessed on 31 January 2018).
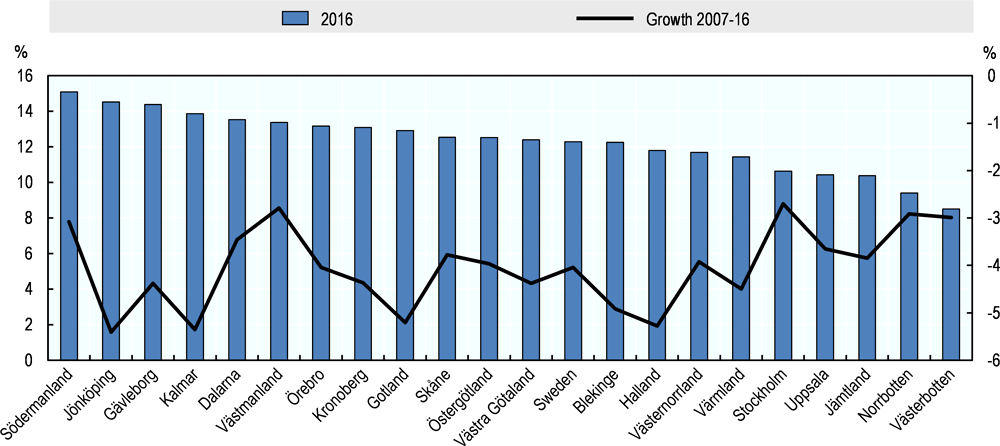
Population density remains stable and increased slightly in all four counties over 2012-17. Population density in Kalmar and Kronoberg remains close to the Swedish average (24 inhabitants per km²), while Jönköping has a higher (34) density and Blekinge the highest (55) despite its small population size found (Figure 1.5). In comparison to OECD TL3 regions (200), the lower density of the 4 countries confirms their rural nature. According to the OECD extended typology, Blekinge, Kalmar and Kronoberg are predominantly rural remote regions and Jönköping is predominantly rural close to the city. Despite their relatively low population density, the four countries in 2017 are facing the challenge of population decline – particularly prominent in rural remote regions – albeit to a lesser extent than in 2012.
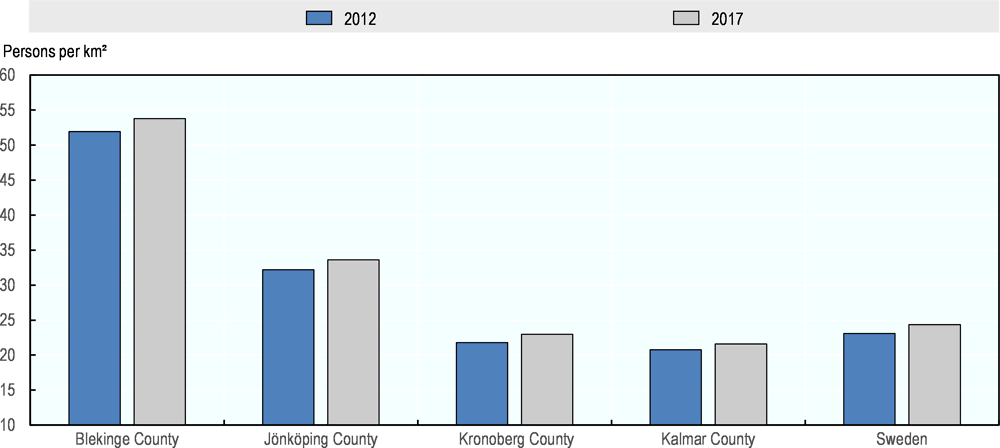
Source: OECD (2018[9]), Regional Demography, OECD Regional Statistics (database), https://doi.org/10.1787/a8f15243-en.
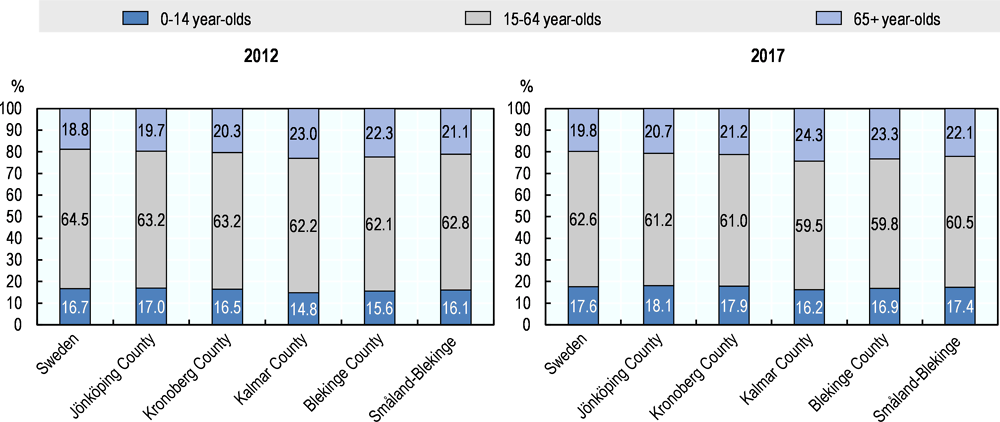
The increase in population growth in the four counties has been mainly driven by a growth rate in the youth population over the last five years. The percentage change in the share of youth (ages 0-14) has increased in Småland-Blekinge above that of the Swedish average between 2012 and 2017 (12.4% versus 11.2% percentage change respectively). Amongst its counties, all except Jönköping recorded a higher youth population growth rate than the Swedish average and Blekinge and Kalmar host the largest share of youth. In contrast, population growth amongst the working-age population (15-64) and seniors (65 years and more) has remained relatively stable between 2012 and 2017 standing below the average growth rate in Sweden (Table 1.1).
The four counties still face the pressures of an ageing population
Despite these receding pressures, population ageing remains prevalent in Småland-Blekinge, most notably in Kalmar County. Among all counties in Sweden, Kalmar has the second oldest age profile – with an average age of 43.8 in 2017 and the highest elderly dependency ratio at 40.72 (Table 1.2). All counties in Småland-Blekinge saw in increase in the average age of their population between 2012 and 2017 with the exception of Kronoberg, which saw a slight decline (-0.5%). This is undoubtedly related to the fact that Kronoberg has experienced high population growth in the past five years. Despite the population increases, the share of elderly and the share of youth increased at a higher rate than the rise in population. In other words, the elderly dependency ratio and the youth dependency ratio increased from 2012-17 against a drop in the working-age population (Figure 1.6). Among all OECD TL3 regions, the four counties are amongst the second and third quartiles in terms of the elderly dependency ratio.
Source: OECD (2018[9]), Regional Demography, OECD Regional Statistics (database), https://doi.org/10.1787/a8f15243-en.
Net migration has been a driver of population change
Among all counties in Sweden, Kalmar had the highest rate of net migration as a proportion of its population in 2016, at 2% (Table 1.3). Blekinge and Kronoberg were not far behind, at 1.5% and 1.4% respectively, while among the counties in Småland-Blekinge, Jönköping had the smallest share, at 1.1%.
The share of the foreign-born population is one indicator of migration. As the main receiving county, Stockholm has the largest share of foreign-born population, standing at 24.1% out of the total population in 2016 (see Table 1.4). However, among Swedish counties, several of the counties in Småland-Blekinge also show a relatively high share of foreign-born as a proportion of the population, with the highest in Kronoberg at 18.4% followed by Jönköping at 16.3% in 2016. Among the counties in Småland-Blekinge, Kalmar County has the lowest share of foreign-born as a percentage of its population, at 13.5% in 2016. It is important to note here that the allocation of migrants within counties has been in part determined by housing availability, particularly for those asylum seekers who are allocated housing through the Migration Agency (see Chapter 3 for an in-depth discussion).
The arrival of a large number of migrants has positively influenced the demographic profile of the Småland-Blekinge region.
Economic performance of the four counties
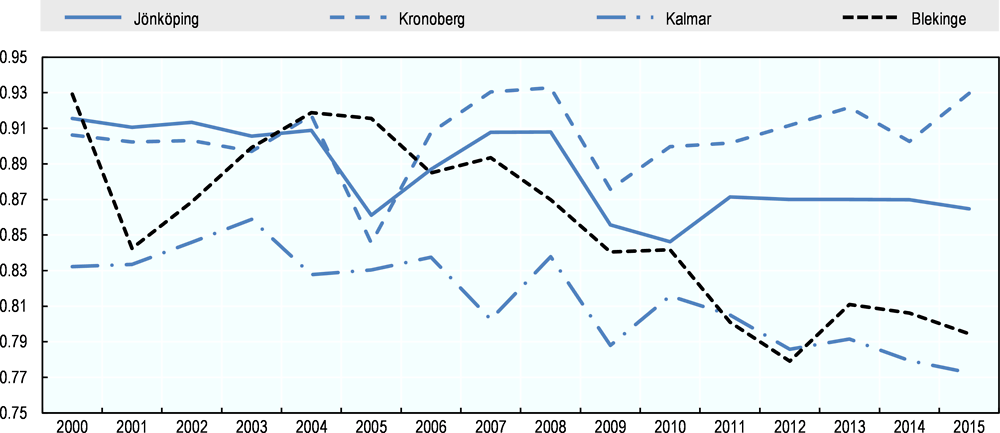
The territorial review highlighted the strong performance of Blekinge before the 2007 financial crisis period (OECD, 2012[1]). Whereas the county had the lowest level of GDP per capita in the region in 1995, it was the only amongst the four counties to record GDP per capita growth rates well above the average for Sweden over 1995-2007. Jönköping’s performance was slightly above the average and Kronoberg’s slightly below it.
After the crisis period, the convergence pattern of Blekinge halted, due to a slower growth rate in GDP per capita than the national average (Table 1.5). Kalmar’s performance, which recorded the second lowest level of GDP per capita in 1995, has also trailed behind the national average, especially in recent years. Jönköping has also performed behind the national pattern in recent years in contrast to Kronoberg, the only region that outperformed the national rate in GDP per capita, especially over 2011-15, even surpassing the performance of Stockholm.
Thus, amongst the four counties, only Kronoberg has been catching up to the national level of GDP per capita from standing 10 percentage points below the national average in 2000 to 7 percentage points in 2015 (Figure 1.7). Blekinge and Kalmar have been diverging and falling behind the national average over the last decade standing 20 percentage points below the national average. Jönköping reduced their distance from average levels of GDP per capita, albeit by just two or three percentage points, although from 2011 it has been growing at the same pace as the national average.
Source: OECD (2018[13]), Regional Economy, OECD Regional Statistics (database), https://doi.org/10.1787/a8f15243-en.
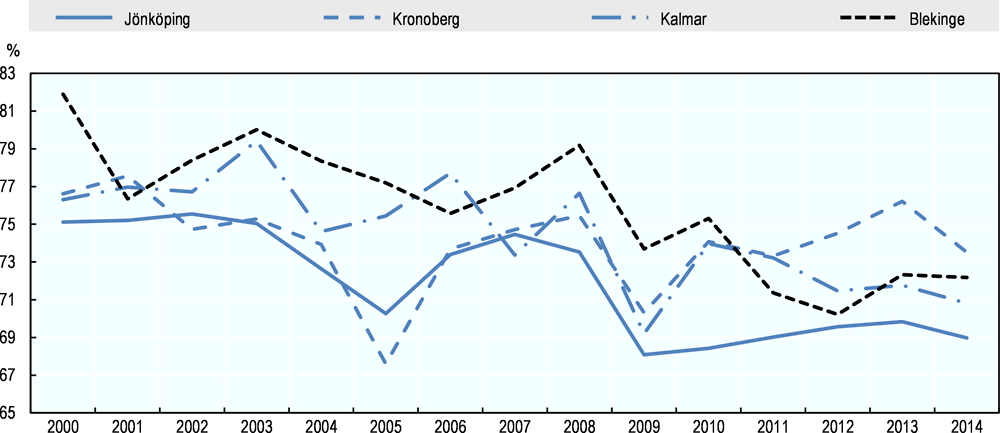
In terms of productivity growth, all 4 counties have been performing below the national average of 1.54 percentage points over 2000-15 (Table 1.6). Yet in recent years, over the period 2011-15, performance has overall improved. Jönköping has shown growth rates of 0.2 percentage points, very similar to the national ones. Kronoberg’s growth rates have been slightly higher, of 0.3 percentage points. Blekinge occupies the top end among the 4 counties, with 0.6 percentage of productivity growth, only below the capital city, Stockholm. Only the county of Kalmar has shown negative productivity growth rates over the recent years.
The gap between the counties’ labour productivity and the national average is wider than the one regarding GDP per capita. In 2000, Blekinge figured 20 percentage points below the Swedish average, which was the smallest difference, as the other counties were between 24 and 25 points below (Figure 1.8). Since then, despite spikes in 2003 and 2008, counties have been losing ground to the national average of productivity growth. Once the effects of the financial crisis could be observed, the counties have maintained a trend which points towards stabilisation. Still, in 2014, the gap was wider than the one observed in 2000. It varied from 26 percentage points in Kronoberg to 31 in Jönköping. Improving productivity levels, more than GDP per capita, should be a priority in these 4 counties.
Source: OECD (2018[13]), Regional Economy, OECD Regional Statistics (database), https://doi.org/10.1787/a8f15243-en.
It is important to highlight the strong performance of Sweden’s economy during this period under which the analysis benchmarks the four counties. It is also important to understand how the four counties have performed globally against comparable regions. To draw these international comparisons, the analysis identifies 44 OECD TL3 regions similar to the 4 counties of Småland-Blekinge, using 4 criteria to measure regional economies with a similar economic base. These include:
-
Density: measured by the level of population density in 2012 with values between 0.5 to 2 of the average population density in Småland-Blekinge.
-
Level of development: measured by the level of GDP per capita in 2012 with values ranging between 0.5 to 2 of the average level of GDP per capita in Småland-Blekinge.
-
Economic structure: measured by the share of the manufacturing sector in the economy, between 20%-40% in 2012.
-
Type of region: only considers predominantly rural regions or intermediate regions excluding predominantly urban regions according to the extended TL3 classification.
Applying these 4 criteria to all OECD TL3 regions, 44 TL3 regions are identified (Table 1.7):
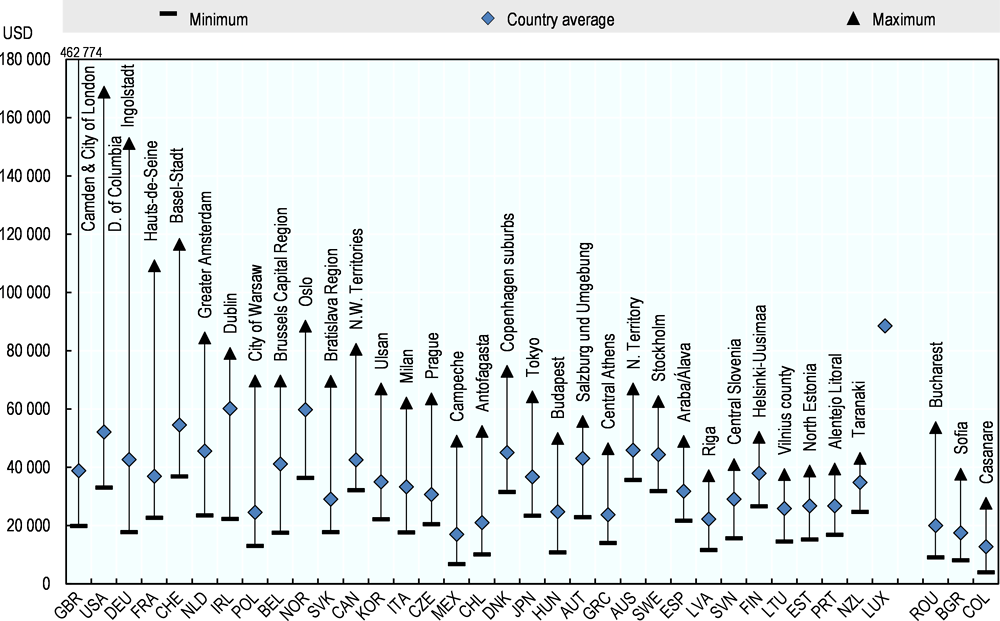
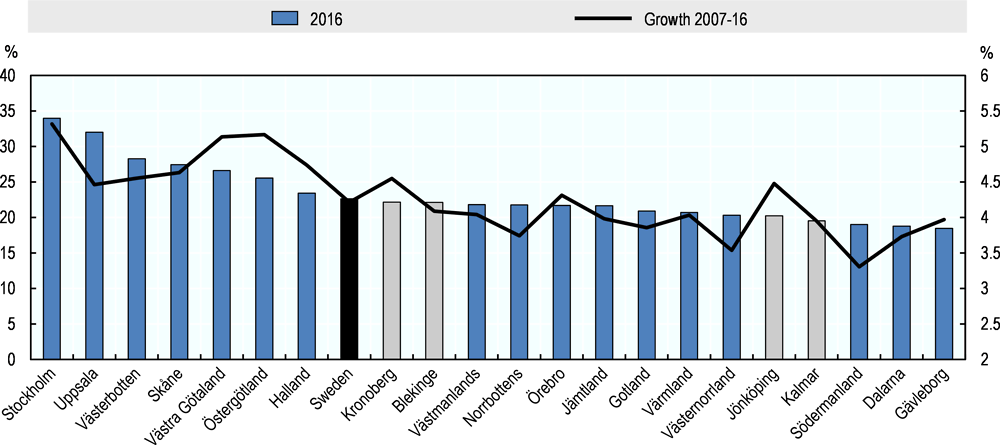
Comparing the performance of Småland-Blekinge in this group of regions from the OECD in GDP per capita reveals that the level of GDP per capita of the 4 counties was around the average, which was of USD 33 344 in 2012 (Figure 1.9). In the Småland-Blekinge region, it varied from USD 32 709 in Blekinge and USD 38 272 in Kronoberg, as of 2012.
In terms of growth rates in GDP per capita, all 4 regions were amongst the top 50% group of regions with the fastest growth, over the period 2012-15. Kronoberg and Blekinge record the 10th and 11th positions in this group, with a 2.4 percentage point of GDP per capita growth rate. The top performers in this comparison are the two Irish Regions of South-East and Mid-West, with a growth rate of 6.7 and 6.2 percentage points respectively. The other 2 Swedish regions in the comparison, Södermanland and Örebro, have experienced a decrease of GDP per capita, with negative rates of 1.8 and 0.4 respectively.
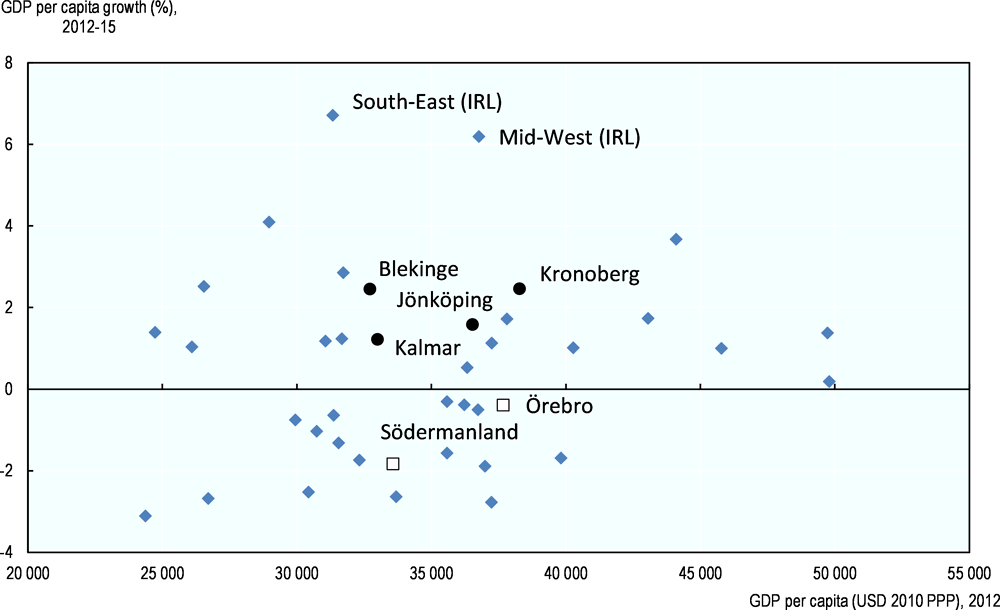
Source: OECD (2018[13]), Regional Economy, OECD Regional Statistics (database), https://doi.org/10.1787/a8f15243-en.
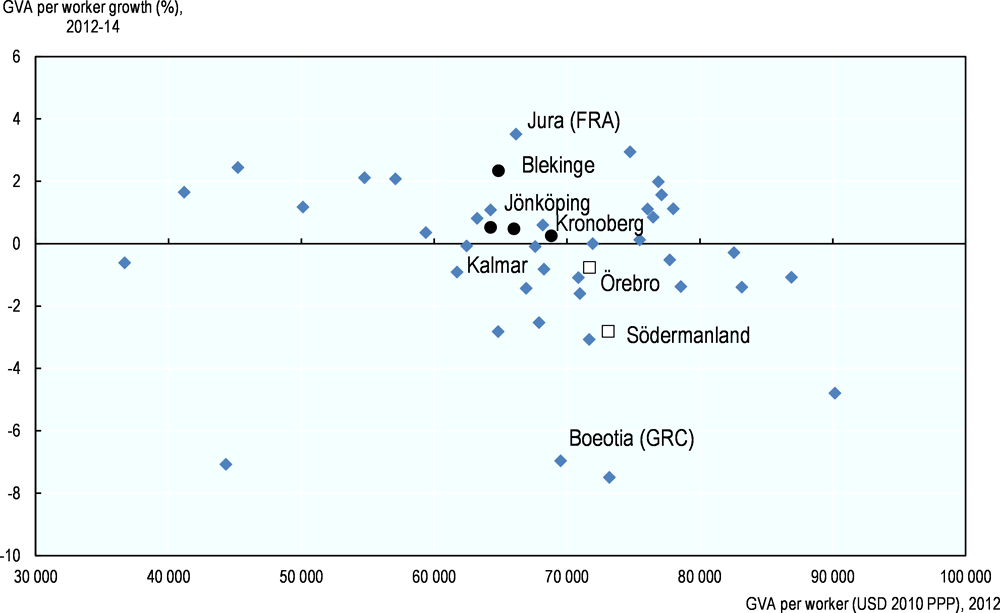
Comparing the performance of Småland-Blekinge to the benchmark regions from the OECD in labour productivity, the figure is less optimistic. Their productivity is relatively low in the four counties, falling into the bottom half of the distribution amongst the group. Kronoberg is placed in the 22nd position, right in the middle, with USD 68 803 Gross Value Added (GVA) per worker as of 2012 (Figure 1.10). The other three counties analysed in this study occupy a few positions below. The Swedish regions of Örebro and Södermanland are in the top half of the spectrum.
In terms of growth rates in labour productivity, all four regions were amongst the upper half. Blekinge recorded the 4th fastest growth rate in labour productivity in the period between 2011 and 2014, of 2.3%. The labour productivity in the other 3 counties has gained between 0.25% and 5.1% in the same period. Albeit small, the growth is positive, whereas all the regions in the bottom half of the spectrum have registered negative labour productivity growth rates.
More recent trends are not available, given that data at subnational level have a 3-year lag. Thus, they are only available up to 2014 for labour productivity and 2015 for GDP per capita. Nevertheless, more recent trends can be captured through the 2017 Regional Potential Index (RPI) produced by Nordregio. This index ranks all 74 European Nordic regions, in terms of demography, labour force and the economy3 (Grunfelder, 2018[14]). According to this index, the following patterns can be detected:
-
Blekinge and Kalmar, which were at the bottom of the distribution in 2014, have made significant progress in the most recent years. Blekinge moved from 59th place in 2015 to 50th place in 2017 in the RPI rankings, while Kalmar has moved from the 62nd to the 45th place.
-
Meanwhile, Jönköping and Kronoberg, which have strong rankings, maintained relatively well their position. They have declined only marginally between 2015 and 2017. Jönköping has fallen slightly from 30th place in the rankings in 2015 to 35th in 2017 while Kronoberg has fallen from 30th to 32nd.
-
Stockholm, which occupied 3rd place in 2015, is in the first place as of 2017. This strong performance of the capital region of Sweden must not be forgotten when comparing the four counties with the Swedish average, as above.
Source: OECD (2018[13]), Regional Economy, OECD Regional Statistics (database), https://doi.org/10.1787/a8f15243-en.
In terms of sectoral composition, the four counties continue to be more specialised in manufacturing and the primary sector than the rest of the country (Table 1.8). The sector has gravitated around 2% and 4% of their GDP as of 2014 whereas, in Sweden, it represented 1.5% of the GDP. The importance of agriculture, forestry and fishing has decreased in Blekinge and Jönköping from 2008 to 2014, while Kalmar and Kronenberg have registered the opposite trend. Still, this variation has been quite constrained: no more than 1% change has been observed during this period.
Manufacturing is the most important economic sector in the region. In 2014, it accounted for between 22% and 26% of the GDP of these counties whereas the manufacturing sector for the whole country represented 16.7% of the GDP. The weight of manufacturing has decreased in all the counties, while that of financial, insurance and real estate activities has increased in all of them from 2008 to 2014. These trends are consistent with the national ones, in which Swedish firms have been moving up the value chain, which partly explains the increasing share of services in output. More value is created in upstream activities (e.g. research and development, and product design) and downstream operations (e.g. marketing and customer services) than at the production stage, a pattern which has been accentuated over time by productivity gains in manufacturing and offshoring to low-cost production sites. Such activities require a high level of skills and intangible capital to allow firms to gain or retain a comparative advantage by differentiating their products from those of competitors.
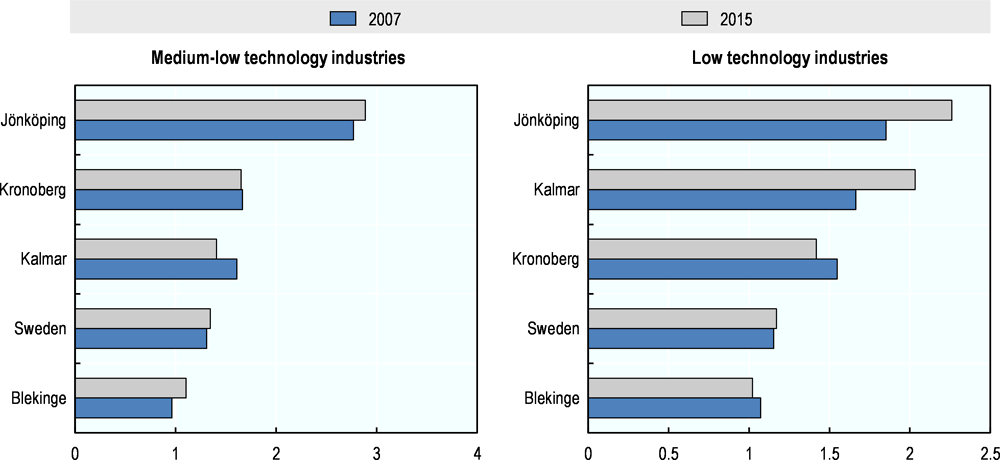
In terms of industrial specialisation (see Box 1.1), the region is more specialised in low to medium technology sectors, in comparison to high technology ones. All counties except Blekinge are more specialised in medium-low and low technology sectors (Figure 1.11). Between 2007 and 2015, some changes are visible:
-
The county of Jönköping has increased its specialisation in both medium-low and low technology sectors, maintaining its position as the most specialised county among the four.
-
Kalmar has become less specialised in medium-low technology and more specialised in low technology sectors.
-
Kronoberg has become less specialised in low-technology sectors, whilst variation in the medium-low sector has been less prominent.
-
Blekinge has become less specialised in low-technology sectors and more in medium-low technology sectors, yet remaining as the least specialised among the four counties, given its greater specialisation in high technology and knowledge-intensive sectors, as discussed further below.
Note: Balassa Hoover Index, so BHI = (Eij/Ej) / (Ei/E). BHI measures the degree of specialisation per region. A ratio where BHI>1 indicates a relatively high degree of specialisation, and vice-versa. BHI is equivalent to the more common location quotient (LQ), which is typically used to indicate whether a region is export/import oriented in a particular industry.
Source: OECD (2018[13]), Regional Economy, OECD Regional Statistics (database), https://doi.org/10.1787/a8f15243-en.
For compiling aggregates related to knowledge-intensive services, high technology, medium-low technology and low technology, the analysis uses Eurostat’s definition defining these sectors aggregating NAEC Rev codes as follows:
Knowledge-intensive services:
-
(50-51) Water transport; Air transport.
-
(58-63) Recording and music publish activities; Programming and broadcasting activities; Telecommunications; Computer programming, consultancy and related activities; Information service activities (section J).
-
(64-66) Financial and insurance activities (section K).
-
(69-75) Architectural and engineering activities, technical testing and analysis; Scientific research and development; Advertising and market research; Other professional, scientific and technical activities; Veterinary activities (section M).
-
(78) Employment activities.
-
(80) Security and investigation activities.
-
(84-93) Public administration and defence, compulsory social security (section O); Education (section P), Human health and social work activities (section Q); Arts, entertainment and recreation (section R).
High technology:
-
(21) Manufacture of basic pharmaceutical products and pharmaceutical preparations.
-
(26) Manufacture of computer, electronic and optical products.
Medium-high technology:
-
(20) Manufacture of chemicals and chemical products.
-
(27-30) Manufacture of electrical equipment; Manufacture of machinery and equipment n.e.c.; Manufacture of motor vehicles, trailers and semi-trailers; Manufacture of other transport equipment.
-
(19) Manufacture of coke and refined petroleum products.
-
(20-25) Manufacture of rubber and plastic products; Manufacture of other non-metallic mineral products; Manufacture of basic metals; Manufacture of fabricated metals products, excepts machinery and equipment.
Low technology:
-
(10-18) Manufacture of food products, beverages, tobacco products, textile, wearing apparel, leather and related products, wood and of products of wood, paper and paper products; Printing and reproduction of recorded media.
-
(31-32) Manufacture of furniture; Other manufacturing.
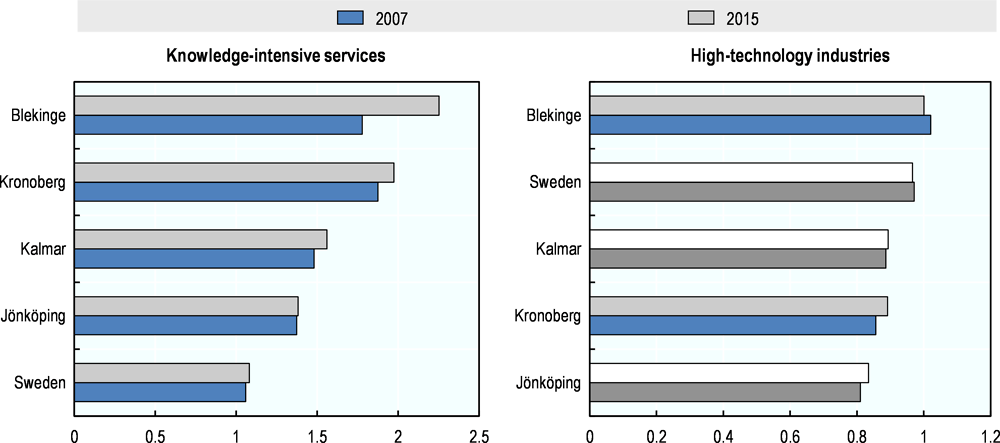
With respect to knowledge-intensive services and high-technology industries, only Blekinge is more specialised in these two sectors than Sweden as a whole (Figure 1.12). Particularly, Blekinge has gained further specialisation in high tech industries over the period 2007-15. Jönköping has also increased specialisation in high-technology manufacturing; as a result of which the county is now one of the top ten in Sweden.
Despite slight improvements in higher-technology and knowledge-intensive activities, Kalmar and Kronoberg Counties remain at the bottom of the rankings of Swedish counties in these fields. The current favourable economic climate in the region may be an important factor in explaining companies’ low motivation to engage in more technology-intensive activities.
Note: Balassa Hoover Index, so BHI = (Eij/Ej) / (Ei/E). BHI measures the degree of specialisation per region. A ratio where BHI>1 indicates a relatively high degree of specialisation, and vice-versa. BHI is equivalent to the more common location quotient (LQ), which is typically used to indicate whether a region is export/import oriented in a particular industry.
Source: Statistics Sweden (2016[15]), Arbetskraftsundersökningarna (AKU) [Labour Force Surveys], https://www.scb.se/hitta-statistik/statistik-efter-amne/arbetsmarknad/arbetskraftsundersokningar/arbetskraftsundersokningarna-aku/ (accessed on 30 January 2018).
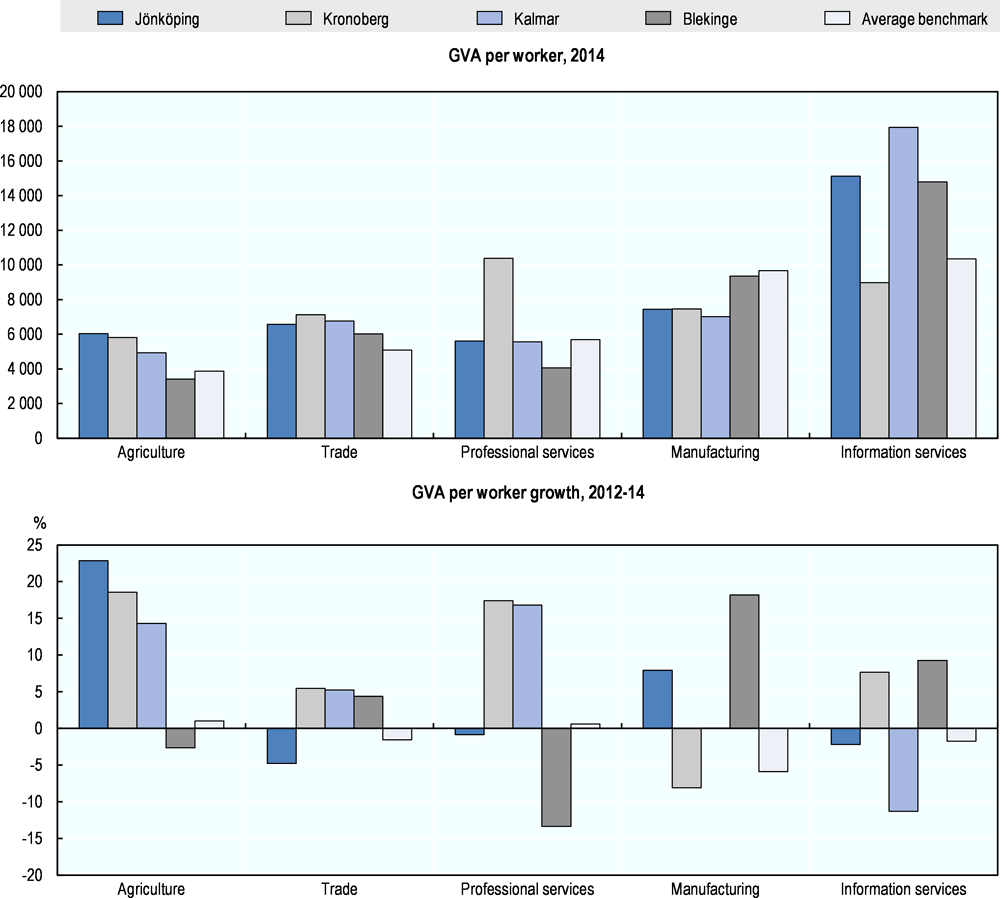
Across sectors, labour productivity in Småland-Blekinge regions compared to the benchmark regions from the OECD in 2014 was higher in smaller sectors such as professional and information services, and lower in larger sectors such as manufacturing and trade (Figure 1.13). Among Småland-Blekinge regions, Blekinge and Jönköping showed improvements between 2012 and 2014. The fast improvement in labour productivity in manufacturing of Blekinge is particularly notable given that the average level across comparable regions declined during the same period. Despite its small share in employment across regions, labour productivity in the agricultural sector improved in 2012-14 is all Småland-Blekinge regions except for Blekinge.
The labour market has been picking up, but large differences remain in the employment of native and foreign-born
Labour-market performance in Småland-Blekinge prior to the 2007-08 crisis was mixed, with Blekinge and Kalmar experiencing greater difficulties than Jönköping and Kronoberg (OECD, 2012[1]). Blekinge County had the largest gaps in unemployment and employment rates with respect to the Swedish averages, and Kalmar experienced consistently lower employment rates. Blekinge nevertheless weathered the crisis better than its neighbours, with a smaller rise in the unemployment rate over 2008-09 (OECD, 2012[1]).
Source: OECD (2018[13]), Regional Economy, OECD Regional Statistics (database), https://doi.org/10.1787/a8f15243-en.
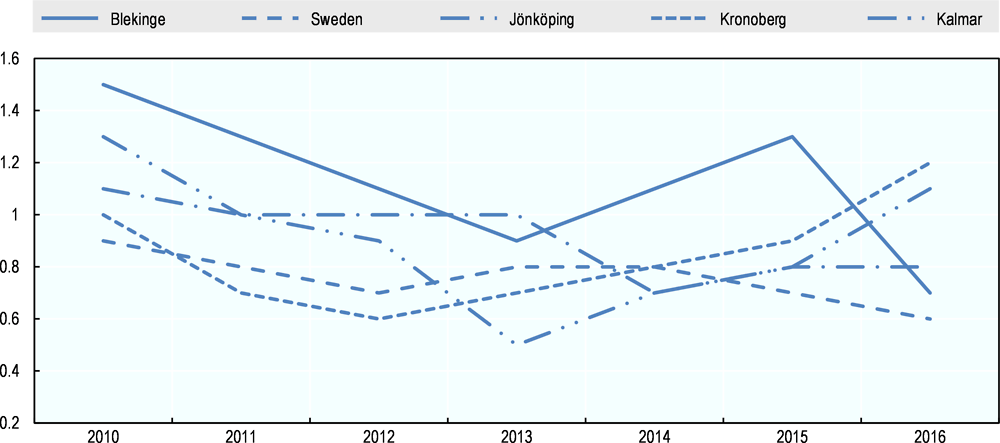
Over the past few years, in all 4 counties, the unemployment rates of those aged 16-24 have been declining. Blekinge still has higher unemployment rates than the national average in 2016 but has almost closed the gap in the last reducing the unemployment rate by 2 full percentage points from 9.7 in 2015 to 7.7 in 2016 (Figure 1.14). Kronoberg’s unemployment rate remained below the national average from 2001-15 and only in the last year (2015-16) has surpassed it, standing at 7.9. In contrast, the unemployment rates of Kalmar and in particular Jönköping are lower than the Swedish average both improving their unemployment situation since 2010, standing at 5.6 and 5.8 respectively in 2016.
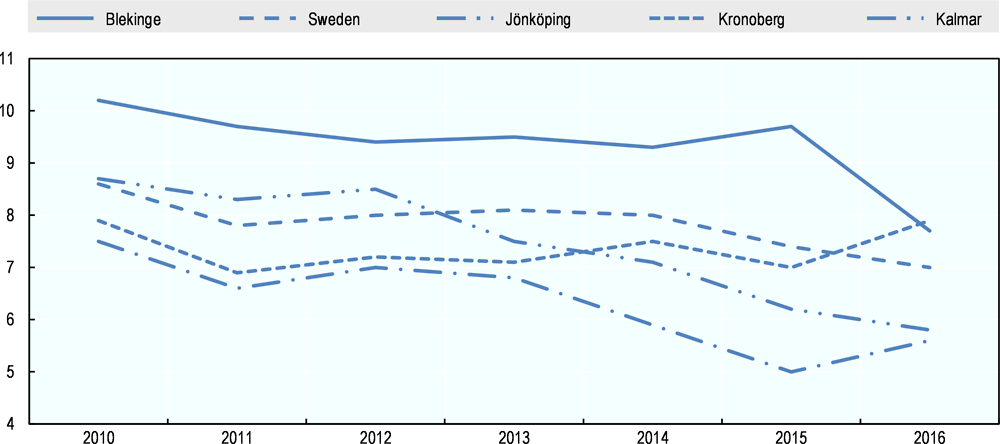
Note: Unemployment and employment rate is for those aged 15 and over (definition from the Labour Market Agency, Arbetsförmedlingen).
Source: Statistics Sweden (2016[15]), Arbetskraftsundersökningarna (AKU) [Labour Force Surveys], https://www.scb.se/hitta-statistik/statistik-efter-amne/arbetsmarknad/arbetskraftsundersokningar/arbetskraftsundersokningarna-aku/ (accessed on 30 January 2018).
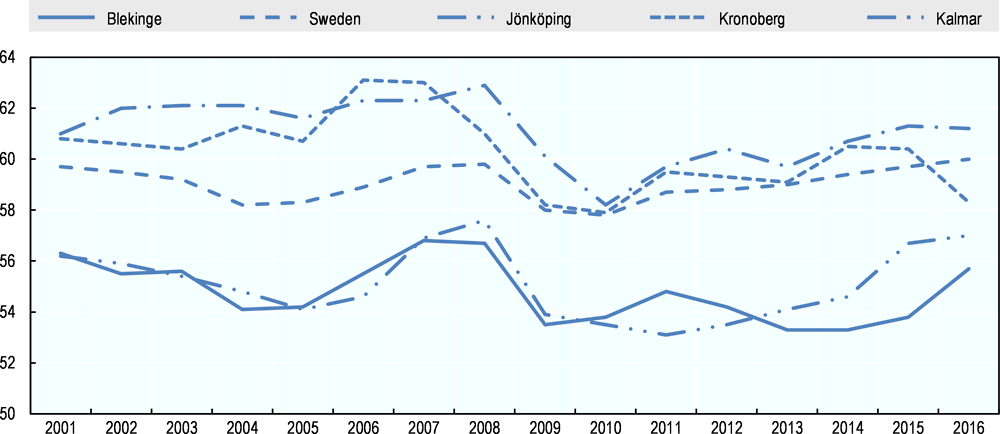
All four counties display the same cycle movement in employment rates. The employment rates in Jönköping and Kronoberg remained above the national average from 2010-16, although in Kronoberg it has dropped in the last year (2015-16). In contrast, the employment rates in Blekinge and Kalmar remain below the national average and since 2013 both have been converging standing less than 1 percentage point (0.7 and 0.9 respectively) below the national average in 2016 (Figure 1.15).
In addition, the employment difference between native workers and those born abroad remains large in Småland-Blekinge: close to a 20 percentage-point gap in all counties, with Blekinge and Jönköping recording the largest and smallest variations respectively (Statistics Sweden, 2016[16]).
The gap between female and male participation rates has increased but more women have accessed managerial positions
The difference in labour market participation rates between males and females in Småland-Blekinge has increased in the past few years, as opposed to the continuously narrowing gap which is observed in Sweden on average (OECD, 2018[17]).4 In 2015, female participation rates were lower in all 4 counties than for Sweden as a whole (-6.8%). The counties of Kalmar (-5.6 to -9.4) and Kronoberg (-6.1 to 8.4) experienced the most dramatic increase between 2013 and 2015, but Jönköping remains the county with the highest gender difference gap, reaching -10.9% in 2015 (Figure 1.16). While important gender differences persist, the proportion of women accessing a managerial position between 2009 and 2015 has steadily increased in all counties, oscillating between 30% and 35.5% in 2015, but there again Jönköping County lags behind its peers (Statistics Sweden, 2016[15]).
Source: OECD (2018[16]) Regional Labour, OECD Regional Statistics (database), https://doi.org/10.1787/a8f15243-en.
Source: OECD (2018[16]) Regional Labour, OECD Regional Statistics (database), https://doi.org/10.1787/a8f15243-en.
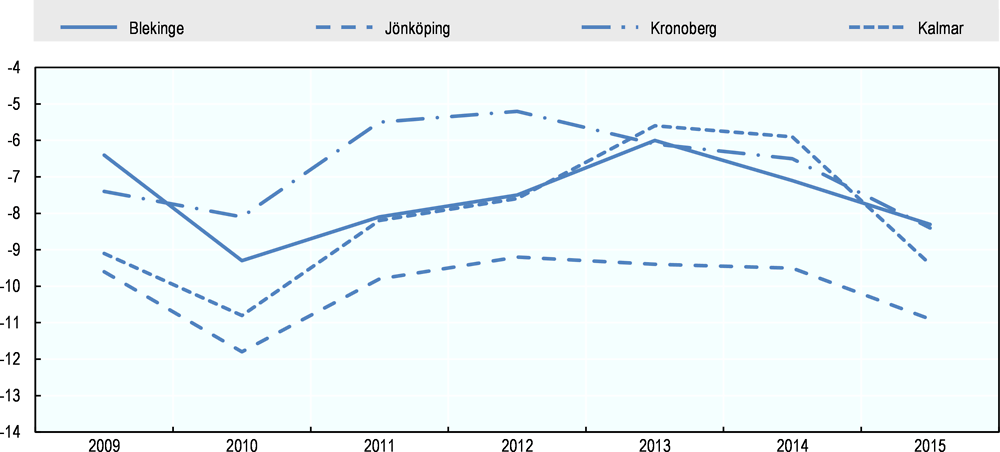
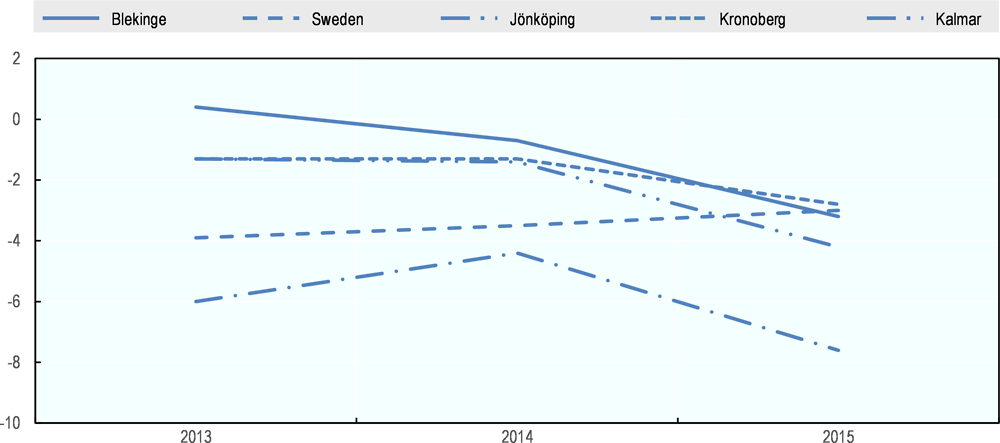
The gap in unemployment rate female vis-à-vis male is larger than the national gap (Figure 1.17). Between 2010 and 2013, the gap (female unemployment rate minus male unemployment rate) decreased in all counties following the national trend. The national trend declined further until 2016 and, in contrast in Småland-Blekinge, the female unemployment rate increased again vis-à-vis the male from 2013 to 2016, except in Blekinge which decreased in 2016.
Source: OECD (2018[16]) Regional Labour, OECD Regional Statistics (database), https://doi.org/10.1787/a8f15243-en.
In terms of employment rates in Småland-Blekinge, the rates between men and women were very similar in 2013 with the exception of Jönköping (Figure 1.18). Sweden, which had a bigger gender gap than the three counties, has been reducing the gap. In contrast, the gap has increased in all four counties.
Source: OECD (2018[16]) Regional Labour, OECD Regional Statistics (database), https://doi.org/10.1787/a8f15243-en.
Inter-regional disparities and well-being
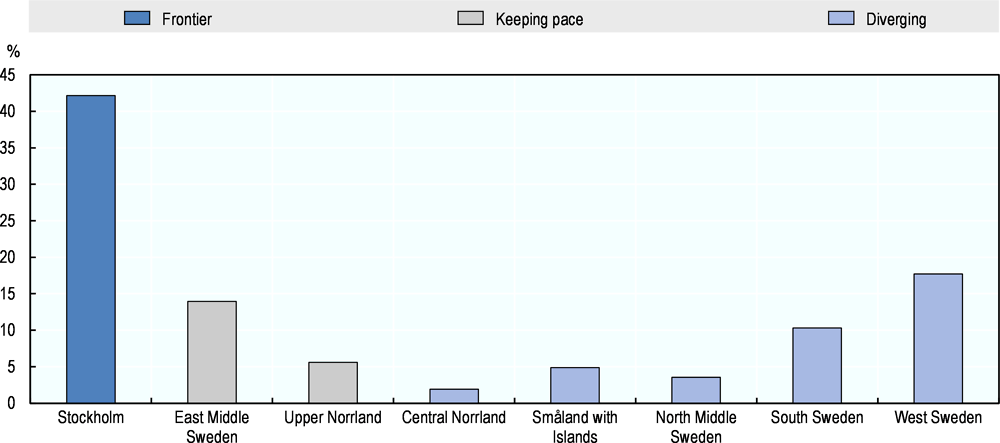
Stockholm is the strongest performing large (TL2) region in Sweden recording the highest level of GDP per capita and labour productivity growth.5 Stockholm was responsible for over 40% of national GDP growth between 2000 and 2013 (Figure 1.19). Only Upper Norrland and East Middle Sweden were able to keep pace with Stockholm between 2000 and 2013, while in the rest of regions GDP per capita and labour productivity growth is slower.
Note: Percentage contribution shows the share of total GDP growth due to growth in the indicated region. Total contribution equals 100%.
Source: OECD (2016[18]), OECD Regional Outlook 2016: Productive Regions for Inclusive Societies, https://doi.org/10.1787/9789264260245-en.
The strong performance of Stockholm contributes to national prosperity but also puts pressure on inter-regional inequalities in Sweden, which have been rising over the last years. Despite recent increases, Sweden still enjoys relatively low levels of inter-regional inequalities when compared with OECD countries (Figure 1.20) recording the 6th lowest level in 2016.
Sweden and Småland-Blekinge show relatively high levels of well-being compared to other OECD regions
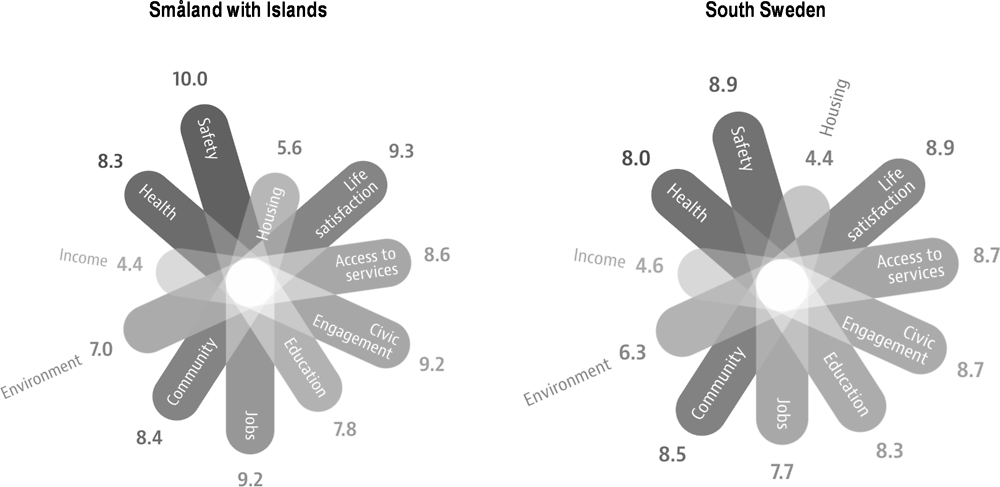
Småland-Blekinge is an attractive region with high levels of well-being offering high quality of life for its residents.6 The OECD Regional Well-being dataset measures 11 dimensions of well-being standardised across all TL2 regions in the OECD. There are currently no comparable data for well-being across TL3 regions (e.g. counties). Jönköping, Kalmar and Kronoberg along with Gotland are part of the TL2 region of Småland with Islands while Blekinge and Skåne are part of the TL2 regions of South Sweden.
The well-being indicators for Småland with Islands and South Sweden reveal a similar picture scoring relatively high in 9 of the 11 dimensions of well-being and low in just 2 of them (income and housing) (Figure 1.21). When comparing the individual dimensions of well-being amongst the 2 regions, Småland with Islands fares similarly or better in 9 of the 11 dimensions with respect to South Sweden.
Source: OECD (2018[13]), Regional Economy, OECD Regional Statistics (database), https://doi.org/10.1787/a8f15243-en.
Source: OECD (n.d.[19]), Regional Well-Being Database, www.oecdregionalwellbeing.org.
The OECD Regional Well-being dataset also identifies OECD TL2 regions with a comparable level of well-being to Småland with Islands and South Sweden. These include Central Jutland (Denmark), Helsinki-Uusimaa (Finland), Brittany (France), Utrecht (Netherlands) and Oslo and Akershus (Norway).
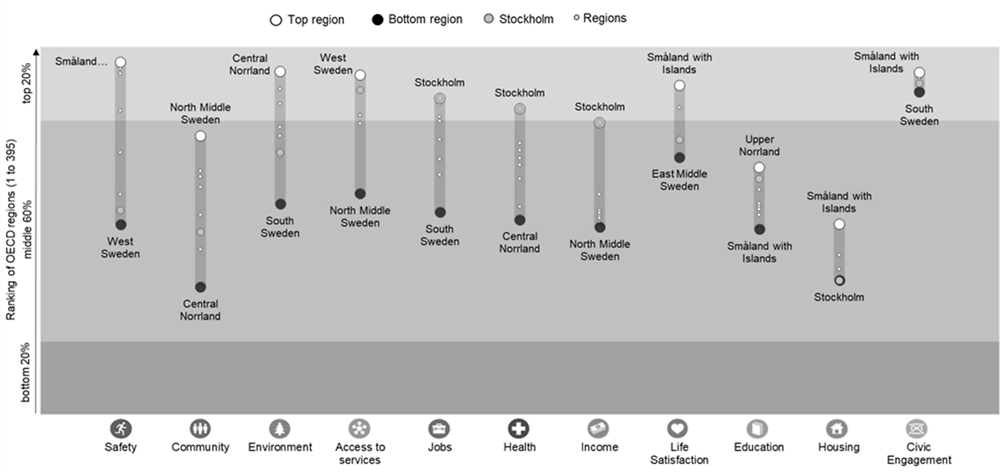
Småland with Islands ranks at the top of Swedish rankings and in the top 20% of OECD regions in safety, life satisfaction and civic engagement (Figure 1.22). Housing also comes at the top of Swedish rankings but when compared to OECD it only stands at 60% of the distribution. Education is the area in which improvement is most needed, as Småland with Islands occupies the lowest ranking of all Swedish regions. In contrast, South Sweden, of which Blekinge County is a part of, tends to be in the bottom rankings, in environmental sustainability, employment outcomes and civic engagement. It is fair to assume that the weight of Skåne County may be greater than that of Blekinge County in determining those results, however, no distinction is possible under the South Sweden T2 region.
Note: Access to services is measured by household broadband, civic engagement by voter turnout, education by the share of the labour force with at least secondary education, jobs by employment and unemployment rate, community by perceived social support network, environment by average level of fine particulate matter (pm 2.5) in the region experienced by the population, income by disposable income per capita, health by mortality rate and life expectancy, safety by homicide rate, housing by number of rooms per person and life satisfaction by life satisfaction.
Source: OECD (2016[20]), Regional Well-Being in OECD Countries: Sweden, http://www.oecd.org/cfe/regional-policy/hows-life-country-facts-sweden.pdf (accessed on 30 January 2018).
Housing shortages remain a challenge
Akin to the rest of Sweden, the region of Småland-Blekinge is also faced with housing shortages which impact the lives of its residents and represent a bottleneck to economic development. Regional data from the Swedish National Board of Housing, Building and Planning (Boverket) reveals that the housing market in Småland-Blekinge is unbalanced with a deficit on housing in all 38 municipalities of the region (Boverket, 2018[21]). Estimates project no change to this situation in the coming 3 years in most municipalities. More precisely, the situation is estimated to improve in only 7 of the 38 municipalities comprising the Småland-Blekinge region.
A shortage of housing on the market or a lack of appropriate housing (in terms of cost and type) can have wide-ranging impacts. It can, for instance, reduce labour mobility as individuals find it more difficult to move in order to access employment and it prevents a barrier for new migrants to a region. While the housing shortage in Sweden is most pronounced in the largest cities where demand is the greatest, these trends are impacting a wide range of municipalities.
Rising property valuations are as a major challenge for Sweden as noted in the latest OECD Economic Survey (2017[22]), penalising households with low income and wealth and leading to a widening of inequalities. In Småland-Blekinge, property prices have followed the national trend, increasing from 2008-10, then declining until 2012 and increasing again until 2015 (Figure 1.23). In Jönköping and Kronoberg property prices are above the national average while in Kalmar and particularly Blekinge, they are below.
Source: Statistics Sweden (2016[15]), Arbetskraftsundersökningarna (AKU) [Labour Force Surveys], https://www.scb.se/hitta-statistik/statistik-efter-amne/arbetsmarknad/arbetskraftsundersokningar/arbetskraftsundersokningarna-aku/ (accessed on 30 January 2018).
Main factors of growth and bottlenecks in Småland-Blekinge
Accessibility, mobility and digital connectivity
The 2012 territorial review recommended improving the accessibility of Småland-Blekinge, both internally and externally, to enhance the competitiveness of the region. Although the region is geographically relatively close to European markets in the Swedish context, improving its accessibility has been at the forefront of the policy discussion.
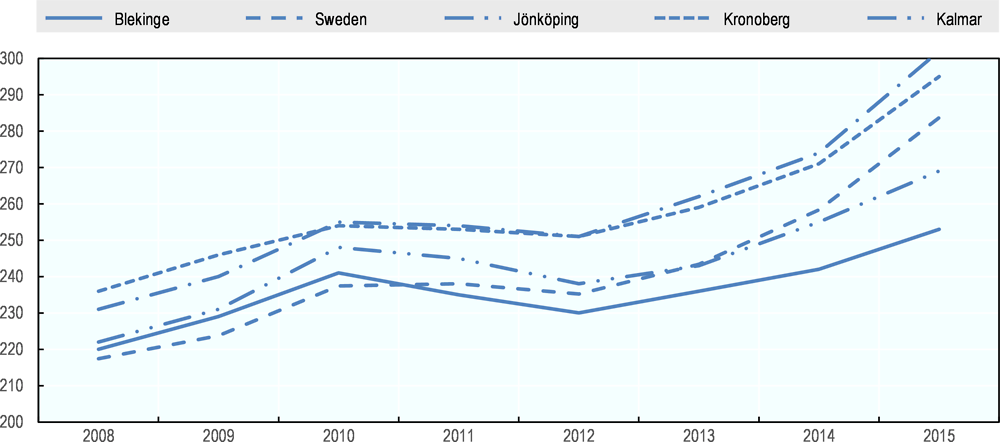
There have been improvements in internal mobility via public transportation
While representing a small share of total public transportation journeys by bus and trains in Sweden in 2016, between 2010 and 2016 all counties in Småland-Blekinge have recorded annual developments higher than the Swedish average, with the exception of Blekinge County (Blekinge, 2018[23]) (Figure 1.24). This signals a positive transition of the region towards the adoption of more sustainable modes of transportation.
Source: Statistics Sweden (2016[15]), Arbetskraftsundersökningarna (AKU) [Labour Force Surveys], https://www.scb.se/hitta-statistik/statistik-efter-amne/arbetsmarknad/arbetskraftsundersokningar/arbetskraftsundersokningarna-aku/ (accessed on 30 January 2018).
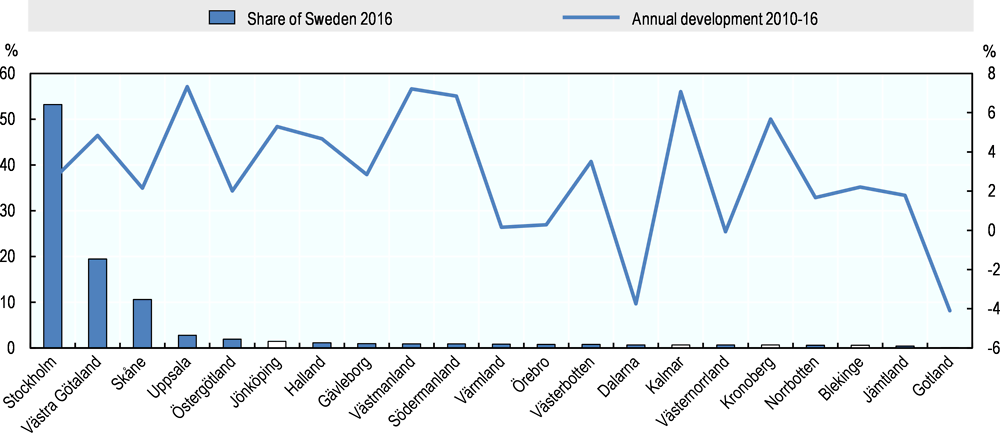
Jönköping improved its share of tonnes transported by road freight
All counties except Blekinge increased their stock road freight transportation goods over the 2013-17 period: Jönköping by 14%, Kronoberg by 3% and Kalmar by 3%. Only Blekinge declined in the total tonnes transported by road freight by 1%. This increase can be driven by a myriad of factors, including its accessibility or national market conditions. In relation to the Swedish freight transportation flows, only Jönköping increased its relative share against a decline in the rest of counties (Figure 1.25).
Digital connectivity across the region has improved
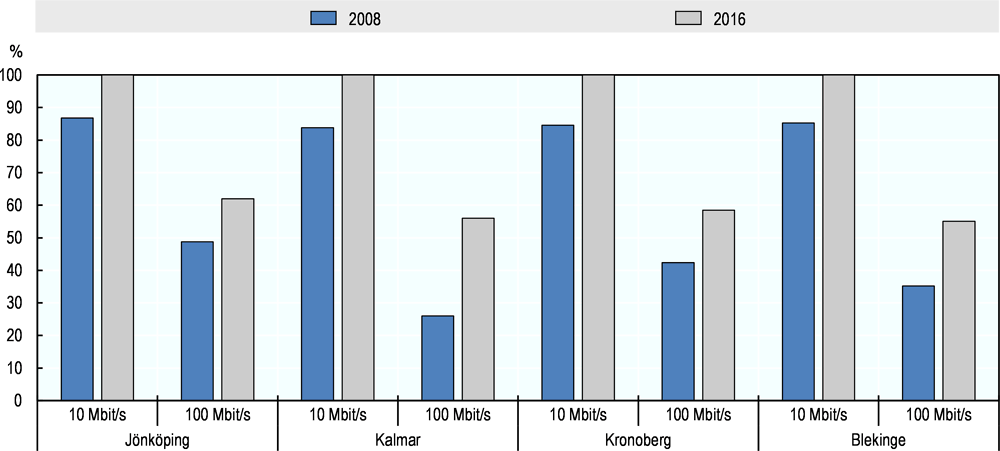
Broadband connectivity has been an infrastructural priority for the past five years. All counties of Småland-Blekinge show significant increases in broadband connectivity at 100 Mbits deployed both in the home and work environments. In 2016, Jönköping and Kronoberg Counties registered the highest deployment figures: 62% and 58% in the home, and 50% and 51.5% in workplaces respectively. Blekinge and Kalmar Counties are the counties that made the most remarkable advancements between 2012 and 2016 in terms of deploying broadband both to homes and workplace. While important progress has been made in raising digital connectivity in the region, access to broadband remains limited compared to other OECD regions and the rest of Sweden. In terms of average speed for receiving data, Småland and Blekinge are still low. Despite improvements on access to 100 megabits for households between 2008 and 2016 (Figure 1.26), Blekinge, Kalmar and Kronoberg Counties are among the 6 counties with the lowest average speed among 21 counties in Sweden (Bredbandskollen, 2017[24]).
Source: Eurostat (2017[25]), National Annual Road Freight Transport by Regions of Loading (NUTS 3) and by Group of Goods (1 000 t), from 2008 Onwards, https://ec.europa.eu/eurostat/web/products-datasets/product?code=road_go_na_rl3g (accessed on 08 January 2019).
Source: Statistics Sweden (2016[15]), Arbetskraftsundersökningarna (AKU) [Labour Force Surveys], https://www.scb.se/hitta-statistik/statistik-efter-amne/arbetsmarknad/arbetskraftsundersokningar/arbetskraftsundersokningarna-aku/ (accessed on 30 January 2018).
Innovation
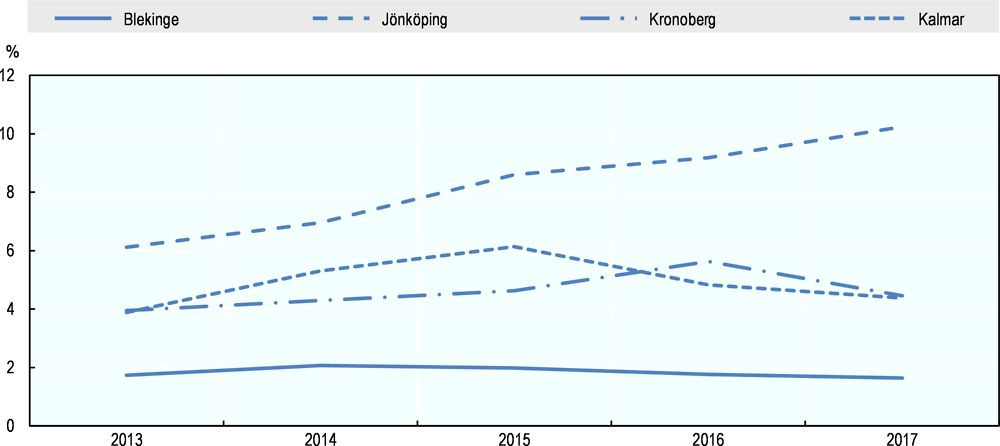
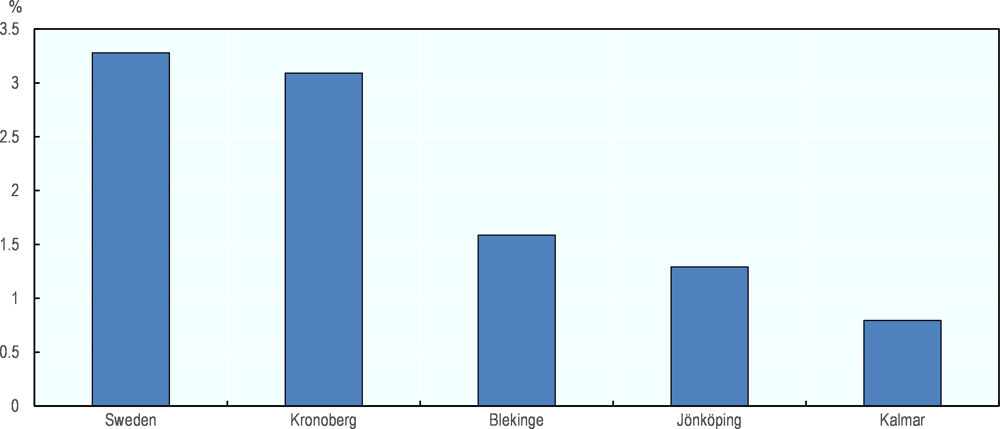
In the counties of Småland-Blekinge, research and development expenditures as a percentage of GDP have either increased slightly or stagnated between 2013 and 2015. In 2015, Kronoberg County recorded the highest percentage of research and development expenditures as a percentage of GDP (3.1%), which brought it close to Sweden’s national average (3.3%), and was followed by Blekinge County (1.6%) (Figure 1.27). Research and development expenditures by the business community have most likely been driving those increases.
Business research and development expenditures as a percentage of GDP have increased in all four counties between 2013 and 2015, with Kronoberg and Jönköping as leading counties. The weight of business research and development expenditures is most visible when looking at Blekinge County in which, unlike its peer counties, business research and development expenditures almost doubled from 353 in 2013 to 680 in 2015. This important increase is also visible in terms of overall research and development expenditures as a percentage of GDP from Blekinge went from 1.1% in 2013 to 1.6% in 2015. In all counties, after the business community, the largest shares of research and development expenditures as a percentage of GDP come from universities and colleges.
Source: Statistics Sweden (2016[15]), Arbetskraftsundersökningarna (AKU) [Labour Force Surveys], https://www.scb.se/hitta-statistik/statistik-efter-amne/arbetsmarknad/arbetskraftsundersokningar/arbetskraftsundersokningarna-aku/ (accessed on 30 January 2018).
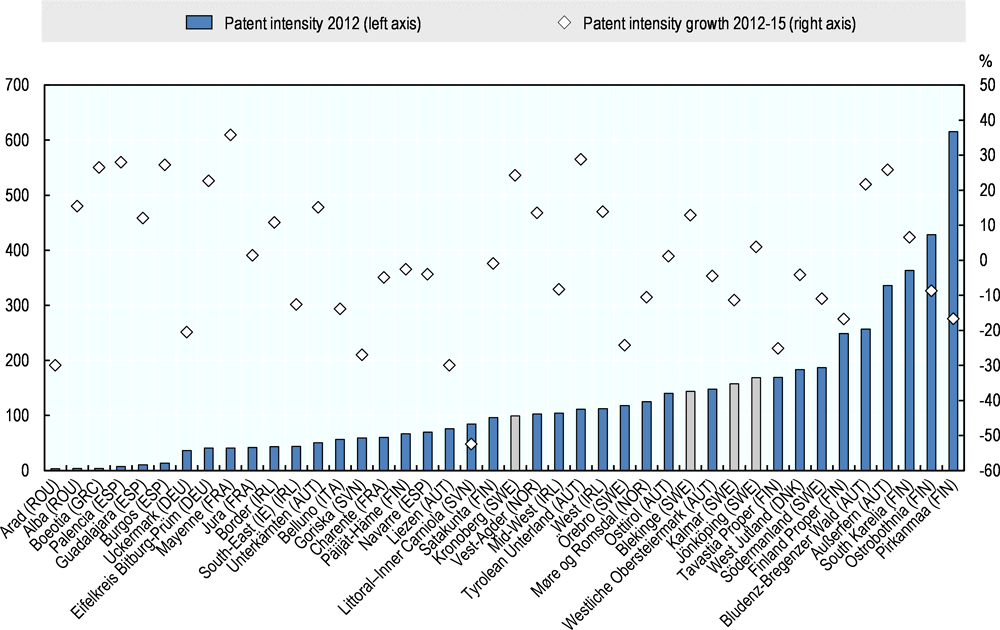
In terms of patent intensity, all 4 counties recorded a higher patent intensity than their comparable group of 44 regions. Jönköping recorded the 10th highest patent intensity followed by Kalmar (11th), Blekinge (13th) and Kronoberg (21st). Over the last years, from 2012-15, Kronoberg recorded the 7th highest patent-intensity growth amongst the 44 comparable countries, followed by Blekinge (14th) and Jönköping (18th) (Figure 1.28). In contrast, patent-intensity growth in Kalmar was below the average growth of the 44 regions.
Source: OECD (2018[26]), Regional Innovation, OECD Regional Statistics (database), https://doi.org/10.1787/a8f15243-en.
Human capital and skills
Skills mismatch in Sweden
Skills shortages and mismatches in Sweden are a widespread challenge that educational and labour market actors have a common responsibility to address. The OECD Skill Mismatch Indicator reports that 37% of workers in Sweden are experiencing “field-of-study mismatch” whereby individuals are employed in a different field than the one they have specialised in (OECD, 2017[27]). Qualifications mismatch – e.g. whereby a worker has qualifications that exceed (over-qualification) or do not meet (under-qualification) those generally required for the job – is also a persistent issue. In Sweden, 14% of individuals are over-qualified and 23% are under-qualified for their work (OECD, 2017[27]). Similar data analyses would prove useful if conducted at the regional level, which may be done at the initiative of the different counties.
The counties of Småland-Blekinge are characterised by a lower stock of skills than the Swedish average…
The share of people aged 25-64 with at least upper secondary education in Småland-Blekinge is lower than in the rest of Sweden on average, except in Blekinge (Figure 1.29) Among the counties, Kronoberg is the 8th lowest, Kalmar the 4th lowest and Jönköping the 2nd lowest in Sweden.
…however, progress is being made
Despite the high shares of low-skilled people in the workforce, progress has been made over 2007-16 with all four counties reducing the share of low skills in their workforce at a higher rate than nationally. Jönköping recorded the highest decline (-5.4) across all Swedish regions, followed by Kalmar (-5.3) and Blekinge recorded the fourth highest decline (-4.9).
Source: Statistics Sweden (2016[15]), Arbetskraftsundersökningarna (AKU) [Labour Force Surveys], http://www.statistikdatabasen.scb.se/pxweb/en/ssd/START__UF__UF0506/Utbildning/table/tableViewLayout1/?rxid=364e5a0c-2341-4fd5-80f7-27f70a40408b (accessed on 30 January 2018).
Compare to national levels Blekinge and Kronoberg have a similar share of high-skilled workers while Kalmar and Jönköping have lower levels
Despite relatively low stock of skills compared to the Swedish average, the share of the labour force with tertiary education or higher is lower in all four counties than nationally. Kronoberg (22%) and Blekinge (22%) stood right below the Swedish average (23%) in 2016, in contrast to Kalmar (19%) and Jönköping (22%) both recording the 4th and 5th lowest score in Sweden (Figure 1.30).
Between 2007 and 2016, the share of the labour force with some form of tertiary education or higher (e.g. three years of post-secondary education) increased in all four counties. In Kronoberg (4.6 percentage points) and Jönköping (4.5 percentage points), the increase was larger than the national average (4.2 percentage points) against a lower increase in Kalmar (3.9 percentage points) and Blekinge (4.1 percentage points) (Figure 1.30).
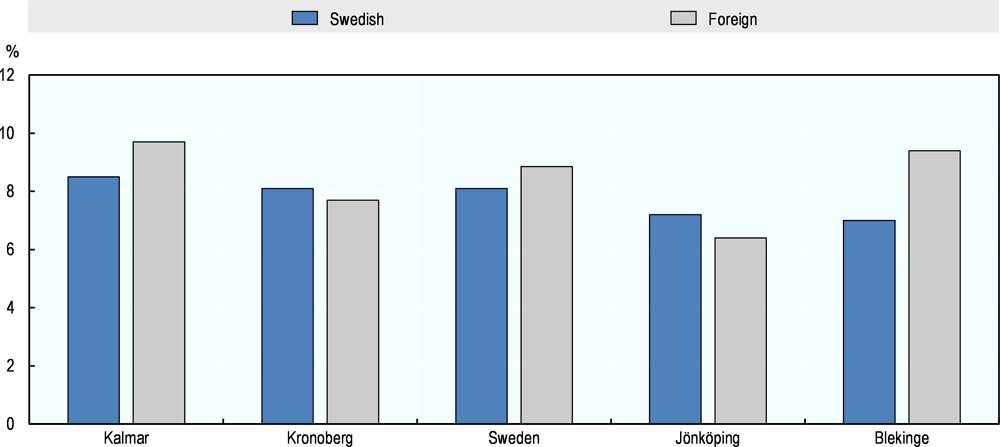
In accordance with the Swedish average, the counties of Blekinge and Kalmar are characterised by a prevalence of foreign-born entrepreneurs. The share of Swedish native entrepreneurs is higher in Jönköping and Kronoberg.
Source: Statistics Sweden (2016[15]), Arbetskraftsundersökningarna (AKU) [Labour Force Surveys], https://www.scb.se/hitta-statistik/statistik-efter-amne/arbetsmarknad/arbetskraftsundersokningar/arbetskraftsundersokningarna-aku/ (accessed on 30 January 2018).
Recent graduates have mixed success gaining employment post graduation
Recent graduates in Småland-Blekinge have mixed success gaining employment one-year post graduation. Among the counties, Jönköping and Kalmar Counties fair comparatively well, ranking 5th and 6th respectively among Sweden’s counties, while Kronoberg and Blekinge rank 13th and 18th respectively (Figure 1.31).
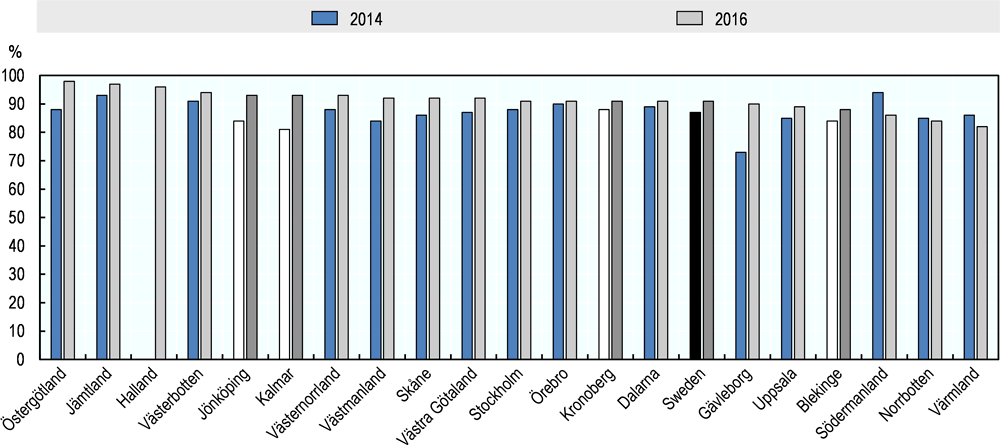
Note: 2014 and 2016 values for Gotland not available.
Source: Myh (2018[28]), Swedish National Agency for Higher Vocational Education, http://www.myh.se (accessed on 30 January 2018).
In accordance with the Swedish average, the counties of Blekinge and Kalmar are characterised by a prevalence of foreign-born entrepreneurs (Figure 1.32). The share of Swedish native entrepreneurs is higher than that of foreign-born in Jönköping and Kronoberg.
Source: Statistics Sweden (2016[15]), Arbetskraftsundersökningarna (AKU) [Labour Force Surveys], https://www.scb.se/hitta-statistik/statistik-efter-amne/arbetsmarknad/arbetskraftsundersokningar/arbetskraftsundersokningarna-aku/ (accessed on 30 January 2018).
Summary of findings
A number of findings are emerging from Chapter 1, assessing the performance of the 4 counties of Småland and Blekinge over the past years. All counties are facing the following trends:
-
Population has increased since 2011, particularly in Kronoberg and Jönköping primarily by the arrival of immigrants. This increase in population is very concentrated with only four counties contributing to almost half of the population growth from 2011-17.
-
The performance in GDP per capita amongst the counties has been mixed: all four regions have below Swedish average levels of GDP per capita. Over the past years, Kronoberg has been catching up to the national average, Jönköping has been growing around the same pace as the national average and both Blekinge and Kalmar have been declining. When comparing this performance to international standards the growth rates in GDP per capita of all 4 counties have been above the average growth rate of 44 comparable regions.
-
In terms of productivity, the gap of the four counties with respect to Sweden is larger than it is with respect to GDP per capita. More worrisome, the gap has widened over the past 15 years overall, although since 2010 convergence started to take place. Productivity in the four counties is below the average of comparable regions. This is a key area of priority for improving the medium- and long-term competitiveness of the four counties Although they are starting to catch up, the pace of convergence needs to continue and intensify. Productivity in manufacturing is below the average of comparable regions and higher in services.
-
In terms of labour market performance, the unemployment rates have been decreasing over the past years and remain below the national average. Employment rates are higher in Jönköping and Kronoberg than nationally and lower in Blekinge and Kalmar. There is a concern about gaps between gender labour market outcomes. The gap in unemployment rate female vis-à-vis male is larger than the national gap. In terms of employment rates, the gap has been increasing against a declining trend in Sweden.
-
Kronoberg and Jönköping face a challenge of increasing housing prices.
-
There is some progress in internal accessibility, but mixed results are observable for external connectivity. There are notable improvements however in digital connectivity.
-
For human capital, the share of low-skilled workers in the labour force remains higher than nationally. This is an area of concern, although improvements have been achieved since 2017. For high-skilled labour, the gap with respect to the national level is a bit lower but remains an area of concern for Jönköping and Kalmar. Amongst these two, Jönköping has shown important progress.
-
In terms of innovation, research and development expenditures are high in Kronoberg and for patent intensity, all counties fare well with respect to comparable regions.
References
[23] Blekinge (2018), Länstransportplan för Blekinge 2018-2029 [County transport plan for Blekinge 2018-2029], http://www.regionblekinge.se/a/uploads/dokument/Strategidokument/Region_Blekinge_lanstransportplan_2018-2029_low_sidor.pdf (accessed on 30 January 2018).
[21] Boverket (2018), Öppna Data - Boverkets Bostadsmarknadsenkät [Open Data - Boverket's Housing Market Survey], https://www.boverket.se/sv/om-boverket/publicerat-av-boverket/oppna-data/bostadsmarknadsenkaten/ (accessed on 30 January 2018).
[24] Bredbandskollen (2017), Bredbandskollen Mobil Surfhastighet i Sverige 2017 [Broadband Mobile Mobile Surfing Speed in Sweden 2017], Bredbandskollen, Stockholm, https://www.iis.se/docs/Bredbandskollen_Mobilsurfhastighet_2017.pdf (accessed on 30 January 2018).
[25] Eurostat (2017), National Annual Road Freight Transport by Regions of Loading (NUTS 3) and by Group of Goods (1 000 t), from 2008 Onwards, https://ec.europa.eu/eurostat/web/products-datasets/product?code=road_go_na_rl3g (accessed on 08 January 2019).
[14] Grunfelder, J. (2018), “Nordregio regional potential index 2017 - Measuring regional potential”, in Grunfelder, J., L. Rispling and G. Norlén (eds.), State of the Nordic Region 2018, Nordic Council of Ministers, Copenhagen K, https://doi.org/10.6027/5c1aa4d5-en.
[10] Migrationsverket (2018), Översikter och Statistik från Tidigare år [Reviews and Statistics from Former Years], https://www.migrationsverket.se/Om-Migrationsverket/Statistik/Oversikter-och-statistik-fran-tidigare-ar.html (accessed on 31 January 2018).
[28] Myh (2018), Swedish National Agency for Higher Vocational Education, http://www.myh.se (accessed on 30 January 2018).
[3] OECD (2018), Economic Surveys: Sweden 2017, OECD, Paris.
[29] OECD (2018), OECD Statistics, Regional Economy, Regional GVA per Worker, http://stats.oecd.org/# (accessed on 30 April 2018).
[9] OECD (2018), Regional Demography, OECD Regional Statistics (database), https://doi.org/10.1787/a8f15243-en.
[13] OECD (2018), Regional Economy, OECD Regional Statistics (database), https://doi.org/10.1787/a8f15243-en.
[26] OECD (2018), Regional Innovation, OECD Regional Statistics (database), https://doi.org/10.1787/a8f15243-en.
[16] OECD (2018), Regional Labour, OECD Regional Statistics (database), https://doi.org/10.1787/a8f15243-en.
[17] OECD (2018), Regional Statistics, http://stats.oecd.org/Index.aspx?DataSetCode=REGION_DEMOGR (accessed on 31 January 2018).
[27] OECD (2017), Getting Skills Right: Skills for Jobs Indicators, Getting Skills Right, OECD Publishing, Paris, https://doi.org/10.1787/9789264277878-en.
[2] OECD (2017), OECD Economic Surveys: Sweden 2017, OECD Publishing, Paris, https://doi.org/10.1787/eco_surveys-swe-2017-en.
[22] OECD (2017), OECD Economic Surveys: Sweden 2017, OECD Publishing, Paris, https://dx.doi.org/10.1787/eco_surveys-swe-2017-en.
[6] OECD (2017), OECD Territorial Reviews: Sweden 2017: Monitoring Progress in Multi-level Governance and Rural Policy, OECD Territorial Reviews, OECD Publishing, Paris, https://doi.org/10.1787/9789264268883-en (accessed on 07 December 2017).
[18] OECD (2016), OECD Regional Outlook 2016: Productive Regions for Inclusive Societies, OECD Publishing, Paris, https://doi.org/10.1787/9789264260245-en.
[5] OECD (2016), OECD Reviews of Innovation Policy: Sweden 2016, OECD Reviews of Innovation Policy, OECD Publishing, Paris, https://doi.org/10.1787/9789264250000-en.
[20] OECD (2016), Regional Well-Being in OECD Countries: Sweden, OECD, http://www.oecd.org/cfe/regional-policy/hows-life-country-facts-sweden.pdf (accessed on 30 January 2018).
[7] OECD (2016), “Sweden”, in OECD Science, Technology and Innovation Outlook 2016, OECD Publishing, Paris, https://doi.org/10.1787/sti_in_outlook-2016-88-en.
[4] OECD (2013), OECD Reviews of Innovation Policy: Sweden 2012, OECD Reviews of Innovation Policy, OECD Publishing, Paris, https://doi.org/10.1787/9789264184893-en.
[1] OECD (2012), OECD Territorial Reviews: Småland-Blekinge, Sweden, OECD, http://www.oecdbookshop.org/browse.asp?pid=title-detail&lang=en&ds=&ISB=5k9h79jnzzxr (accessed on 23 December 2017).
[19] OECD (n.d.), OECD Regional Well-Being Database, http://www.oecdregionalwellbeing.org.
[12] Statistics Sweden (2018), Befolkningsstatistik i Sammandrag 1960–2016 [Population Statistics in Summary 1960-2016], https://www.scb.se/hitta-statistik/statistik-efter-amne/befolkning/befolkningens-sammansattning/befolkningsstatistik/pong/tabell-och-diagram/helarsstatistik--riket/befolkningsstatistik-i-sammandrag/ (accessed on 31 January 2018).
[8] Statistics Sweden (2018), Population by County, 1968-2016, http://www.statistikdatabasen.scb.se/pxweb/en/ssd/START__BE__BE0101__BE0101A/BefolkningNy/table/tableViewLayout1/?rxid=709a880a-2c74-413a-9dd8-dc463b18f609 (accessed on 31 January 2018).
[15] Statistics Sweden (2016), Arbetskraftsundersökningarna (AKU) [Labour Force Surveys], https://www.scb.se/hitta-statistik/statistik-efter-amne/arbetsmarknad/arbetskraftsundersokningar/arbetskraftsundersokningarna-aku/ (accessed on 30 January 2018).
[11] Statistics Sweden (2016), Migration by Region, Observations and Year, http://www.statistikdatabasen.scb.se/pxweb/en/ssd/START__BE__BE0101__BE0101J/Flyttningar97/table/tableViewLayout1/?rxid=2e9b16e6-5aa0-499b-b5fa-deb95fbc423f (accessed on 16 October 2018).
Notes
← 1. The report was approved by the OECD Working Party on Rural Policy of the Regional Development Policy Committee in November 2011.
← 2. The elderly dependency ratio in Jönköping, Kronoberg and Blekinge counties stood at 33.6, 34.5 and 38.9 respectively in 2016.
← 3. Nordregio’s Regional Development Potential Index highlights the strengths and weaknesses of the 74 Nordic regions in relation to one another and identifies the regions with the strongest development potentials. This data is also shared through NordMap, an interactive map tool dealing with demographic, labour market and accessibility issues in the Nordic countries.
← 4. The female labour force participation rates is calculated as the female labour force divided by the total female working-age population. The working-age population refers to people aged 15 to 64.
← 5. Regional Gross Value Added per worker for all industries in Stockholm was USD 102 370 in 2014 (USD per worker, current prices, current PPP), significantly above the national average at USD 84 346 and the highest among all Swedish regions (OECD, 2018[29]).
← 6. See https://www.oecdregionalwellbeing.org/ for comparison.