Assessment and recommendations
The Assessment and recommendations present the main findings of the OECD Environmental Performance Review of Australia and identify 50 recommendations to help Australia make further progress towards its environmental policy objectives and international commitments. The OECD Working Party on Environmental Performance reviewed and approved the Assessment and recommendations at its meeting on 6 November 2018. Actions taken to implement selected recommendations from the 2007 Environmental Performance Review are summarised in the Annex.
The statistical data for Israel are supplied by and under the responsibility of the relevant Israeli authorities. The use of such data by the OECD is without prejudice to the status of the Golan Heights, East Jerusalem and Israeli settlements in the West Bank under the terms of international law.
Environmental performance: trends and recent developments
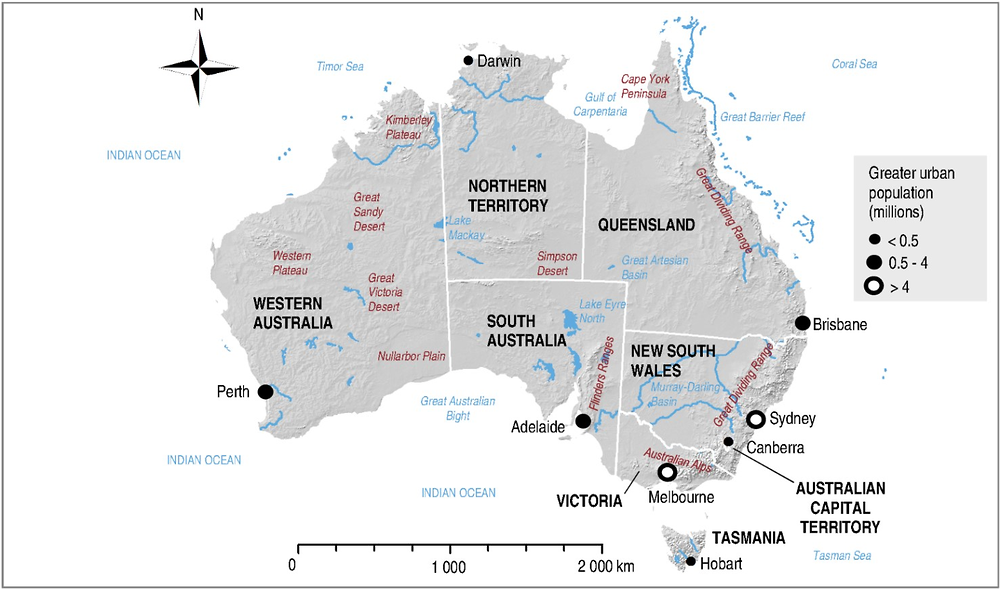
Australia, the world's sixth largest country, is endowed with a wide variety of natural resources (Figure 1). It is one of 17 megadiverse countries and among the top ten largest greenhouse gas (GHG) emitters in the OECD. It thus has an important role in global efforts to reach the objectives of the Sustainable Development Agenda, the Paris Agreement and the Convention on Biological Diversity. Australia has experienced the longest uninterrupted economic growth in the OECD. Building on its resource base and supported by strong institutions, it saw growth accelerate over the past decade with the commodities boom, characterised by rising export volumes and high investment. The global financial crisis slowed economic growth but did not result in recession. Gross domestic product (GDP) growth is expected to continue on a positive trend (OECD, 2018a). Australians enjoy high living standards and well-being as well as low levels of unemployment, although inequalities have been slightly increasing.
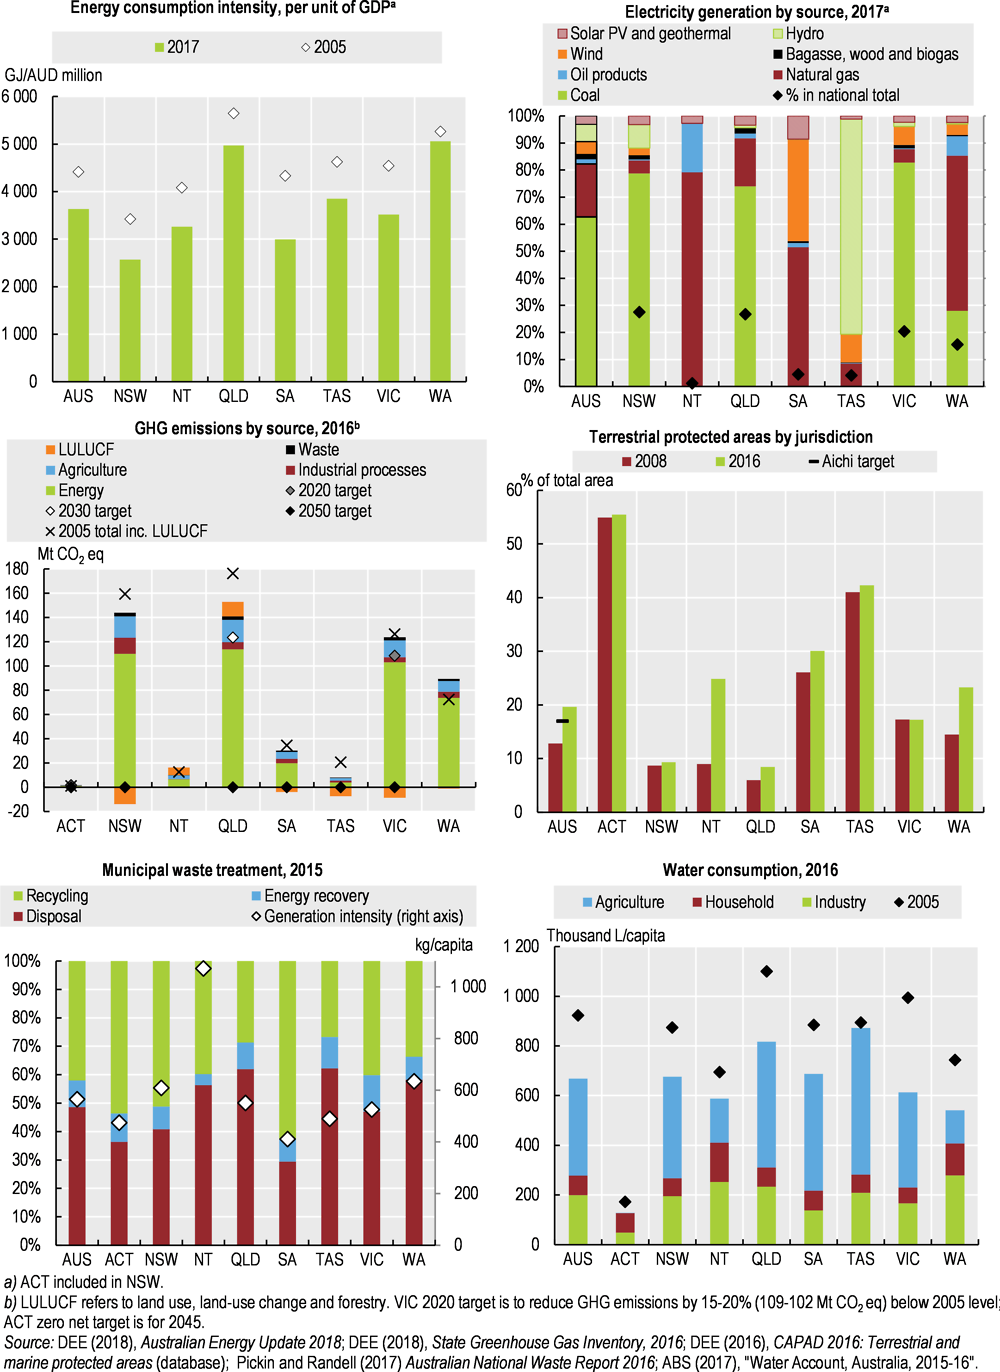
Australia has managed to decouple GDP growth from the main environmental pressures. States and territories have improved their performance in several environmental areas (Figure 2). However, the economy remains highly reliant on the extraction of natural capital. Australia has one of the most resource- and carbon-intensive OECD economies. Economic activity and population growth are putting continued pressure on the environment, especially on water resources and biodiversity. Climate change adaptation is a growing challenge.
Transition to a low-carbon and energy-efficient economy
In the past decade, Australia’s economy has gradually become less energy intensive as a result of structural changes. However, it remains highly carbon intensive owing to its reliance on coal, despite the increasing use of natural gas and renewable energy sources, in particular solar and wind power. The country is on track to meet its 2020 target on large-scale renewable energy, although the share of electricity generation from renewables remains below the OECD average. Over 2005-17, GHG emissions (excluding emissions from land use, land-use change and forestry [LULUCF]) increased (Figure 3). Emissions from energy industries, the largest emitting sector, remained broadly constant: the decline of emissions from electricity generation1 was offset by the rapid increase of emissions from natural gas production. Emissions from transport, the second largest source of emissions, increased, while emissions from agriculture declined. Emissions from LULUCF decreased, driven by the decline in emissions from forest conversion.
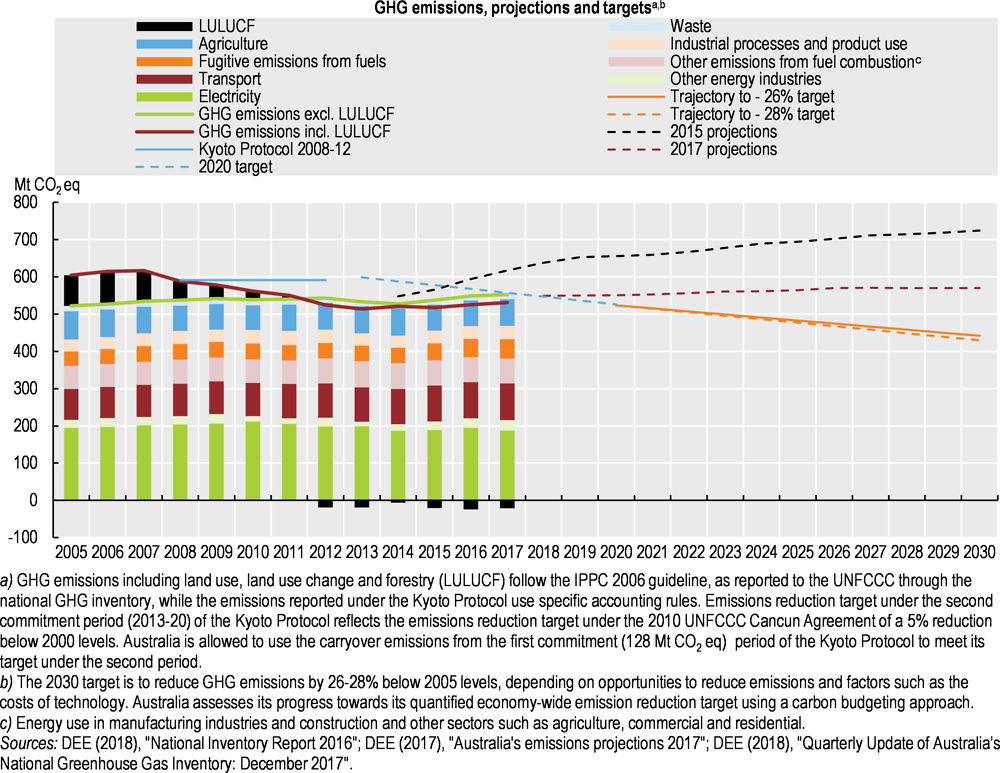
Australia surpassed its Kyoto 2008-12 target and is on track to reach its 2020 target.2 Under the Paris Agreement, Australia committed to reducing emissions (including emissions from LULUCF) by between 26% and 28% below 2005 levels by 2030 although the Climate Change Authority3 had recommended stricter targets (between 45% and 65% below 2005 levels by 2030) (CCA, 2015). Australia needs to intensify mitigation efforts to reach its Paris Agreement goal: emissions are projected to increase by 2030 (DEE, 2017a) (Figure 3). Several states and territories have committed to reaching net zero GHG emissions by 2050. The Commonwealth government, in co-operation with states and territories, should, and committed to develop a long-term low-emission strategy in line with the Paris Agreement. The 2015 Energy White Paper, which was elaborated before Australia ratified the Paris Agreement in 2016, should be reviewed to integrate Australia’s 2030 climate target.
The issue of climate has been a catalyst for political instability in the past decade. In 2017, the government conducted a climate policy review, supported by a broad range of experts. After considering several policy options for cost-effective power sector decarbonisation, the government proposed a National Energy Guarantee (NEG), a market-based mechanism requiring electricity retailers to contract low emission and dispatchable power.4 However, no consensus was reached and the opportunity to provide a stable policy framework for the electricity sector, which is not subject to emission reduction constraints, was lost.
Australia has adopted a piecemeal approach to emission reduction with various instruments such as the Emissions Reduction Fund (ERF), the Renewable Energy Target, the Clean Energy Finance Corporation and the Australian Renewable Energy Agency (Section 3). States and territories have their own policies and instruments such as feed-in tariffs and auctions to promote renewables and white certificate schemes for energy saving. The government needs to streamline its approach and clarify how existing and new instruments can be scaled up to reach the Paris Agreement goals.
Since 2014, the main Commonwealth government instrument to mitigate climate change has been the ERF, a voluntary offset programme. The government committed AUD 2.55 billion to the ERF to purchase carbon abatement through competitive auctions. The ERF is open to all sectors but the majority of delivered carbon abatement currently relates to vegetation management and landfill gas abatement and capture. The ERF has been found successful in incentivising new domestic abatement (CCA, 2017). However, it involves costs for the federal budget. While the ERF has strong governance and integrity measures, it is important to ensure that projects are additional to business as usual and that emission reductions are permanent. As the ERF is running out of funds (AUD 250 million remains), it is unclear whether other measures could drive demand for domestic credits in the land sector. Since 2016, the ERF safeguard mechanism has required large emitters to offset emissions exceeding a baseline, in most cases determined as the highest historical level. The safeguard is underpinned by a robust measurement, reporting and verification framework. With stricter baselines, it could provide an effective incentive to reduce emissions. However, the government should clarify its role in meeting climate targets.
Australia is particularly vulnerable to climate change. Rising sea level, floods, heat waves, bushfires and drought are expected to have an increasingly adverse impact on the economy, society and biodiversity (CSIRO/BOM, 2015). Climate change has been identified as a key threat to Australia's security and prosperity (DFAT, 2017). The country is well-equipped to evaluate climate risk and future impact, and its work on climate science for the southern hemisphere is highly valued. However, continued government funding for provision and dissemination of climate information will remain essential to manage risk (e.g. through the Commonwealth Scientific and Industrial Research Organisation, the Bureau of Meteorology, the National Environmental Science Program and state agencies). Funding for the National Climate Change Adaptation Research Facility ceased in 2018.
Air emissions have been decoupled from economic activity but emission intensity remains high, driven by industrial and transport activities (OECD, 2018b). Although exposure to particulate matter and ozone is generally low in Australia, some city centres (Sydney, Melbourne, Perth) are exposed to higher levels of these air pollutants due to concentrated passenger vehicle use (Keywood et al., 2017). Other sources, which vary by region and time, include domestic heating and landscape fires. Premature deaths caused by air pollution are estimated to have cost 1.2% of GDP in 2016 (OECD, 2018c). Under the National Clean Air Agreement, the country strengthened its reporting requirements for particulate matter, and it introduced the Product Emissions Standards Act in 2017.
Transition to efficient resource management
Australia is among the world's largest exporters of iron ore, uranium, coal, gold and natural gas. It is one of the most resource-intensive5 OECD countries due to its high level of extraction and use of metal ores and fossil energy materials. The intensity is even greater when accounting for unused material, such as mining overburden, associated with raw material extraction, which is particularly high for coal and metals. While domestic material consumption remained stable over 2005-17, extraction of metals and fossil energy materials for export increased faster than GDP.
The recent decision by the People’s Republic of China (hereafter “China”) and other countries to restrict waste imports, combined with challenges related to management of certain waste streams (plastic and paper, coal seam gas, electronics, hazardous waste), represents an opportunity to progress towards a reduce-reuse-recycle hierarchy, strengthen local markets for recycled materials, create local employment and improve the way that waste is managed. Australia’s environment ministers recently agreed to update the 2009 Waste Strategy to incorporate circular economy principles. They reaffirmed their commitment to halving Australia’s food waste by 2030. All states and territories have adopted waste management strategies, and waste is increasingly managed across jurisdictions. Waste generation has slightly increased over the last decade and so have rates of recovery (recycling and energy recovery), though the latter vary by jurisdiction and waste stream (Figure 2). The level of municipal solid waste generation per capita has decreased but is still higher than the OECD average.
The national White Paper on Agriculture Competitiveness calls for boosting productivity and profitability in the agricultural sector by enhancing resource efficiency (Australian Government, 2015). The impact of irrigation efficiency projects on return flows (the volume of water that flows back to streams and helps replenish groundwater) is subject to debate (Productivity Commission, 2018). Because there has been no systematic assessment of this impact, some experts have argued that the reduction in recoverable return flows may exceed the amount of water saved – i.e. that no “real” water has been recovered for the environment through government infrastructure programmes. A recent expert review found that the reduction in return flow was smaller than expected and recommended continuing to monitor return flows (from all causes) (Wang, 2018). Over 2010-16, irrigated area and water used for irrigation increased, likely due to increased water availability (ABS, 2018a). Water and energy use per unit of agricultural production is higher than it was at the end of the Millennium Drought (1996-2010) (ABS, 2018b). The use of fertilisers and pesticides has risen significantly in the past decade (OECD, 2018d). There is insufficient monitoring of the impact of agriculture on water quality (OECD, 2015) and on soil erosion (OECD, 2013a).
Management of natural assets
Land use in Australia has been shaped by the pattern of European settlement, the availability of water, and the type of soil and climate (Metcalfe & Bui, 2017). Competition for use between agriculture, urban development, habitat conservation and resource industries makes integration of environmental considerations in land use planning a key issue (Section 2). More than half of Australia’s land area is used for agriculture, although the area has declined since 2005. Forests, mainly in Queensland and New South Wales, cover 16% of the country. Although forest cover has increased with regrowth (DEE, 2018c), clearing (mainly for livestock farming) remains a major source of concern for biodiversity (Section 4). Large cities continue to expand into natural areas, despite increased urban densification, and Australia has the highest built-up area per capita in the OECD (OECD, 2017).
Australia is one of 17 megadiverse countries (Section 4). Although gaps in knowledge hamper proper assessment, the status of biodiversity is considered poor and worsening (Cresswell and Murphy, 2017). Further efforts in monitoring are needed to support policy making (Section 4). The country has surpassed the 2020 Aichi targets on protected areas.
Australia is the driest inhabited continent. Water stress at the national level is below the OECD average but resources and use vary widely, with certain regions under serious stress. It will be a challenge to meet demand from rapidly increasing population in places where precipitation is projected to decline (Productivity Commission, 2017a). The 2004 National Water Initiative (NWI) aims to increase efficiency and sustainability through continued market reform, regulation and planning. The 2007 Water Act seeks to address the allocation imbalance between environmental and consumptive uses in the Murray-Darling Basin. Despite progress in implementing the NWI, the Northern Territory and Western Australia have yet to introduce statutory-based water rights, while Western Australia still needs to establish specific mechanisms for engaging Indigenous people in water planning. In some areas, major water uses (e.g. by extractive industries) are not yet part of the allocation framework.
Where climate change effects are expected to be significant, water plans should be regularly reviewed to ensure the right balance between environmental and consumptive uses. In the Murray-Darling Basin, progress has been made in recovering water for the environment. About 20% of water entitlements are managed for the environment, with some evidence of positive outcomes. However, reaching the 2024 recovery target will be a challenge (Productivity Commission, 2018). Although compliance with overall extraction limits is maintained across the basin as a whole, poor compliance in some states puts the integrity of entitlement systems at risk. Concerns about backsliding as well as future challenges of population growth and climate change justify a renewed commitment to the NWI.
Water abstraction has exacerbated diffuse water pollution from contaminants. Although information is incomplete, water quality in most drainage divisions is poor (Argent, 2017). Improving water quality is a priority in the Great Barrier Reef catchments, which suffer from high levels of run-off from sediments, nutrients, pesticides and other pollutants (Waterhouse et al., 2017). Further effort is needed to improve agricultural practices and meet water quality targets in the Great Barrier Reef (Australian and Queensland Governments, 2017). Good progress has been made in delivering safe drinking water. Most utilities, other than a few in remote areas, achieve full compliance with the Drinking Water Guidelines.
Climate change and air quality
Stabilise and strengthen climate-change policy. Develop and implement a national, integrated energy and climate policy framework for 2030 based on a low-emission development strategy for 2050, in line with the Paris Agreement objective. Guide the energy transition through an emission reduction goal for the power sector supported by a market-based mechanism. Identify the expected contribution of each sector, the states and territories, renewables and energy efficiency in meeting climate goals. Strengthen the evidence base for assessing the economic, environmental and social impact of mitigation options.
Clarify the role of the Emissions Reduction Fund and safeguard mechanism in meeting climate targets, along with their interaction with other instruments, so as to avoid overlap and ensure cost-effective emission reduction. Regarding projects credited under the Emissions Reduction Fund, continue to maintain their integrity and ensure their additionality and permanence. Gradually lower the safeguard emission baselines and consider expanding the system to smaller facilities.
Swiftly update standards on fuel quality and vehicle emissions, including CO2 and other pollutant emissions, on a par with global best practices.
Waste management
Update and implement the National Waste Policy as part of a broader strategy on circular economy, with measurable targets.
Improve consumption of recycled content materials and re-manufactured products arising from waste streams generated in Australia.
Expand the scope and improve standardisation of national waste data. Update the 2010-11 Waste Account, integrating material flow analysis to monitor progress towards a circular economy.
Water management
Renew governments’ commitment to the National Water Initiative. Create statutory-based entitlement and planning arrangements, and improve mechanisms for engaging Indigenous people in water planning, in all states and territories. Include all major water uses in entitlement and planning frameworks. Integrate climate change impacts in water planning.
Continue to improve monitoring of water resources, abstraction and quality across basins. Continue to monitor and improve understanding of return flows in the Murray-Darling Basin.
Address diffuse pollution from agriculture with a strengthened policy mix of instruments: regulatory (e.g. minimum technology and performance standards), economic (e.g. payments for ecosystem services, pollution taxes and charges, water quality trading) and voluntary (e.g. information campaigns, training); accelerate efforts to reach water quality targets in the Great Barrier Reef.
Environmental governance and management
Institutional framework
Australia is a federal country in which environmental responsibilities are shared between the Commonwealth (federal) government, six states and two territories, and over 560 municipalities. Political cycles are relatively short, which can hamper long-term policy planning. States and territories have had the leading role in environmental protection since the 1992 Intergovernmental Agreement on the Environment, which defines responsibilities between the federal and subnational levels.
The federal government’s role on environmental issues is to regulate so-called “matters of national significance”, which include heritage places (natural, historic and Indigenous areas), wetlands, threatened species and certain marine zones. While progress has been made since the 2007 OECD Environmental Performance Review (EPR) on co-ordination and guidance between levels of government, the 2016 State of the Environment Report points out that more efforts are needed to strengthen vertical co-ordination between the Commonwealth and states/territories (OECD, 2007). The coastal zone and several other issues are managed through a multilevel approach that has overlaps and gaps. Horizontal co-ordination across federal departments and agencies dealing with environmental issues has been identified as an area that could be improved (Jackson et al., 2017). There are major shortcomings in the current institutional and governance arrangements in the Murray-Darling Basin, which cause implementation gaps regarding the basin plan (Productivity Commission, 2018).
Regulatory framework
The Environment Protection and Biodiversity Conservation (EPBC) Act (1999) is the key piece of Commonwealth legislation on environmental management. It provides a national framework for environment and heritage protection and biodiversity conservation. The federal government conducts ex ante regulatory evaluation using Regulation Impact Statements (RISes), which are more or less detailed depending on the expected impact of the measure. Full RISes are based on cost-benefit analysis that accounts for economic, social and environmental effects. Ex ante assessments are also regularly conducted by states and territories. Federal agencies undertake post-implementation reviews for changes to legislation that have a significant impact on the economy. Other forms of ex post evaluations are yearly operational reports and independent reviews of specific legislation, including the EPBC Act.
Environmental impact assessment (EIA) is not binding for permitting decisions in all states and territories. At the federal level, EIA is conducted for matters of national significance. To avoid duplication, the government has committed to a one-stop-shop policy for environmental approvals. States can enter bilateral agreements with the federal government in which the latter delegates assessment and/or approval of projects entirely to the state level. This policy helps reduce overlap between the federal and state/territory levels and achieve economic benefits in terms of reduced regulatory burden.
The EPBC Act includes provisions for strategic environmental assessment (SEA). SEA at the federal level is undertaken for large-scale plans related to land use, such as housing and infrastructure developments, plans related to resource management and policies concerning the industrial sector. As part of the one-stop-shop approach, SEA takes the form of an agreement between the federal government and the entity responsible for implementing a policy, plan or programme (DEE, 2017b).
Australia lacks a fully integrated permitting regime, although some states (Queensland, South Australia) have introduced consolidated permits based on set conditions that cover multiple forms of environmental impact. This kind of integration does not always account for the application of best available techniques and can thus hamper a more holistic management of the production process (EPA South Australia, 2017, Queensland Government, 2017).
States and territories have principal responsibility for land planning and management, in co-operation with local governments. They generally have dedicated laws and departments to regulate land use. In New South Wales, the most populous state in Australia, the two land planning instruments have some elements of SEA. Reliance on SEA elements is evident in current metropolitan and regional planning initiatives.
A 2007 EPR recommendation called on Australia to improve integration of Indigenous peoples in natural resource management. The government has increasingly engaged Indigenous communities in management of areas that are not under Indigenous ownership, such as national parks and marine parks. Indigenous peoples were extensively consulted in the development of management plans for marine parks. In addition, the country has 123 Commonwealth-funded Indigenous ranger groups, as well as some state/territory-funded groups, patrolling, managing and monitoring aboriginal land areas. New South Wales has several initiatives in place, including joint management of national parks and involvement of local Indigenous land councils in spatial planning. In early 2018, New South Wales developed the draft Aboriginal Cultural Heritage Bill, aimed at improving Indigenous heritage management. Still, efforts could be further strengthened to involve Indigenous communities more systematically and effectively in strategic land and marine planning by, for example, seeking greater Indigenous input at early stages of planning (Metcalfe & Bui, 2017).
Compliance assurance
Australia has made progress in implementing the 2007 EPR recommendation to strengthen enforcement. The federal Department of the Environment and Energy (DEE) has developed a policy that outlines the objectives and guiding principles of the compliance and enforcement system. DEE uses a risk-based approach to plan compliance monitoring. States and territories are responsible for monitoring compliance with regulations under their jurisdiction. Some states, including New South Wales, Victoria and Western Australia, also use risk-based targeting to inform environmental inspections (DEE, 2016a).
The EPBC Act provides enforcement mechanisms through administrative, civil and criminal sanctions. Courts can impose a range of civil enforcement measures, including directed audits, remediation orders and other injunctions, enforceable undertakings, and fines. States and territories apply different enforcement tools. New South Wales and Victoria, for instance, developed a method for calculating and recovering economic benefits arising from the breach of an act. This tool is now available to other jurisdictions.
The Commonwealth and states/territories can order measures to prevent, mitigate and remediate environmental damage. The EPBC Act provides for the possibility of requiring operators to furnish financial security to cover potential liability. Voluntary liability insurance is available in every state but usually covers only third-party property damage and injury. It can be complemented by environmental impairment insurance covering liability resulting from gradual or pre-existing pollution, along with land and water cleanup costs.
There are around 50 000 abandoned mines on public and private land that are in need of rehabilitation. Past contamination is generally the responsibility of states and territories, and procedures for investigation and remediation of contaminated land vary by jurisdiction. Not all states and territories maintain comprehensive registers of contaminated sites or have remediation standards, and many jurisdictions are struggling with resource constraints in their cleanup efforts. The Commonwealth has developed a National Environment Protection Measure to inform site contamination assessment; it provides guidelines on investigating soil and water pollution (Metcalfe & Bui, 2017). In addition, the Energy Council of Australian Governments has recently endorsed seven principles for proper rehabilitation of mining sites, which focus on ensuring a nationally consistent approach with robust financial provisions.
In line with a 2007 EPR recommendation, Australia has made progress in expanding voluntary agreements with industry, in which participating sectors or companies commit to specific measures and/or performance levels on environmental management. The main ones focus on GHG emission abatement, consumer packaging reduction, sustainable agricultural practices and biodiversity conservation. There is also a voluntary programme to support Indigenous communities in protecting land or sea areas under their administration.
Australian businesses are increasingly adopting environmental management systems. Four states offer incentives for ISO 14001 certification, such as permit fee reductions and longer permit validity periods. Progress has been made in implementing the 2007 EPR recommendation to continue integrating environmental objectives into public procurement, predominantly at the state/territory level. In South Australia, for example, government agencies must address sustainability criteria in public procurement of goods and services. Victoria’s Municipal Association delivers procurement training for councils. Queensland requires all councils to adopt a procurement policy (Zeppel, 2014).
Environmental democracy
The Freedom of Information Act (1982) and subsequent legislation implement the government’s commitment to open government and better access to and use of government-held information. States and territories grant access to environmental information on specific issues within their jurisdiction. State of environment reporting is conducted at both the federal and state/territory levels. Subnational reporting differs in length and content between states/territories and is often not harmonised with the national report, as the 2007 EPR also noted. There is a national pollutant inventory, which should be updated (Section 5).
Public participation in environmental decision making could be strengthened to provide broader opportunities for stakeholders, in particular Indigenous communities. In addition, non-government organisations (NGOs) and business associations raised concern that three bills before Parliament in 2018, aimed at regulating foreign interference in the electoral process, would indirectly restrict organisations’ public participation.
Under the EPBC Act, citizens and organisations have a right to bring environmental matters before courts. According to common law principles, applicants need to demonstrate a special interest to claim legal standing, although in practice NGOs are granted standing in environmental cases. There are limited mechanisms to reduce financial barriers to justice on environmental matters. South Australia, for example, provides support to the Environmental Defender’s Office SA Inc. Some states, such as New South Wales, Queensland, and South Australia have, dedicated environmental courts.
Education in Australia is primarily the responsibility of states and territories. Federal and state frameworks for early childhood education provide guidance on teaching environmental protection and socially responsible behaviour. As the 2007 EPR recommended, there are ongoing reviews to ensure that vocational education programmes related to environmental regulation and policies respond to industry needs. There are also special schools for judges in states that have environmental courts.
Institutional framework
Strengthen horizontal co-operation across sectors and vertical co-ordination between levels of government (federal, state/territory and local) to avoid inconsistencies and overlaps in environmental management.
Streamline and clarify institutional arrangements in the Murray-Darling Basin; encourage basin governments to take joint responsibility in implementing the basin plan with sufficient resources.
Regulatory requirements
Consider introducing integrated environmental permits, based on best available techniques, for large industrial installations in all subnational jurisdictions.
Ensure systematic use of EIA in all states and territories, and make its conclusions binding for project permitting decisions; consistently integrate environmental considerations in land use plans.
Compliance assurance
Develop comprehensive registers of contaminated sites and cleanup programmes; support such programmes with remediation standards and adequate financial resources (consider requiring new mines to pay into a liability fund); ensure a national level playing field on provisions for post-operation remediation.
Expand the practice of assessing and recovering economic benefits of non-compliance in determining civil penalties throughout the country.
Further enhance promotion of compliance and green business practices through voluntary agreements and public procurement; consider expanding policy incentives (such as permit fee reductions) for environmental management certifications in all jurisdictions.
Environmental democracy
Ensure that all stakeholders have opportunities to participate in environmental decision making throughout the policy cycle; enhance early engagement of NGOs and Indigenous communities.
Harmonise the collection and reporting of key statistics across states and territories to facilitate reporting at the national level.
Consider introducing mechanisms to offer NGOs financial support for legal costs to facilitate access to justice on environmental matters.
Towards green growth
Framework for sustainable development
Australia’s 2018 report on the implementation of the Sustainable Development Goals (SDGs), the first voluntary national review on the 2030 Agenda for Sustainable Development, identifies successes (e.g. on international co-operation, trade and water) and challenges (e.g. regarding sustainable cities and the needs and aspirations of Indigenous people) and showcases best practices (Australian Government, 2018a). Progress is ongoing to populate the SDG indicators. However, Australia has not conducted a quantified synthetic analysis of progress nor defined a timeline for implementation. The country could build on this review to revive and update the 1992 National Strategy for Ecologically Sustainable Development.
With some exceptions (e.g. the Infrastructure Plan), environmental concerns are not prominent in major sector strategies (e.g. white papers on energy, agricultural competitiveness, foreign policy), and economic interests still tend to dominate decision making (Section 4). The merger of portfolios in the Department of Agriculture and Water Resources and DEE was a positive step to align policies. Despite progress in decoupling, there is doubt about the capacity of Australia’s natural capital to continue providing the services required to support its economy and well-being in the longer term. Australia is a global leader in environmental-economic accounting and has made progress in adopting a common national approach in this area (Australian Government, 2018b). Further steps could be undertaken to use these accounts for policy decision making. More broadly, improving environment-related information will help strengthen public trust in environmental policies that are often subject to highly politicised debates.
Greening the system of taxes, charges and prices
Progress in using economic instruments to internalise environmental costs, as recommended in the 2007 EPR, has been mixed. While Australia’s fiscal position is sound and the tax/GDP ratio is low, shifting the tax mix from direct taxation to less distorting taxes on consumption, including on energy products, could support economic growth and help tackle climate change and other environmental challenges. Between 2005 and 2016, revenue from environmentally related taxes declined as a share of GDP, mostly due to the decreasing contribution of energy taxes to tax revenue, except when carbon pricing was in effect in 2012 and 2013.
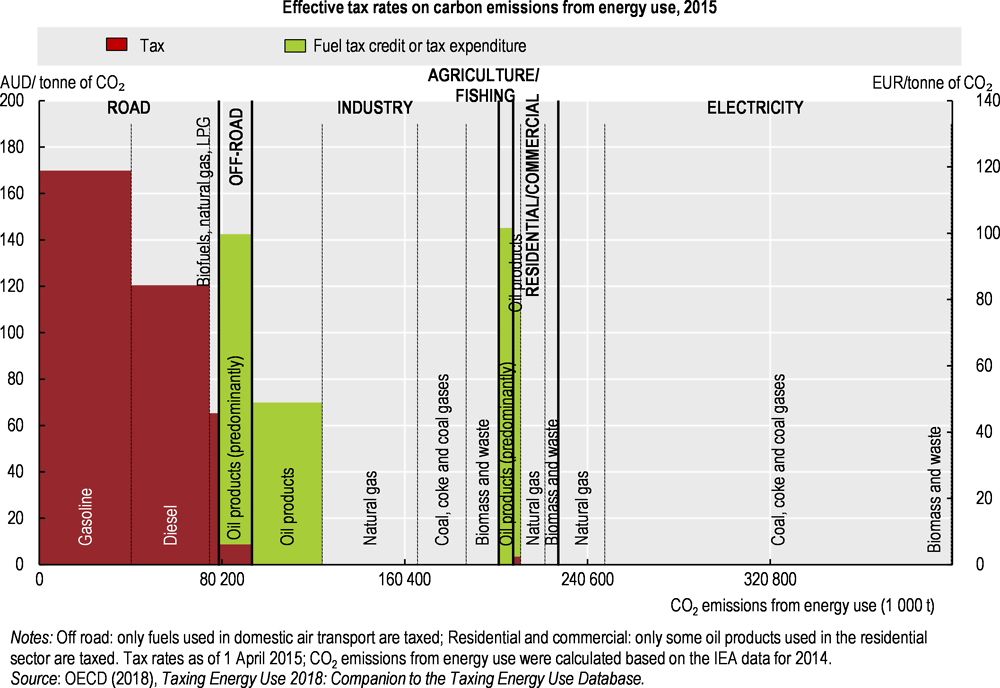
Overall, energy taxes do not reflect the climate costs of fuel use. Although in principle, excise taxes apply to natural gas for road use and oil products in all sectors, in practice, due to tax refunds, fuels are largely untaxed outside of transport (Figure 4). Fuels used to generate electricity benefit from a full rebate on the excise tax and coal is fully untaxed. Australia is one of the few OECD countries taxing diesel and petrol at the same nominal rate, yet diesel is less taxed on a carbon basis and road fuel taxes are in the lower range among OECD countries. Low energy tax rates charged on a narrow base resulted in only 20% of carbon emissions being priced above EUR 30 per tonne of CO2 (a conservative estimate of the climate damage from one tonne of CO2 emissions) in 2015. Australia has the second highest carbon pricing gap6 in the OECD at EUR 30 per tonne of CO2 (OECD, 2018e).
Revenue from transport taxes has increased significantly since 2005, driven by growth in the vehicle fleet, which is less fuel efficient than in most G20 economies (IEA, 2017). While fuel taxes are best suited to reduce CO2 and other pollutant emissions, vehicle taxes can promote fleet renewal towards cleaner vehicles. States and territories apply different rates of registration fees and stamp duty. These generally vary with vehicle size and price. A federal luxury car tax on the sale or import of cars has a higher threshold for fuel efficient vehicles irrespective of fuel type. In practice, the tax favours diesel vehicles, which are more fuel efficient but emit more CO2 and harmful air pollutants per litre of fuel. As vehicles become more efficient, increased reliance on distance-based charges will better address road transport externalities and provide stable revenue (OECD, 2018f). Fixed rate is the main form of charging on the country’s 16 toll roads. Under the ongoing reform of policies regarding heavy vehicles, pilot road charging programmes will inform the design of reform options. The fiscal treatment of personal use of a company car favours road use over other modes of transport. Until 2011, the Fringe Benefits Tax unintentionally encouraged car use because its rate fell as kilometres travelled rose. The tax was reformed in 2011 but the current system, which applies a single rate regardless of kilometres travelled, continues to create an incentive for employees to drive more. No such concession applies on commuting expenses for public transport or bicycles, although exemption applies in limited circumstances for travel by bus.
There are no longer any significant measures supporting fossil fuel production (OECD, 2013b). However, support to fossil fuel consumption7 has increased significantly, representing 43% of energy-related tax revenue in 2016, a high share by OECD standards (OECD, 2018g) (OECD, 2017). This is mainly due to the Fuel Tax Credits programme, which refunds off-road users the full amount of excise tax and gives a partial rebate to on-road heavy transport. Mining industries are the main beneficiaries, followed by transport and agriculture. In addition, most states and territories provide rebates to low-income households to compensate for the cost of heating or cooling, in addition to bill assistance. Providing direct support to vulnerable households, decoupled from energy use, and setting tax rates at levels that better reflect the environmental cost of energy use would be more efficient in addressing environmental and equity concerns (Flues and Van Dender, 2017). There is no comprehensive information on potentially environmentally harmful subsidies and tax expenditure in Australia.
There are concerns that the Petroleum Resource Rent Tax (PRRT) is not providing Australians with an equitable return on petroleum resource development. Low international oil prices, declining production in mature projects and increasing deductible expenditure from major new investment in LNG production have caused a decline in PRRT revenue. A review commissioned by the Treasury recommended that the government update the PRRT, with no result so far (Callaghan, 2017). Australia repealed the Mineral Resource Rent Tax in 2014 despite the OECD Economic Survey recommendation to broaden its scope (OECD, 2014).
Adopting a national consistent framework for landfill levies would help improve the effectiveness of waste management policies. The uneven application of state levies has resulted in significant levels of interstate movement of waste to avoid levies (The Senate, 2018). With China’s recent restrictions on waste imports, industry and local governments are calling for state-level support through earmarking of a bigger share of landfill levy revenue. In real terms, revenue from landfill levies quadrupled over 2005-16 (OECD, 2018h) but little is allocated to waste management (Ritchie, 2017). Earmarking could be justified to face the current crisis, but it could reduce the flexibility and efficiency of revenue allocation. Combining landfill levies with variable pricing for municipal waste services would increase the effectiveness of the pricing instrument, encourage waste minimisation and recovery, and fund advanced management services. As waste charges are typically imposed at a flat rate, there is a weak link between quantity and cost in municipal waste disposal. Since 2012, a national product stewardship programme for televisions and computers has provided tangible outcomes but has been limited in scope.
Australia has been a global frontrunner in using markets to allocate scarce water resources to higher-value uses. Water trade expansion has given irrigators increased flexibility to respond to fluctuating climatic and market conditions, which proved beneficial during the Millennium Drought (Productivity Commission, 2017a). However, information deficiencies regarding water resources and prices undermine the efficiency of water markets. There is some evidence that government purchase of water entitlements for the environment has delivered ecological outcomes. However, there is room to improve monitoring and reporting to ensure that environmental water management maximises environmental outcomes.
Overall public support to agriculture is low compared with other OECD countries (OECD, 2018i). Most distorting market price support has been removed. Producer support8 is mainly directed at upgrading on-farm water infrastructure and dealing with drought. Since 2007, the share of general services in total support has nearly doubled, driven by increased government funding for irrigation infrastructure, especially in the Murray-Darling Basin. This investment has been an important part of the environmental water recovery programme in the basin. However, the extent of the water-saving effect of irrigation investment requires further investigation (Productivity Commission, 2018). Inadequate cost-benefit analyses have resulted in several projects with poor financial and environmental performance being funded by governments. In many cases, support was provided for the private benefit of irrigators (Productivity Commission, 2017a). Similarly, support to risk management measures should be reviewed to ensure that they effectively boost drought preparedness and resilience (OECD, 2018i).
Investing in the environment to promote green growth
Government expenditure on environmental protection rose from 0.6% of GDP in 2005 to 1.0% in 2013, before decreasing to 0.9% in 2015 due to a decline in Commonwealth spending (OECD, 2018j). The most affected areas are difficult to identify, as no breakdown of expenditure data by environmental domain is available. Australia does not produce regular environmental expenditure accounts (ABS, 2014).
Since 2008, expenditure on urban water supply has increased by 50%, reflecting rising operating expenditure. The average annual household water bill could double over 2017-40 (Infrastructure Australia, 2017). The separation of urban water service delivery from policy making and regulation through the corporatisation9 of water utilities, and the introduction of independent economic regulation in many major urban areas, has improved efficiency, increased transparency of investment decisions and promoted more efficient pricing (Productivity Commission, 2017a). The widespread introduction of consumption-based pricing has contributed to more efficient water use. However, progress has varied across the continent. There is evidence of underpricing in regional New South Wales,10 Queensland and Tasmania. Some providers in regional New South Wales, the Northern Territory, Queensland and Western Australia are not subject to independent economic regulation. The Commonwealth, New South Wales and Queensland governments support some urban water providers to address affordability concerns through capital grants, although these are generally poorly targeted (Productivity Commission, 2017a). While the need for major augmentation of urban water infrastructure has fallen since the Millennium Drought, climate change and population growth will require significant investment. Improved planning and decision making are needed to ensure that future investment is cost-effective, which has not always been the case. Decentralised approaches to water service provision could provide valuable alternatives to centralised systems.
Record investment in renewable energy in 2017 will help Australia achieve the 2020 national large-scale renewable energy target and put the country among global leaders for newly installed solar photovoltaic capacity. This achievement was driven by cost reductions, the setting of a renewable energy target, and a related quota system combined with state incentives and federal support through the Clean Energy Finance Corporation (AUD 10 billion over 2013-17) and the Australian Renewable Energy Agency (AUD 1.9 billion over 2013-22). Australia is one of the few OECD countries with a national green investment bank that is focused on scaling up investment in clean energy and energy efficiency. Greater visibility is needed with regard to the role and contribution of renewables in emission reduction. Geographically uneven renewable deployment raised integration concerns in the weakly interconnected National Electricity Market, with most wind and solar being deployed in South Australia. States and territories with greater ambition on GHG emission reductions for 2030 are expected to continue to operate parallel support systems for renewables. Further efforts are needed to improve energy efficiency. The National Energy Productivity Plan does not specify the savings expected from its measures or their contribution to GHG emission reduction. Measures with great potential – such as energy prices that reflect social and environmental costs, efficient vehicles, and updated energy efficiency requirements in the National Construction Code (to be updated in 2019) – remain to be implemented.
In the past ten years, more than three-quarters of transport investment has been directed to the construction of roads. In 2016, road investment accounted for 1.1% of GDP, a higher share than in any other OECD country (OECD, 2018k). Redirecting funding to public transport would make cities more sustainable. Despite progress, Australian cities have less travel by public transport than similar cities elsewhere (Arcardis, 2017). Carefully planned and prioritised investment in transport infrastructure is needed to address this challenge. Despite progress in project selection, there are cases where economic assessment is over-ridden by other factors, and much public investment is not subject to ex post evaluation (Infrastructure Australia, 2018). More efficient use of existing transport infrastructure and better integration of transport services are also needed (Productivity Commission, 2017b). State and local governments have been active in developing metropolitan plans but there is room to better link transport modes and integrate transport and land use planning. With the decline of receipts from fuel excise, maintaining and developing the road network will impose an increasing burden on government budgets. Wider use of road pricing would better address road transport externalities and secure long-term funding for infrastructure. It would also enhance transport planning by improving the responsiveness of expenditure to user preferences.
Promoting eco-innovation
Australia has a highly skilled workforce and strong science base, with several world-class universities and high-quality scientific publications. However, there is scope for improving co-operation between research and industry and strengthening international co-operation. The R&D Tax Incentive is the key instrument to boost innovation. Large domestic firms, especially in the primary and resource-based industries, are important drivers of innovation.
Climate change and associated risks, combined with inadequate investment in innovation, were rated by a previous government as posing the highest risk to Australia's prosperity (Department of Industry, 2013). The 2017 Low Emissions Technology Roadmap identified opportunities to tackle Australia’s challenges and help other countries decarbonise (Campey et al., 2017). These include technology for addressing growing fugitive emissions (e.g. ventilation-air methane abatement, carbon capture and storage [CCS]) and accelerating use of renewables (e.g. geothermal, wave energy). Implementing the roadmap and driving eco-innovation in general will require a clear long-term policy framework, clear price signals and secured government support to R&D.
Government support to energy R&D followed an upward trend until 2013, then declined significantly. Spending on environmental R&D has decreased continuously since 2009. As part of the international initiative Mission Innovation, Australia pledged to double public investment in clean energy R&D between 2015 and 2020. However, this represents a small increase from historical levels (IEA, 2018). The research, development and deployment budget for CCS has dropped since 2013 and the Australian Renewable Energy Agency budget was reduced in 2014. Support to energy efficiency accounts for a small share of the federal budget compared with other IEA countries. Overall, Australia is a small contributor to patents for environment-related technology worldwide.
The country has a strategic interest in developing CCS and its demonstration projects are excellent, but downscaled government funding puts its ability to deliver on its flagship programmes at risk. It needs to continue assessing storage capability and ensuring regular monitoring and verification, as well as community engagement. Project completion, supported by a stable and coherent policy framework and continued funding, would aid in CCS development and deployment in Australia and worldwide (IEA, 2018).
Addressing the socio-economic impact of the green growth transition
The green growth transition requires anticipating and addressing its economic and social impact. A solid evidence base is needed to understand the underlying challenges and opportunities. Some information is available on employment in waste management and renewable energy activities. However, Australia does not monitor economic activity and employment in the environmental goods and services sector.
Policy makers need to identify the winners and losers in the green growth transition. In consultation with stakeholders, they should define a transition plan, including well-targeted support measures such as skill adjustment. Australia has taken steps to address the labour impact of closures of coal-fired power plants. It is also promoting environment-related employment through education and training (Section 2) and by making use of Indigenous knowledge and skills for natural resource management through job-creating programmes such as the Indigenous Rangers programme (Section 4).
Environment, trade and development
Most of the free trade agreements Australia has signed include general environmental provisions only. As a chair of the environmental goods agreement negotiations under the World Trade Organization, the country focuses on removing barriers to trade in environmental goods and services. Australia has already reduced tariffs to 5% or less on a range of environmental goods, as agreed by Asia-Pacific Economic Cooperation members.
Australia’s net official development assistance (ODA) disbursements have been declining in real terms since 2012, but its aid remains of significant importance for small island developing states in the Pacific region. In 2017, ODA accounted for 0.23% of gross national income, below the OECD Development Assistance Committee (DAC) member average of 0.31% and far from the UN target of 0.7% (SDG 17.2). After a decrease over 2011-15, Australia’s aid focusing on environment11 rose to 23% of bilateral allocable aid in 2016, remaining low compared to the DAC average of 33% (OECD, 2018l).
Although the 2017 Foreign Policy White Paper emphasised that environmental degradation and climate change put the region's prosperity at risk, mainstreaming of these issues in aid programmes is limited, beyond a safeguard approach (OECD, 2018m). There is no strategy, backed with sufficient resources, for integrating environment and climate across the aid programme. Australia has actively supported the Green Climate Fund and contributes to other multilateral funds, especially on adaptation, but should clarify its roadmap on scaling up financial support, as the Paris Agreement recommends.
The Export Finance and Insurance Corporation (EFIC), the government’s export credit agency, finances few mining projects with potentially significant adverse environmental and/or social risks (EFIC, 2018). Australia agreed to the OECD arrangements restricting the circumstances under which coal-fired power plants can be financed, after negotiating an exception regarding less efficient small coal-fired power plants in developing countries. There is little information on the level of EFIC funding for fossil fuel projects.
Australia has committed to promote the OECD Guidelines for Multinational Enterprises. Its national contact point should improve visibility, accessibility, transparency and accountability. The government needs to ensure its independence with adequate funding (Newton, 2017).
Framework for sustainable development
Update the 1992 National Strategy for Ecologically Sustainable Development with a plan for implementing the 2030 Agenda supported by time-bound quantitative targets.
Use environmental-economic accounts in budget documents. Publish regular environmental expenditure accounts for Australia.
Greening taxes, subsidies and prices
Ensure that environmental externalities are better reflected in energy taxes, as expected under the National Energy Productivity Plan; this implies taxing fuels that are currently exempt and increasing rates that are too low. Consider increasing taxes on diesel to at least match those on petrol on a carbon basis.
Introduce a mechanism to systematically screen public support programmes against their potential environmental impact to identify and phase out environmentally harmful and inefficient subsidies.
Implement the heavy vehicle reform and extend road pricing to light vehicles. Consider introducing congestion charges in the largest cities. Introduce CO2 and local air pollutant emission criteria in vehicle registration fees and stamp duty, with a roll-out plan as the fleet improves. Review the tax treatment of company cars and commuting expenses to promote alternative modes of transport.
Adopt a nationally consistent framework for landfill levies and expand the use of variable charging for municipal waste services. Extend the national product stewardship programme to additional products.
Continue to improve the quality and accessibility of water market information. Improve monitoring and reporting to ensure that the management of environmental water assets maximises environmental outcomes.
Investing in the environment to promote green growth
Improve ex ante cost-benefit analysis and systematically conduct ex post evaluation of public investment projects, especially in the transport and water sectors.
Align economic regulation and prices in the urban water sector with the requirements of the National Water Initiative in all jurisdictions. Address affordability concerns for urban water users in small communities and remote areas through payments untied to capital expenditure targeting high-cost areas; improve service provision through increased collaboration of small service providers.
Improve co-ordination and alignment of renewable support programmes across states and territories. Foster system integration of variable renewables (wind/solar) in the National Electricity Market by developing interconnections among regions, enhancing the flexibility of system operation, co-ordinating planning of grid infrastructure and providing locational signals for geographically balanced deployment.
Increase investment for rail and public transport; improve transport mode links and integrate transport planning with land use planning.
Promoting eco-innovation
Clarify the national strategy for eco-innovation and increase government support to research, development and deployment to address Australia’s biggest challenges (climate change, water, biodiversity); strengthen links between industry and research and pursue international co-operation, notably on promising innovations in renewables, energy storage, carbon capture and storage.
Environment and development co-operation
Develop a strategy to mainstream environment and climate in the aid programme and ensure sufficient capacity and resources for its implementation; develop a concrete roadmap for contributing to the USD 100 billion goal and clarify post-2020 contributions.
Threatened species protection and sustainable use of biodiversity
Biodiversity status and trends
Australia is responsible for around 10% of the world’s biodiversity and is one of 17 megadiverse countries. It has more than 500 000 species of plants and animals, many of them found nowhere else in the world (Australian Government, 2014). This rich biodiversity supports a strong tourism industry, natural resource sectors and increasing exports of natural oils and medicines. It also helps provide critical ecosystem services that support Australians’ well-being, including clean air and water, plant pollination, pest control and wastewater treatment. Beyond material benefits, it is an important part of Australian culture, particularly for Indigenous peoples.
The status of biodiversity is poor and worsening (Cresswell and Murphy, 2017). Australia had the second highest deterioration of biodiversity12 in the world, after Indonesia, between 1996 and 2008 (Waldron et al., 2017).
At the national level, there are 81 ecosystems listed as threatened, with 34 critically endangered, and 511 terrestrial and aquatic animal species listed as threatened, with 55 considered extinct. For plant species, 1 355 are listed as threatened. The greatest numbers of threatened species are found in southeastern and southwestern Australia, though this may partly reflect greater study in proximity to populated areas. Mammal declines in northern Australia have also been documented. Without significant new and expanded policy measures, biodiversity loss will continue, with risks to irreplaceable world natural heritage, unique species and critical ecosystem services. Australia’s iconic Great Barrier Reef has already sustained significant coral loss due to unprecedented bleaching over 2014-2017, crown-of-thorns starfish outbreaks and severe cyclones (Hughes et al., 2017; AIMS, 2018; GBRMPA, 2018). The health of the reef depends on a combination of near-term efforts to reduce direct and indirect pressures from human activity and long-term efforts to mitigate the impact of climate change (Australian Government, 2018; Reef 2050 IEP, 2016).
The main pressures on biodiversity are from: land clearing and habitat fragmentation for grazing, urban development, infrastructure and extractive industries; alterations to watercourses, water use and coastal pressures; invasive species such as feral cats, foxes and weeds; and fire, pollution, disease and climate change. The pressures interact with each other, exacerbating vulnerability.
Monitoring of the status and trends of ecosystems and species is patchy, time-limited and generally inadequate. A commitment in the 2010 Commonwealth-State National Biodiversity Conservation Strategy, to develop a national biodiversity monitoring and reporting system has largely been abandoned. Previous monitoring efforts such as the River Health Program and the Wetlands Inventory have also been discontinued. The Atlas of Living Australia and Bush Blitz programmes help record sightings of species, and the expansion of environmental-economic accounts at the Australian Bureau of Statistics is improving understanding of pressures such as land and water use. Significant additional effort, including funding, is needed to progress towards a national, comprehensive biodiversity monitoring and reporting system that can inform Commonwealth, state and territorial policy decisions and priority setting.
Strategic and institutional framework
With shared roles on biodiversity policy, and limited resources, it is important for the Commonwealth government and the state/territory governments to co-ordinate and collaborate to ensure a strong national response to biodiversity challenges. In 2010, a council of Commonwealth, state and territory environment ministers released a new National Biodiversity Conservation Strategy 2010-2030 as a guiding umbrella framework for all levels of government, the private sector and communities. The strategy set ten interim targets for the first five years, including developing a national long-term biodiversity monitoring and reporting system. A 2016 review determined that only one of the targets had been met, with the others being unmet or unmeasurable due to a lack of clarity on implementation and data.
A draft revised strategy, Australia’s Strategy for Nature 2018-2030 attempts to address the review recommendations, but the first draft appeared equally unlikely to catalyse significant progress. It shifted to high-level, vague goals and objectives combined with an inventory of actions already under way. The 2015 Commonwealth Threatened Species Strategy, in contrast, identifies priorities, specific measurable targets and actions to achieve them. However, it also falls short in that it is only for the Commonwealth government, it is too narrow to meaningfully address the scale of biodiversity loss, it used an informal approach to set priorities and it has limited dedicated financial resources for implementation. Regional and local authorities play an important role in translating policies and programmes into on-the-ground action, but many lack the capacity or resources needed.
As Australia works to improve its biodiversity and threatened species strategies, it could consider approaches taken internationally. New Zealand, for example, developed a system to set priorities for threatened species and ecosystem management in consultation with ecologists and communities. It also developed a three-tiered approach to biodiversity monitoring to gather the data needed for decision making and reporting. New South Wales used this model as a basis for its Saving our Species programme, though the programmes have since developed differently. Independent authorities, such as the Commissioner for Environmental Sustainability in Victoria, have also been shown to play an important role in maintaining the continuity of knowledge provision across political cycles. The Commonwealth Threatened Species Commissioner has helped raise awareness, but is unlikely to significantly influence biodiversity outcomes without greater independence, additional financial and human resources, and effective partnerships with state and territory governments.
Mainstreaming biodiversity across sectors
Australia has a strong legislative framework under the EPBC Act, but it applies only to matters determined to be of national environmental significance, with remaining issues falling under varying state and territorial legislation. Both levels of government have improved EIA requirements for new large projects, and increasingly incorporate biodiversity considerations into infrastructure assessments, regional plans and strategic assessments. However, in many areas, Australia has not yet achieved an approach that fully considers the cumulative effects of all forms of existing and new development, and economic interests still tend to dominate decision making.
For example, Queensland set a goal of doubling state food and fibre production by 2040, despite having identified land clearing for pasture as its greatest pressure on species. State governments are also responsible for coastal waters as far as three nautical miles from shore, but most have limited enforcement of recreational fishing limits or control of other activities that are growing in popularity. The state of Victoria continues to allow harvesting of large old trees (regrowth and limited old growth) within the mountain ash forest that provides habitat for critically endangered species. There are more than 50 000 abandoned mine sites across the country, with limited effort at rehabilitation or assessment of soil and water contamination risks (Section 2). Urban sprawl and infrastructure expansion are also of growing concern, with high levels of population growth concentrated in vulnerable coastal areas and construction of new ports and terminals to support export growth.
There are examples of well-developed integrated land use planning frameworks, such as South East Queensland’s 2017 Regional Plan, but many seem to be lacking in comprehensive consideration of all sources of existing and new development, and in identifying concrete actions to limit cumulative environmental effects and key pressures on biodiversity. Strong plans can also be poorly implemented. The best plans are supported by adequate localised data on ecosystems and species that allow for the establishment of baselines and measurement of progress.
Protected areas
Australia has made impressive progress in expanding protected areas, surpassing the international 2020 Aichi targets for terrestrial areas (achieving 19% vs. a target of 17%) and far exceeding targets for marine protection (achieving 36% vs. a target of 10%) (Figure 5). The system of terrestrial protected areas is split between government reserves (45%), Indigenous Protected Areas (45%), areas run by non-profit organisations (4%) and ecosystems protected by farmers (6%). The protected areas are relatively evenly distributed between more restrictive protection categories (47%) and those that allow sustainable use (51%). Indigenous peoples are playing a growing role in protected area management through collaborative governance arrangements and the successful Indigenous Ranger programme that provides both employment and training. The concept of Indigenous Protected Areas was recently introduced in Canada (ECCC, 2018).
However, gaps remain in terrestrial protection, with more than one-third of Australia’s 89 bioregions (defined by common climate, geology, landform, native vegetation and species) having less than 10% protection. New South Wales and Queensland have the lowest proportions of terrestrial area protected (DEE,2016a). The federal government and all state and territorial governments have agreed, under the Strategy for the National Reserve System 2009-30, to achieve a fully effective reserve system by 2030, but lack of financing for existing reserve management and establishment of new reserves is likely to slow progress.
Australia has 36% of its marine area protected, though 96% of protected areas are under Commonwealth jurisdiction and management regimes do not generally cover growing coastal pressures under state and territorial control, other than in the Great Barrier Reef Marine Park. The establishment of 40 new marine parks in 2012 was a major advancement in protection for marine biodiversity. However, controversy surrounding the details of management plans has delayed implementation and led to changes to the protections originally proposed. Rather than starting over, governments should incorporate the research and monitoring capacity recommended by an Expert Scientific Panel in 2015 to support evidence-based decision-making.
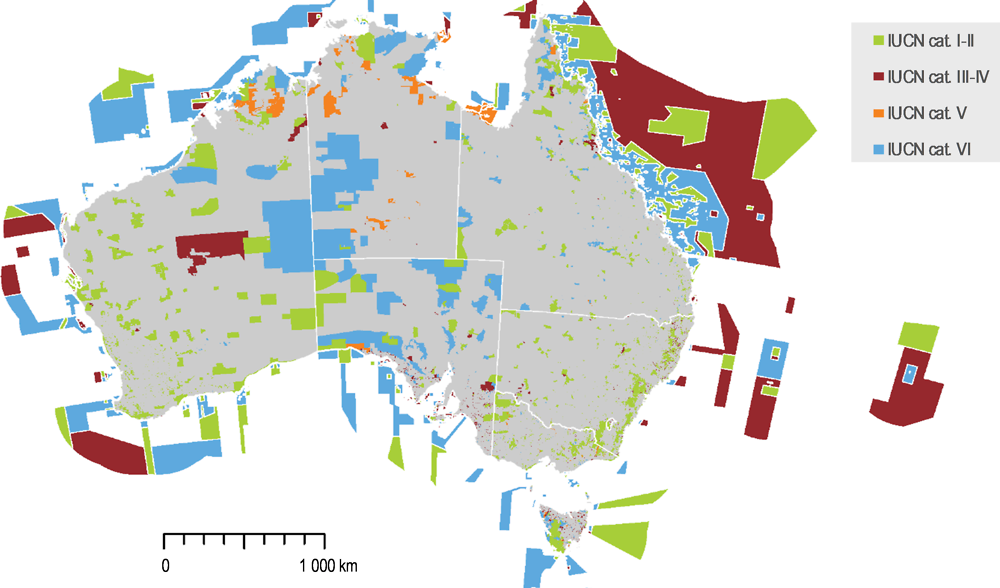
Sources: DEE (2016), CAPAD (Collaborative Australian Protected Areas Database) 2016: Terrestrial Protected Area Data; DEE (2018), Australian Marine Parks (database).
Other policy instruments
Outside of protected areas, Australian governments use a variety of conservation programmes, economic instruments and other tools for species protection and sustainable biodiversity use. The main federal programme is the National Landcare Program, which provides grants for conservation and sustainable use actions by organisations, private landowners and community groups. While in general the programme has helped reduce biodiversity loss, the government has been criticised for frequently changing policy directions and funding levels, and for focusing more on administrative result measurement than biodiversity outcomes. Funding has been decreasing over time and while the new tender process may improve overall outcomes, small communities and organisations may lack the capacity to draft quality proposals. The Reef Long-term Sustainability Plan for the Great Barrier Reef, in contrast, has received significantly increased investment as a result of strong international attention to the high-profile World Heritage Area and reports of its poor coral condition and water quality.
A prominent use of economic instruments for biodiversity is through conservation covenants with private landholders, which provide benefits such as tax concessions, rate relief or grants in exchange for protecting land of high conservation value. Results of the programme are mixed, however, depending on the capacity of landowners to manage protected areas and the degree to which states maintain protection. Queensland, for example, has approved mining on land previously protected under a conservation covenant.
Biodiversity offset policies are also increasing as part of environmental assessment processes at both the federal and state levels. However, offset requirements vary across jurisdictions and there has been criticism of what is deemed “like for like”, permanency, baseline setting and a lack of monitoring to ensure achievement of environmental objectives. A greater national role in ensuring consistency and best practices in offsets, as well as alignment with national conservation priorities, would help improve confidence in the approach and its use as a tool to reduce biodiversity loss (OECD, 2016a). The Commonwealth could play a stronger role in accreditation of biobanking and increasing links to threatened species priorities (Hawke, 2009). States and territories could look to approaches such as the new Biodiversity Conservation Trust in New South Wales as a potential model, if it proves successful.
Australia could also improve biodiversity outcomes by identifying and phasing out subsidies and tax incentives that encourage activities harmful to biodiversity. Financial support for extractive industries, insufficient charges for environmental liabilities and water allocation regimes that favour irrigated agriculture could be considered in this context. France, for example, released a report in 2012 detailing measures harmful to biodiversity, highlighting policies such as industry exemptions for water charges and low pollution taxes for agriculture (OECD, 2016b).
Financing biodiversity
While it is difficult to get a national picture of financing for biodiversity conservation, due to the various government levels involved, public funding trends are of concern. Biodiversity expenditure has remained between AUD 400 million and 500 million per year (less than 0.05% of GDP) since 2010 (Cresswell and Murphy, 2017). Other areas of shared jurisdiction have received significantly more Commonwealth funding. Transport infrastructure, for example, received AUD 70 billion over seven years. National Landcare Program funding is dropping, the Green Army programme has not been renewed, there is no longer funding for new state-led National Reserves and there have been cuts to biodiversity research at the Commonwealth Scientific and Industrial Research Organisation and National Climate Change Adaptation Research Facility. The Great Barrier Reef is, however, one area that received significant new funding, with an estimated investment of over AUD 2 billion by the Commonwealth and Queensland governments for implementation of the Reef 2050 Plan.
Many actions needed to improve biodiversity outcomes across Australia require substantial increases in financing, including improved long-term monitoring, feral animal management and ecological restoration. The 2017 Threatened Species Prospectus proposed attracting financing from the industrial and philanthropic sectors, but early indications are that while it has generated over AUD 6 million, it will be difficult to attract substantial private financing without the leveraging power of greater public funding. Moreover, given the public benefit associated with biodiversity protection and restoration, there is a strong case for additional public funding.
Investments in research, development and innovation have produced important advances in knowledge of biodiversity status and trends, as well as approaches to conservation. Several national, state and territorial research programmes support university and NGO research related to biodiversity. However, the scale of investment remains too low to get ahead of the pace of biodiversity loss and growth in pressures, and there are insufficient links between academic research and policy development. Investment in technological innovation has the potential to improve the feasibility and cost-effectiveness of biodiversity monitoring over time, while providing opportunities for Australian businesses.
Develop a national collaborative plan, considering the potential for the establishment of an independent authority, to close data gaps on the status and trends of species and ecosystems, and establish national biodiversity indicators to measure progress over time and identify priorities for action.
Use the opportunity of updating the national biodiversity strategy to increase the Commonwealth leadership role in guiding biodiversity policy; identify priorities for new national, state and territorial commitments, ensuring that they include specific short-, medium- and long-term measurable targets and a set of policy, regulatory and investment actions linked to outcome indicators.
Expand the Threatened Species Strategy by adding additional pressures and species based on a clear and consistent prioritisation process and improved links to state government programmes.
Under Commonwealth leadership, invest time and resources in developing and implementing comprehensive, integrated and collaborative regional plans and strategic assessments in areas where biodiversity is vulnerable, addressing the cumulative environmental effects of all sources of new and existing development, and establishing biodiversity baselines to measure progress.
Continue working to meet the commitment to achieve a fully effective protected area system by 2030, improving protection in underrepresented bioregions and critical habitats for threatened species, and working collaboratively with state and territorial governments to improve coastal protection.
Establish a stronger federal role in offset and biobanking to increase consistency across states and territories, promote alignment with national conservation strategies and ensure best practices; enhance the conservation covenant programme by expanding financial and knowledge support for effective management; and undertake a review of subsidies and incentives that could be harmful to biodiversity.
Increase investment in biodiversity conservation and ecological restoration commensurate with the scale of the challenge and Australia’s global responsibility to conserve its unique biodiversity: enhance local, regional and Indigenous capacity to manage protected areas, co-ordinate actions on threatened species and enforce restrictions; restore funding for the expansion of the National Reserve System; and provide long-term continuous funding for policy-linked biodiversity research, monitoring, reporting and innovation.
Chemical management
Pressures on health and the environment from chemicals
Australia’s chemical and plastic industry (including fertilisers and pesticides) is the country’s second largest manufacturing industry, after the food product manufacturing industry. The manufacture and use of chemicals create pressures on health and the environment that may intensify in the future with increased import of chemicals and plastic products, especially chemicals in articles that may enter the Australian market unassessed when they are not designed for intentional release from an article. Although chemicals represent a smaller market than in some OECD regions, pressures on health and the environment from chemicals need to be appropriately identified, assessed and managed, and, in the case of chemical accidents, reported.
Regulatory framework
The Australian chemical regulatory framework is a complex system across three levels of government, with separate regimes in place for each category of chemical use. The primary policy objective of the chemical management system is to protect human health and the environment. Additional objectives relate to protecting trade and ensuring national security. Chemical risk assessment and risk management are clearly separated and are performed at different government levels, with the former conducted by the Commonwealth and the latter the responsibility of states/territories. Co-ordination is sometimes lacking, especially from one state or territory to another, since each jurisdiction has its own governance and statutory arrangements and can implement regulations independently. The complexity of the regulatory framework is seen as a factor delaying the treaty-making process for ratification of Stockholm Convention amendments and of the Minamata Convention. It could also impede ratification of future treaty amendments.
While laws related to public health and to worker health and safety have generally been implemented consistently across Australia, the risk of humans being exposed indirectly to chemicals via the environment is not being systematically addressed. Regarding protection of the environment, it appears that environmental risk assessment related to chemicals is not conducted across all regulatory regimes. It is performed for industrial, agricultural and veterinary chemicals, but not for pharmaceuticals, although pharmaceutical contamination of surface waters is an issue of emerging concern in OECD countries. The Globally Harmonised System of Classification and Labelling of Chemicals (GHS) is implemented for workplace hazardous chemicals across Australia, unless other labelling laws apply, in which case chemicals are generally exempted from GHS labelling requirement (e.g. therapeutic goods, agricultural and veterinary chemicals, consumer products). The GHS is not implemented for environmental hazards. There is no national framework for management of environmental risks from industrial chemicals, and recommendations by the Commonwealth on environmental protection are unevenly implemented across states and territories.
Ongoing reforms
A research report by the Productivity Commission (2008) raised a number of inconsistencies in the regulation on chemicals and plastics. Ten years after the report, federal reforms to address the recommendations from the report are still under way. The objective of one of these reforms is to address the gap on environmental risk management for industrial chemicals by making provisions to establish a national standard and create a decision-making framework. Under the proposed reform, the DEE will be the national standard decision maker. The framework provides pre-established management measures on environmental protection for each chemical, covering all stages of the chemical’s life cycle. The reform is thus a step towards national co-ordination, though it is too early to evaluate whether it will be implemented consistently across states and territories. In addition, there are uncertainties regarding the resources required to apply the standard and categorise the thousands of chemicals on the market. The role of the states and territories is not fully defined at this stage, nor is the monitoring and evaluation system that will need to be put in place to ensure that risks from chemicals are properly managed.
Another major ongoing reform of the chemical management system concerns the National Industrial Chemicals Notification and Assessment Scheme (NICNAS). When implemented, the reform will focus government pre-market assessment efforts on higher-risk chemicals, based on self-categorisation by industry into introduction categories. Under the current scheme, industry already self-categorises, to a lesser extent, its introductions against low risk criteria in order to access the exemption pathways. This transfer of responsibilities to industry is limited to new chemicals; the reform does not plan similar provisions for substances on the market before entry into force of the current legislation.
Remaining challenges
Most of the legislation on chemical management was put in place in the 1990s. It improved the way chemicals were assessed but the backlog of unassessed chemicals that were on the market before the 1990s remains significant. Although programmes have significantly decreased the number of unassessed industrial chemicals listed on the Australian inventory in the last six years, more than half, i.e. several thousand, of industrial chemicals on the market remain unassessed (Figure 6). Under the reformed scheme, there is no statutory target for the number of chemicals to be evaluated in a given period, nor any timeframe within which each evaluation must be completed. The reformed scheme aims to provide flexibility to adjust the scope of the evaluation to the level of concern, however. Agricultural and veterinary chemicals (known in Australia as agvet) that were authorised before implementation of the National Regulatory Scheme for Agricultural and Veterinary Chemicals some 20 years ago may need to be screened for a potential update of the priority list for re-evaluation, in light of progress in the science.
The NICNAS reform will create incentives to develop safer chemicals by reducing the financial burden on industry for the introduction of lower-risk chemicals. It will also increase efficiency and reduce duplication by facilitating the use of assessments performed in other countries. Under the reformed scheme, the government will not keep track of all chemicals being introduced into the market. The intent is for the reduction in pre-market controls for lower-risk chemicals to be balanced by a greater focus on post-market monitoring and enforcement under the new arrangements. The reformed scheme should address potential data gaps associated with current regulatory requirements for some toxicological endpoints. In particular, screening for chemicals with endocrine disrupting properties needs to be addressed more consistently in the various chemical management programmes.
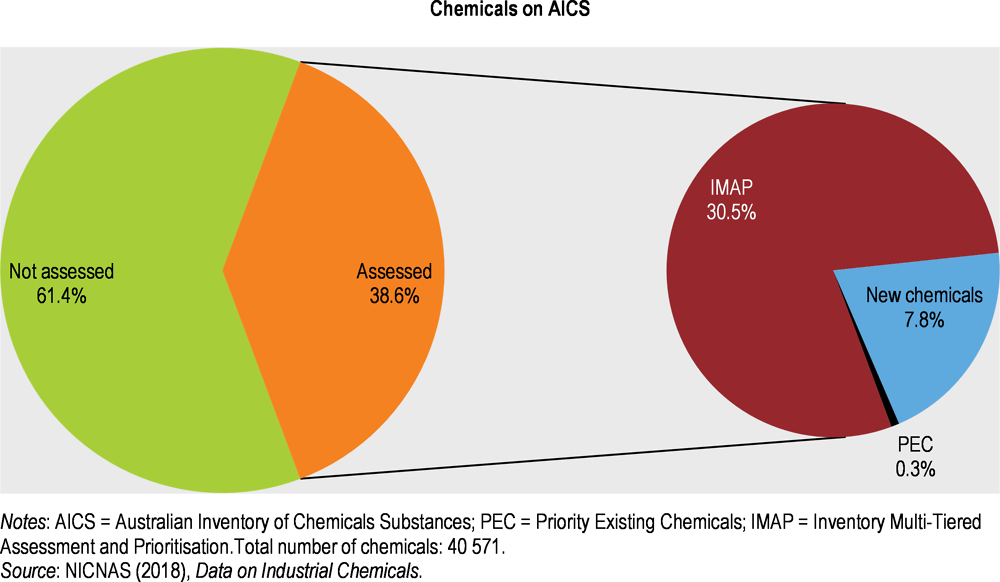
A particular challenge Australia shares with other OECD countries is early identification of contaminants of emerging concern. While action is being taken with regard to some legacy contamination, such as per- and poly-fluoroalkyl substances, mechanisms are needed to move away from a posteriori actions to more proactive approaches. Environmental monitoring and human bio-monitoring are important tools to aid in this identification and can thus inform risk assessment and risk management activities. More effort is needed in this direction, such as updating the National Pollutant Inventory currently being reviewed to keep abreast of chemicals of emerging concern, making better use of existing data and improving monitoring of diffuse sources of chemical emissions. Also, creating a baseline of health and environmental status, using appropriate indicators, would enable assessment of the reforms’ impact on human health and the environment. In this context, further actions could build on the work already undertaken by DEE on a pilot monitoring programme. Moving forward with the development of a national monitoring campaign would generate data that could serve as indicators of the reforms’ effectiveness, contribute to the Stockholm Convention’s impact evaluation and help with earlier identification of emerging contaminants.
Strengthen harmonisation and co-ordination of chemical risk management across states and territories and ensure that the national standard for environmental risk management of industrial chemicals is implemented consistently across jurisdictions, with harmonised and measurable reporting requirements.
Create a baseline of indicators of the status of chemical management to measure the effectiveness of implementation of reforms currently under development.
Develop legal mechanisms to facilitate and accelerate ratification of current and future amendments to the Stockholm Convention and ratification of the Minamata Convention.
Ensure funding mechanisms provide adequate resources to agencies to evaluate the backlog of unassessed industrial chemicals and reassess agvet chemicals in light of new scientific evidence. Consider mechanisms to accelerate assessment or reassessment. Secure funding to ensure all chemicals on the market are categorised into environmental schedules in a reasonable time frame under the national standard.
Consider strengthening information generation and collection for chemicals to ensure screening of a robust set of endpoints including reproductive and developmental toxicity and endocrine disruption.
Ensure that regulatory authorities have access to adequate information about industrial chemicals introduced into Australia to protect human health and the environment and that there is no gap in chemical regulation for chemical constituents of imported articles.
Consider strengthening policies regarding evaluation of environmental risk for pharmaceuticals and medical devices, and management of risk to humans via the environment.
Take further steps to increase communication regarding chemical hazards by applying the GHS more consistently across chemical sectors and implementing the criteria for environmental hazards.
Update the National Pollutant Inventory to be in line with the Recommendation on Implementing Pollutant Release and Transfer Registers adopted by the OECD Council on 10 April 2018 (OECD, 2018n) in the context of national circumstance, and develop a systematic overarching monitoring mechanism to address increases in emissions over time at the national level.
Make better use of available monitoring data and build on the previous pilot monitoring programme to generate more data via national monitoring of chemicals in the environment and bio-monitoring campaigns to accelerate identification of emerging contaminants; ensure risk management of identified concerns and be more proactive when emerging contaminants are flagged.
Reinforce reporting of chemical accidents to the Major Accident Reporting System through the EU-OECD-UNECE co-operation agreement for reporting chemical accidents.
References
ABS (2018a), “Water Use on Australian Farms, 2016-17”, Australian Bureau of Statistics, Canberra, www.abs.gov.au/AUSSTATS/[email protected]/Latestproducts/4618.0Main%20Features12016-17?opendocument&tabname=Summary&prodno=4618.0&issue=2016-17&num=&view= (accessed 10 July 2018).
ABS (2018b), “Australian Environmental-Economic Accounts, 2018”, Australian Bureau of Statistics, Canberra, www.abs.gov.au/AUSSTATS/[email protected]/Lookup/4655.0Main+Features12018?OpenDocument (accessed 10 July 2018).
ABS (2017), “Water Account, Australia, 2015-16”, Australian Bureau of Statistics, Canberra, www.abs.gov.au/AUSSTATS/[email protected]/Lookup/4610.0Main+Features12015-16?OpenDocument (accessed 10 April 2018).
ABS (2014), “Discussion paper: Towards an Environmental Expenditure Account, Australia”, Australian Bureau of Statistics, Canberra, www.abs.gov.au/AUSSTATS/[email protected]/Latestproducts/4603.0.55.001Main%20Features1August%202014?opendocument&tabname=Summary&prodno=4603.0.55.001&issue=August%202014&num=&view= (accessed 10 July 2018).
AIMS (2018), Long-term Reef Monitoring Program: Annual Summary Report on coral reef condition for 2017/18, Australian Institute of Marine Science, Townsville, https://www.aims.gov.au/reef-monitoring/gbr-condition-summary-2017-2018.
Arcadis (2017), Sustainable Cities Mobility Index 2017: Bold Moves, Arcadis NV, Amsterdam, www.arcadis.com/assets/images/sustainable-cities-mobility-index_spreads.pdf.
Argent, R. (2017), Australia State of the Environment 2016: Inland Water, Department of the Environment and Energy, Canberra, https://doi.org/10.4226/94/58b656cfc28d1.
Australian Government (2018a), Report on the Implementation of the Sustainable Development Goals, Department of Foreign Affairs and Trade, Barton, https://dfat.gov.au/aid/topics/development-issues/2030-agenda/Documents/sdg-voluntary-national-review.pdf.
Australian Government (2018b), “Environmental Economic Accounting, A Common National Approach, Strategy and Action Plan”, prepared by the Interjurisdictional Environmental-Economic Accounting Steering Committee for the Meeting of Environment Ministers, www.environment.gov.au/system/files/resources/f36c2525-fb63-4148-8f3c-82411ab11034/files/environmental-economic-accounting-strategy.pdf.
Australian Government (2018c), Reef 2050 Long-Term Sustainability Plan, Commonwealth of Australia, Canberra, http://www.environment.gov.au/system/files/resources/35e55187-b76e-4aaf-a2fa-376a65c89810/files/reef-2050-long-term-sustainability-plan-2018.pdf.
Australian Government (2015), Agricultural Competitiveness White Paper: Stronger Farmers, Stronger Economy, Commonwealth of Australia, Canberra, http://agwhitepaper.agriculture.gov.au/SiteCollectionDocuments/ag-competitiveness-white-paper.pdf.
Australian Government (2014), Australia’s Fifth National Report to the Convention on Biological Diversity, Department of the Environment, Canberra, www.cbd.int/doc/world/au/au-nr-05-en.pdf.
Australian and Queensland Governments (2017), Reef 2050 Water Quality Improvement Plan 2017-2022, https://www.reefplan.qld.gov.au/about/assets/reef-2050-water-quality-improvement-plan-2017-22.pdf.
Callaghan, C. (2017), Petroleum Resource Rent Tax Review, The Treasury, Canberra. https://static.treasury.gov.au/uploads/sites/1/2017/06/R2016-001_PRRT_final_report.pdf.
Campey, T. et al. (2017), Low Emissions Technology Roadmap, Commonwealth Scientific and Industrial Research Organisation, Canberra, www.csiro.au/~/media/EF/Files/LowEmissionsTechnologyRoadmap-Main-report-170601.pdf.
CCA (2017), Review of the Emissions Reduction Fund, Climate Change Authority, Canberra, http://climatechangeauthority.gov.au/sites/prod.climatechangeauthority.gov.au/files/files/CFI%202017%20December/ERF%20Review%20Report.pdf.
CCA (2015), Final report on Australia’s future emissions reduction targets, Climate Change Authority, Canberra, http://climatechangeauthority.gov.au/sites/prod.climatechangeauthority.gov.au/files/Final-report-Australias-future-emissions-reduction-targets.pdf.
CSIRO/BOM (2015), Climate Change in Australia: Information for Australia’s Natural Resource Management Regions – Technical Report, Commonwealth Scientific and Industrial Research Organisation/Bureau of Meteorology, Canberra/Melbourne, www.climatechangeinaustralia.gov.au/media/ccia/2.1.6/cms_page_media/168/CCIA_2015_NRM_TechnicalReport_WEB.pdf.
Cresswell, I.D. and H.T. Murphy (2017), Australia State of the Environment 2016: Biodiversity, independent report to the Minister for the Environment and Energy, Department of the Environment and Energy, Canberra, https://soe.environment.gov.au/sites/g/files/net806/f/soe2016-biodiversity-launch-version2-24feb17.pdf?v=1488792935.
DEE (2018a), Australian Energy Update 2018, Department of the Environment and Energy, Canberra, www.energy.gov.au/publications/australian-energy-update-2018 (accessed 26 September 2018).
DEE (2018b), State Greenhouse Gas Inventory, 2016, Department of the Environment and Energy, Canberra, http://ageis.climatechange.gov.au/SGGI.aspx (accessed 10 July 2018).
DEE (2018c), National Inventory Report 2016, Department of the Environment and Energy, Canberra.
DEE (2018d), Quarterly Update of Australia’s National Greenhouse Gas Inventory: December 2017, Department of the Environment and Energy, Canberra.
DEE (2018f), Australian Marine Parks (database), Department of the Environment and Energy, www.environment.gov.au/fed/catalog/search/resource/details.page?uuid=%7BCD8877F3-8C39-4A20-A53F-070FBEE5AF3C%7D (accessed 24 September 2018).
DEE (2017a), Australia’s emissions projections 2017, Department of the Environment and Energy, Canberra, www.environment.gov.au/system/files/resources/eb62f30f-3e0f-4bfa-bb7a-c87818160fcf/files/australia-emissions-projections-2017.pdf.
DEE (2017b), Department of the Environment and Energy website, www.environment.gov.au (accessed 27 November 2017).
DEE (2016a), Compliance Monitoring Program 2016-2017, Department of the Environment and Energy, Canberra, www.environment.gov.au/system/files/resources/75aae702-cebb-46e1-8ff9-bf0c4f216d82/files/compliance-monitoring-program-2016-17.pdf (accessed 27 November 2017).
DEE (2016b), CAPAD (Collaborative Australian Protected Areas Database) 2016: Terrestrial Protected Area Data, Department of the Environment and Energy, Canberra, www.environment.gov.au/system/files/pages/761994ab-42cc-4f24-952c-c21221861884/files/capad2016national.xlsx.
Department of Industry (2013), Australian Innovation System Report 2013, Department of Industry, Canberra.
DFAT (2017), Foreign Policy White Paper, Department of Foreign Affairs and Trade, Barton, www.fpwhitepaper.gov.au/.
ECCC (2018), First new Indigenous protected area in Canada: Edéhzhíe Protected Area, Environment and Climate Change Canada, Ottawa, https://www.canada.ca/en/environment-climate-change/news/2018/10/first-new-indigenous-protected-area-in-canada-edehzhie-protected-area.html.
EFIC (2018), Transaction disclosure, Export Finance and Insurance Corporation website, https://www.efic.gov.au/our-organisation/our-corporate-responsibility/transactions/transaction-disclosure/ (accessed 30 September 2018).
EPA South Australia (2017), “Reforming waste management”, Environment Protection Authority, Adelaide, www.epa.sa.gov.au/environmental_info/waste_management/reforming-waste-management-2015 (accessed 31 January 2018).
Flues, F. and K. van Dender (2017), “The impact of energy taxes on the affordability of domestic energy”, OECD Taxation Working Papers, No. 30, OECD Publishing, Paris, https://doi.org/10.1787/08705547-en.
GBRMPA (2018), “Reef Health”, Great Barrier Reef Marine Park Authority, Townsville, http://www.gbrmpa.gov.au/the-reef/reef-health.
Hawke, A. (2009), The Australian Environment Act: Report of the Independent Review of the Environment Protection and Biodiversity Conservation Act 1999, Department of the Environment, Water, Heritage and the Arts, Canberra, http://environment.gov.au/system/files/resources/5f3fdad6-30ba-48f7-ab17-c99e8bcc8d78/files/final-report.pdf.
Hughes, T.P. et al. (2017), “Global warming and recurrent mass bleaching of corals”, Nature, Vol. 543, pp. 373-7, https://doi.org/10.1038/nature21707.
IEA (2017), “International Comparison of Light-Duty Vehicle Fuel Economy 2005-2015: Ten years of fuel economy benchmarking”, Working Paper 15, International Energy Agency/OECD Publishing, Paris, www.globalfueleconomy.org/media/418761/wp15-ldv-comparison.pdf.
IEA (2018), Energy Policies of IEA Countries: Australia 2018, International Energy Agency/OECD Publishing, Paris, https://doi.org/10.1787/9789264291881-en.
Infrastructure Australia (2018), Prioritising Reform, Progress on the 2016 Australian Infrastructure Plan, Infrastructure Australia, Sydney, http://infrastructureaustralia.gov.au/policy-publications/publications/files/Prioritising-Reform-report-low-res.pdf.
Infrastructure Australia (2017), Reforming Urban Water, A national pathway for change, Infrastructure Australia, Sydney, http://infrastructureaustralia.gov.au/policy-publications/publications/files/Reforming_Urban_Water_Web_version.pdf.
Jackson, W.J. et al. (2017), Australia State of the Environment 2016: Overview, independent report to the Minister for the Environment and Energy, Canberra, https://soe.environment.gov.au/sites/g/files/net806/f/soe2016-overview-launch-version328feb17.pdf?v=1488792535.
Metcalfe, D.J. and E.N. Bui (2017), Australia State of the Environment 2016: Land, independent report to the Minister for the Environment and Energy, Canberra, https://soe.environment.gov.au/sites/g/files/net806/f/soe2016-land-final-web.pdf?v=1492063205.
Newton, A. (2017), Independent Review Australian National Contact Point under the OECD Guidelines for Multinational Enterprises, Sydney, https://cdn.tspace.gov.au/uploads/sites/112/2018/02/Final-Report.pdf.
OECD (2018a), OECD Economic Outlook, Volume 2018 Issue 1, OECD Publishing, Paris, https://doi.org/10.1787/eco_outlook-v2018-1-en.
OECD (2018b), "Air and climate: Air emissions by source", OECD Environment Statistics (database), https://doi.org/10.1787/data-00598-en.
OECD (2018c), “Air quality and health: Mortality and welfare cost from exposure to air pollution”, OECD Environment Statistics (database), https://doi.org/10.1787/c14fb169-en (accessed 22 August 2018)
OECD (2018d) OECD Environmental Performance of Agriculture: Indicators (database), https://doi.org/10.1787/ac0b4422-en.
OECD (2018e), Effective Carbon Rates 2018: Pricing Carbon Emissions Through Taxes and Emissions Trading, OECD Publishing, Paris, https://doi.org/10.1787/9789264305304-en.
OECD (2018f), “Taxing vehicles, fuel, and road use: What mix for road transport?”, Joint Meetings of Tax and Environment Experts, OECD, Paris, COM/ENV/EPOC/CTPA/CFA(2017)8/REV1.
OECD (2018g), “OECD Inventory of Support Measures for Fossil Fuels: Australia”, OECD Environment Statistics (database), https://doi.org/10.1787/281c98e5-en.
OECD (2018h), “Environmental Policy Instruments”, OECD Environment Statistics (database)
OECD (2018i), Agricultural Policy Monitoring and Evaluation 2018, OECD Publishing, Paris, https://doi.org/10.1787/22217371.
OECD (2018j) OECD National Accounts Statistics (database), https://doi.org/10.1787/data-00019-en.
OECD (2018k) OECD Transport Statistics (database), https://doi.org/10.1787/trsprt-data-en.
OECD (2018l), Development Co-operation Report 2018: Joining Forces to Leave No One Behind, OECD Publishing, Paris, https://doi.org/10.1787/dcr-2018-en.
OECD (2018m), OECD Development Co-operation Peer Reviews: Australia 2018, OECD Publishing, Paris, https://doi.org/10.1787/9789264293366-en.
OECD (2018n), Recommendation of the Council on Establishing and Implementing Pollutant Release and Transfer Registers (PRTRs), https://legalinstruments.oecd.org/en/instruments/OECD-LEGAL-0440.
OECD (2017), Green Growth Indicators 2017, OECD Publishing, Paris, https://doi.org/10.1787/9789264268586-en.
OECD (2016a), Biodiversity Offsets: Effective Design and Implementation, OECD Publishing, Paris, https://doi.org/10.1787/9789264222519-en.
OECD (2016b), OECD Environmental Performance Reviews: France 2016, OECD Publishing, Paris, https://doi.org/10.1787/9789264252714-en.
OECD (2015), Innovation, Agricultural Productivity and Sustainability in Australia, OECD Publishing, Paris, https://doi.org/10.1787/9789264238367-en.
OECD (2014), OECD Economic Surveys: Australia 2014, OECD Publishing, Paris, https://doi.org/10.1787/eco_surveys-aus-2014-en.
OECD (2013a), OECD Compendium of Agri-environmental Indicators, OECD Publishing, Paris, https://doi.org/10.1787/9789264186217-en.
OECD (2013b), Inventory of Estimated Budgetary Support and Tax Expenditures for Fossil Fuels 2013, OECD Publishing, Paris, https://doi.org/10.1787/9789264187610-en.
OECD (2007), OECD Environmental Performance Reviews: Australia 2007, OECD Publishing, Paris, https://doi.org/10.1787/9789264039612-en.
Pickin, J. and P. Randell (2017), Australian National Waste Report 2016, Department of the Environment and Energy/Blue Environment Pty Ltd, Canberra/Docklands, www.environment.gov.au/system/files/resources/d075c9bc-45b3-4ac0-a8f2-6494c7d1fa0d/files/national-waste-report-2016.pdf (accessed 16 August 2017).
Productivity Commission (2018), Murray-Darling Basin Plan: Five-year Assessment, draft report, Productivity Commission, Canberra, www.pc.gov.au/inquiries/current/basin-plan/draft/basin-plan-draft.pdf.
Productivity Commission (2017a), National Water Reform, Inquiry Report No. 87, Productivity Commission, Canberra, www.pc.gov.au/__data/assets/pdf_file/0007/228175/water-reform.pdf.
Productivity Commission (2017b), Shifting the Dial: 5 Year Productivity Review, Report No. 84, Productivity Commission, Canberra, www.pc.gov.au/inquiries/completed/productivity-review/report/productivity-review.pdf.
Productivity Commission (2008), Chemicals and Plastics Regulation, Research Report, Productivity Commission, Melbourne, www.pc.gov.au/inquiries/completed/chemicals-plastics/report/chemicals-plastics-regulation.pdf.
Queensland Government (2017), Environmental Authority Conditions, Queensland Government website, www.business.qld.gov.au/running-business/environment/licences-permits/applying/conditions (accessed 30 January 2018).
Reef 2050 IEP (2016), “Advice from the Reef 2050 Independent Expert Panel”, Department of the Environment and Energy, Canberra, http://environment.gov.au/system/files/pages/abff0d5e-b94d-4495-b79b-90dc52274f69/files/coral-bleaching-climate-change-advice.pdf.
Ritchie, M. (2017), “Landfill Levy: The Australian Perspective”, MRA Consulting Group, Drummoyne, http://www.wasteminz.org.nz/wp-content/uploads/2017/11/Wasteminz-2017-Waste-levies-the-Australian-experience.pdf.
The Senate (2018), Waste and recycling industry in Australia, Senate Environment and Communications References Committee, Parliament of Australia, Canberra, http://www.aph.gov.au/Parliamentary_Business/Committees/Senate/Environment_and_Communications/WasteandRecycling/~/media/Committees/ec_ctte/WasteandRecycling/Report/report.pdf.
Waldron, A. et al. (2017), “Reductions in global biodiversity loss predicted from conservation spending”, Nature, Vol. 551, pp. 364–7, https://doi.org/10.1038/nature24295.
Wang J., G. Walker andA. Horne (2018), Potential impacts of groundwater Sustainable Diversion Limits and irrigation efficiency projects on river flow volume under the Murray-Darling Basin Plan, University of Melbourne, Melbourne, https://www.mdba.gov.au/sites/default/files/pubs/Impacts-groundwater-and-efficiency-programs-on-flows-October-2018.pdf.
Zeppel, H. (2014), “Green procurement by local government: A review of sustainability criteria”, Working Paper No. 8, Australian Centre for Sustainable Business and Development, Springfield Central, Queensland, www.usq.edu.au/acsbd.
Notes
← 1. The profile of electricity emissions varied over 2005-17. Emissions rose over 2005-09 then decreased until 2014. After the carbon pricing mechanism was removed, in 2014, emissions increased until 2016 before decreasing in 2017 with the closure of Hazelwood, Australia’s most emission intensive power station.
← 2. Australia is allowed to use the carryover emissions from the first commitment period (128 Mt CO2 eq) of the Kyoto Protocol to meet its target under the second period. Under current projections (DEE, 2017a), it will reach the 2020 target without this option.
← 3. The Climate Change Authority is an independent statutory agency providing expert advice to the government on climate change policy.
← 4. From coal, gas, pumped hydro and batteries.
← 5. In terms of domestic material consumption (sum of domestic raw material extraction used by an economy and its physical trade balance) per GDP and per capita.
← 6. The carbon pricing gap shows the extent to which countries price carbon emissions below the benchmark value, by measuring the difference between the benchmark and the actual rate for every percentile, and summing all positive differences. The gap is measured as a percentage. If the effective carbon rate on all emissions was at least as high as the benchmark value, the gap would be zero, and if the effective carbon rate was zero throughout, the gap would be 100%.
← 7. The OECD Inventory of Support Measures for Fossil Fuels records tax expenditures as estimates of revenue that is forgone due to a particular feature of the tax system that reduces or postpones tax relative to a jurisdiction’s benchmark tax system, to the benefit of fossil fuels.
← 8. The Fuel Tax Credits programme is not included in the Producer Support Estimate calculation because it benefits other industries.
← 9. The creation of a separate legal entity (a corporation) to undertake specific functions.
← 10. Outside of major cities.
← 11. Aid activities that are marked with at least one environmental and/or Rio policy markers. They include activities targeting the environment, climate change mitigation or adaptation, biodiversity conservation and sustainable use and/or desertification control, either as an explicit and fundamental objective of the activity or as an important but secondary objective.
← 12. Species that shifted to a worse IUCN red list status between 1996 and 2008.