Chapter 4. Assessment of effectiveness (Module 3)
This chapter presents tools for carrying out analysis on the adequacy, efficiency and equity of key social protection programmes. Policy makers are often challenged by the lack of information on the most cost-effective interventions to reduce vulnerability and alleviate poverty. Evaluating the extent to which individual programmes are effective in protecting individuals from poverty and risk is key to developing a comprehensive social protection system.
Analytical dimensions
Module 3 analyses the effectiveness of a country’s social protection system, based on the adequacy, efficiency and equity of the key programmes identified in Module 2. These dimensions determine the extent to which existing social protection instruments alleviate poverty, reduce inequality and address risk and vulnerability, given the resources currently allocated to the sector:
-
Adequacy is assessed by looking both at selected supply-side indicators, such as benefit levels (relative to national and/or international poverty lines) and overall allocation to public social protection spending, and demand-side indicators, such as coverage.
-
Equity is measured in terms of incidence of coverage, incidence of benefits, incidence of beneficiaries by consumption quintile and reduction in income inequality resulting from social protection transfers.
-
Efficiency is analysed according to the gains in well-being or reductions in poverty and vulnerability associated with social protection schemes. Also examined are errors of inclusion/exclusion, the benefit-cost ratio and multiplier effects of cash transfers, as well as issues of take-up.
Analysing a social protection system’s performance in reducing vulnerability and alleviating poverty adopts a holistic approach that considers social protection programmes and their interactions. Adequacy, efficiency and equity are studied according to three principal dimensions:
-
1. by programme type, requiring evaluation of the relative performance of social assistance, social insurance, labour market programmes and health coverage mechanisms
-
2. by target population, either by lifecycle stage or vulnerability (e.g. unemployment, sickness and disability, or widowhood)
-
3. by coverage inequalities, for example, between rural and urban areas, informal and formal workers, and men and women.
This analysis can be applied to existing or new programmes, for example, when a government is considering new schemes. Concerning new programmes, the Social Protection System Review (SPSR) provides simulations that take into account implementation challenges, based on both the country’s experience and similar programmes in comparable countries.
Indicators and data sources
This module is data-driven and based on empirical analyses of each social protection programme. Data are gathered from the legislative framework to understand programme design (e.g. target group, benefit package) (Table 4.1). Disbursement and beneficiaries data from programme administrators, and household survey data, complement the information.
Methodology
The basis of this analysis is microsimulations of programmes, based on household surveys and detailed implementation data. These simulations rely on a number of assumptions made explicit in the review and whose impact should be tested through various scenarios. Table 4.2 provides a list of the indicators and their definitions.
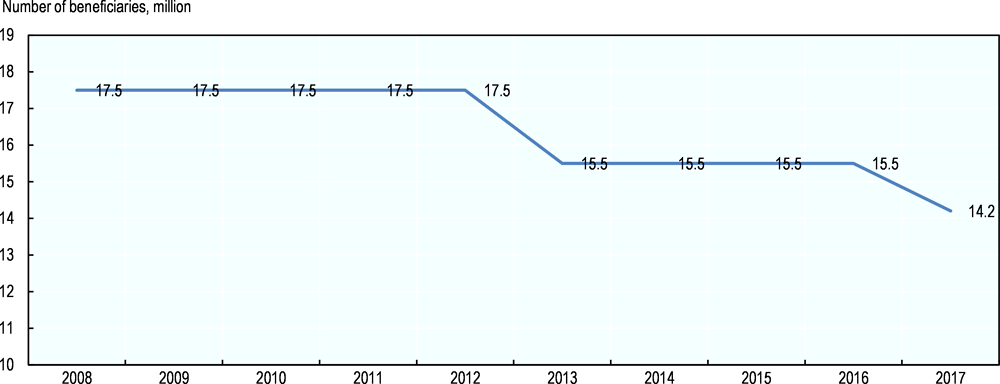
Coverage
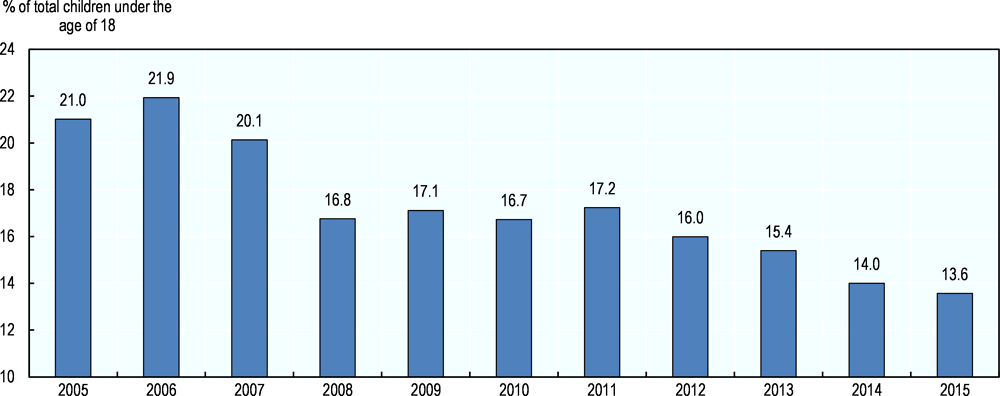
Coverage should be the starting point of analysis of programme effectiveness. Ideally, a time series of coverage should be used to identify a trend (Figure 4.1). Alternatively, coverage can be shown as a percentage of the target population; Figure 4.2 reflects the proportion of children under age 18 covered through Kyrgyzstan’s Monthly Benefit for Poor Families (MBPF), specifically targeted to children.
Sources: OECD (forthcoming[1]), Social Protection System Review of Indonesia, OECD Development Pathways, OECD Publishing, Paris; authors’ calculations based on Statistics Indonesia (2016[2]), Survei Sosial Ekonomi Nasional 2016 Maret (KOR), https://microdata.bps.go.id/mikrodata/index.php/catalog/769 (accessed on 22 June 2018).
Sources: OECD (2018[3]), Social Protection System Review of Kyrgyzstan, https://doi.org/10.1787/9789264302273-en, based on MoLSD, NSC (2015[4]), Kyrgyz Integrated Household Survey, National Statistics Committee of the Kyrgyz Republic, Bishkek.
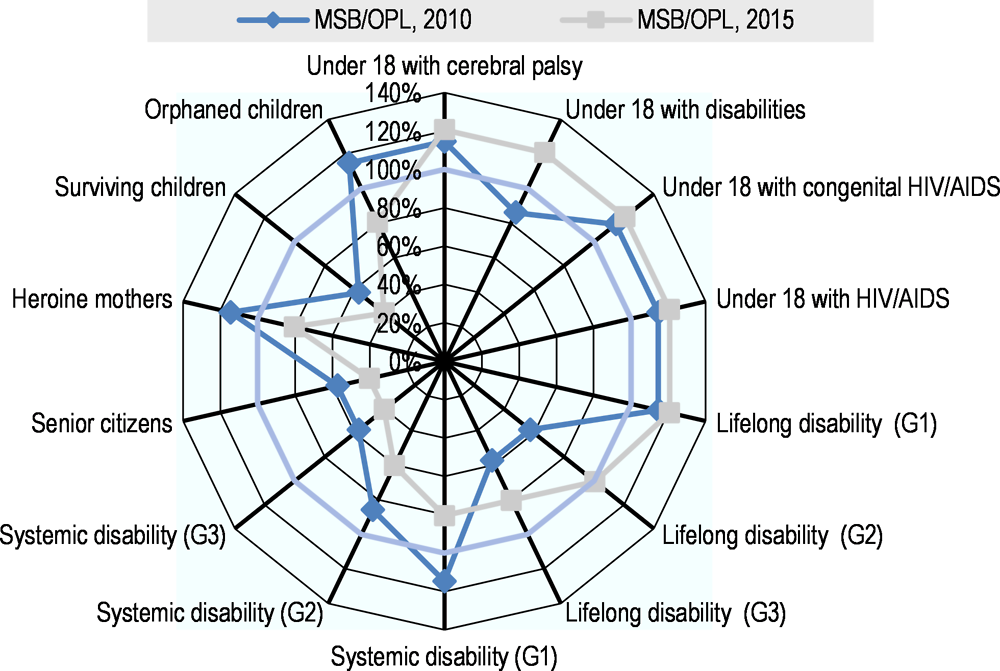
Adequacy
The adequacy of benefits can then be computed in terms of the proportion of the poverty line or other relevant living standards thresholds it represents. This can be captured in a table displaying trends over time (see for example, Table 4.1) or in a chart, a good option when evaluating several benefit packages under one social protection programme. Figure 4.3 shows changes in the value of various components of Kyrgyzstan’s Monthly Social Benefit (MSB) relative to the overall poverty line in 2010 and 2015, becoming more or less generous for some categories of beneficiaries.
Sources: OECD (2018[3]), Social Protection System Review of Kyrgyzstan, https://doi.org/10.1787/9789264302273-en, based on MoLSD, NSC (2015[4]), Kyrgyz Integrated Household Survey, National Statistics Committee of the Kyrgyz Republic, Bishkek.
Equity
The module also identifies the distributional impact of social protection programmes by examining the incidence of benefits and beneficiaries. The beneficiary incidence displays the share of each decile (based on consumption or income, depending on the survey data available) benefiting from the programme, and can be further disaggregated into categories, such as urban or rural populations. Figure 4.4 shows that nearly half (44%) of those in the poorest decile in Indonesia received a fee waiver for health insurance through the Penerima Bantuan Iuran (PBI) programme, while 35% in the second decile reported receiving such benefits. Although the beneficiary incidence steadily reduces for richer deciles, almost one-quarter (22%) of those in the 5th decile also claimed PBI benefits.
Sources: OECD (forthcoming[1]), Social Protection System Review of Indonesia, OECD Development Pathways, OECD Publishing, Paris; authors’ calculations based on Statistics Indonesia (2016[2]), Survei Sosial Ekonomi Nasional 2016 Maret (KOR), https://microdata.bps.go.id/mikrodata/index.php/catalog/769 (accessed on 22 June 2018).
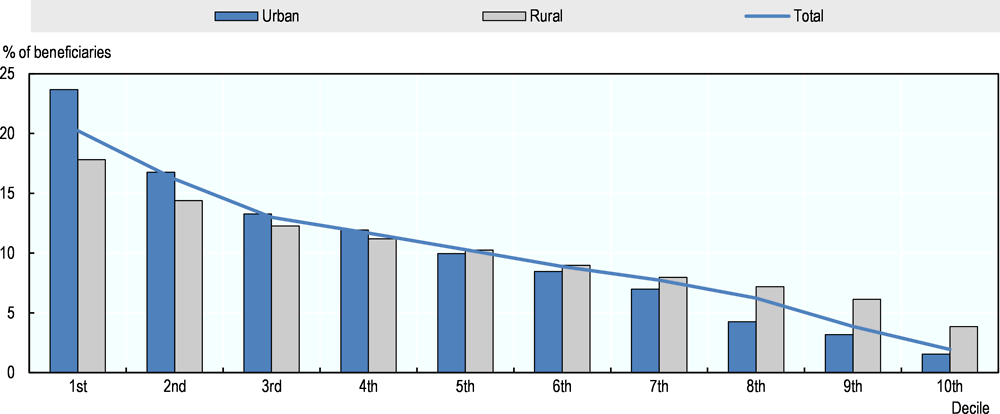
To complement the beneficiary incidence analysis, a beneficiary distributional analysis should be conducted to indicate the proportion of total beneficiaries belonging to each consumption or income decile. This is best shown in a stacked bar chart and can be disaggregated by location (urban or rural). Figure 4.5 shows that urban PBI targeting is more pro-poor than rural targeting.
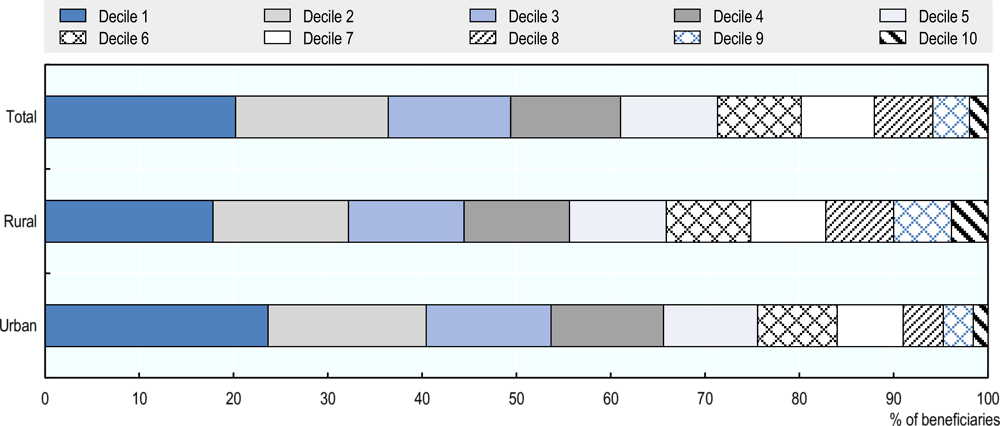
Sources: OECD (forthcoming[1]), Social Protection System Review of Indonesia, OECD Development Pathways, OECD Publishing, Paris; authors’ calculations based on Statistics Indonesia (2016[2]), Survei Sosial Ekonomi Nasional 2016 Maret (KOR), https://microdata.bps.go.id/mikrodata/index.php/catalog/769 (accessed on 22 June 2018).
A similar distributional analysis can be conducted with the total amount of benefits. Figure 4.6 illustrates that, in 2016, households in the bottom 2 consumption deciles receive 36% of PBI benefits, while households in the richest decile received 2% of PBI benefits.
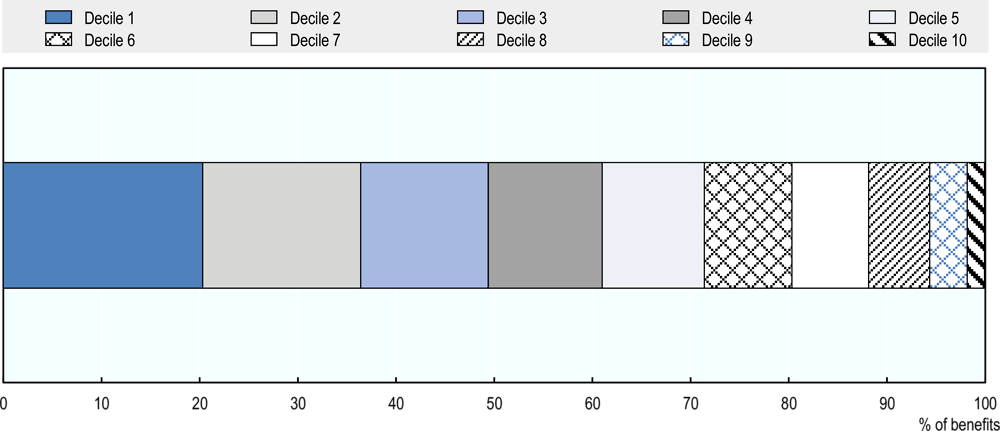
Source: OECD (forthcoming[1]), Social Protection System Review of Indonesia, OECD Development Pathways, OECD Publishing, Paris; authors’ calculations based on Statistics Indonesia (2016[2]), Survei Sosial Ekonomi Nasional 2016 Maret (KOR), https://microdata.bps.go.id/mikrodata/index.php/catalog/769 (accessed on 22 June 2018).
Efficiency
The efficiency of social protection programmes is determined by calculating the reductions in poverty achieved as a proportion of cost. As an example, Table 4.4 evaluates Indonesia’s conditional cash transfer programme, Program Keluarga Harapan (PKH), in terms of total amount disbursed (Column 1), reduction in the poverty headcount and extreme poverty headcount (Columns 2 and 3) and reduction in the poverty gap and extreme poverty gap (Columns 4 and 5).
Poverty-reducing efficiency is computed as the ratio of the reduction in the poverty gap to the cost of the programme, presented in percentages:
PKH’s poverty-reducing efficiency, as measured by the change in the poverty gap for every IDR 100 spent on the programme, is 44.2%, while its extreme poverty-reducing efficiency is 18.31%. Results can be compared across social protection programmes.
This calculation is complemented by a review of the composition of social expenditures when available, for instance, by identifying the proportion allocated to programme administrative costs, which may be high due to the costs of targeting mechanisms or benefits delivery.
Efficiency analysis also identifies leakage of social protection programmes, by which inappropriate targeting mechanisms lead to transfers to households not targeted. This analysis can be used to compare a targeted measure with a universal programme.
References
[4] NSC (2015), Kyrgyz Integrated Household Survey, National Statistics Committee of the Kyrgyz Republic, Bishkek.
[3] OECD (2018), Social Protection System Review of Kyrgyzstan, OECD Development Pathways, OECD Publishing, Paris, https://doi.org/10.1787/9789264302273-en.
[1] OECD (forthcoming), Social Protection System Review of Indonesia, OECD Development Pathways, OECD Publishing, Paris.
[2] Statistics Indonesia (2016), Survei Sosial Ekonomi Nasional 2016 Maret (KOR), https://microdata.bps.go.id/mikrodata/index.php/catalog/769 (accessed on 22 June 2018).