Chapter 1. Skills needs and skills imbalances
This chapter provides a brief overview of the economic and labour market situation in Brazil, followed by a discussion about educational and training outcomes, while stressing which factors have been mostly responsible for changes in skill needs. It proceeds by describing skill surpluses and skill shortages in Brazil, drawing from the Skills for Jobs Database 2018, and in comparison with other OECD and non-OECD countries.
Increased globalisation and rapid technological change, but also demographic developments, have considerably changed skill requirements and skills supplied in most OECD countries in recent decades. These trends are expected to continue in the coming decades. In Brazil, some of these structural mega-trends are not yet fully widespread. Digital technology adoption, for instance, has been slower than in the most advanced OECD economies. Nonetheless, other structural factors are already having a profound impact on skills mismatch and shortages.
1.1. Factors underneath changing skill needs
1.1.1. The economic and labour market situation in Brazil
Between 2000 and 2014, Brazil experienced strong economic growth and social progress. GDP per capita was growing at an average of 3.5% per year (Figure 1.1), in line with most of Latin America, but significantly above the OECD average, making Brazil one of the world’s most promising economies.
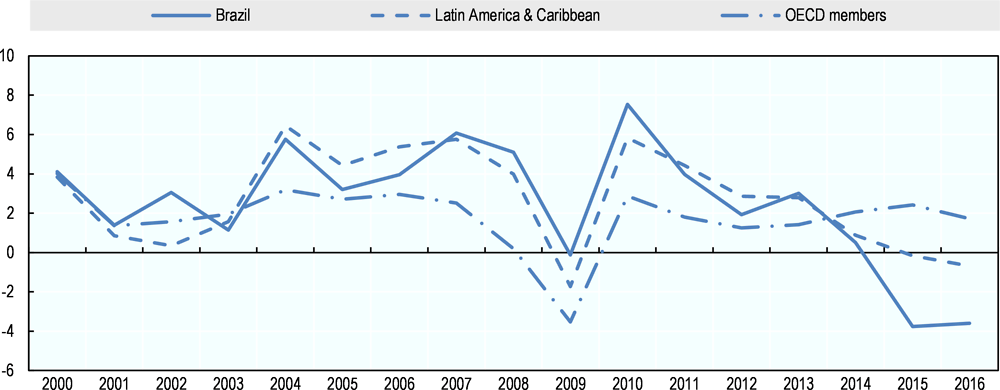
Source: World Bank National Accounts Database.
However, in 2014, the country entered into a long economic recession from which it is now only slowly emerging. During that period, negative GDP growth rates were accompanied by raising unemployment rates above two digits (Figure 1.2). Rising public spending at the cost of private investment, deterioration of the terms of trade, political turmoil, corruption allegations and rising inflation, were all factors behind the economic recession. Although the government has promoted fiscal adjustment and tighter monetary policy, more reforms are needed to help the country sustainably bounce back from recession (OECD, 2018a). Recent fiscal and monetary policies have started paying off but job creation, particularly in the formal sector, remains very weak (Figure 1.3).

Source: World Bank National Accounts Database.
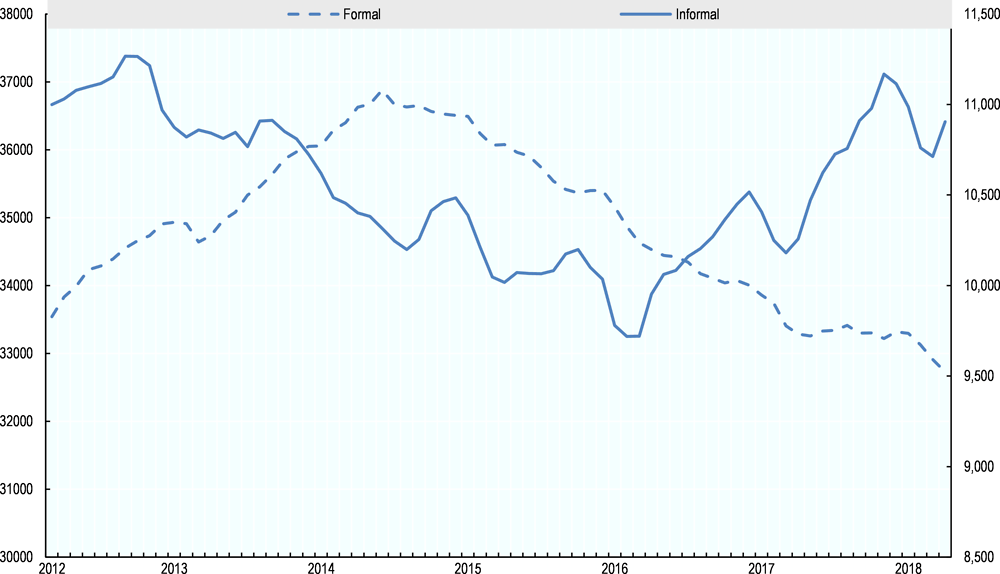
Source: IBGE.
Economic recessions are usually associated with with more underskilling (Zago, 2015), i.e. with few jobs available, workers accept jobs below their qualification level: high-skilled workers downgrade to middle-skill jobs and middle-skilled workers downgrade to low-skill jobs, leading to stronger skill imbalances. Additionally, recessions are also thought to lower the opportunity cost for adjustments to technological changes and for boosting creative destruction (Hershbein and Kahn, 2017).
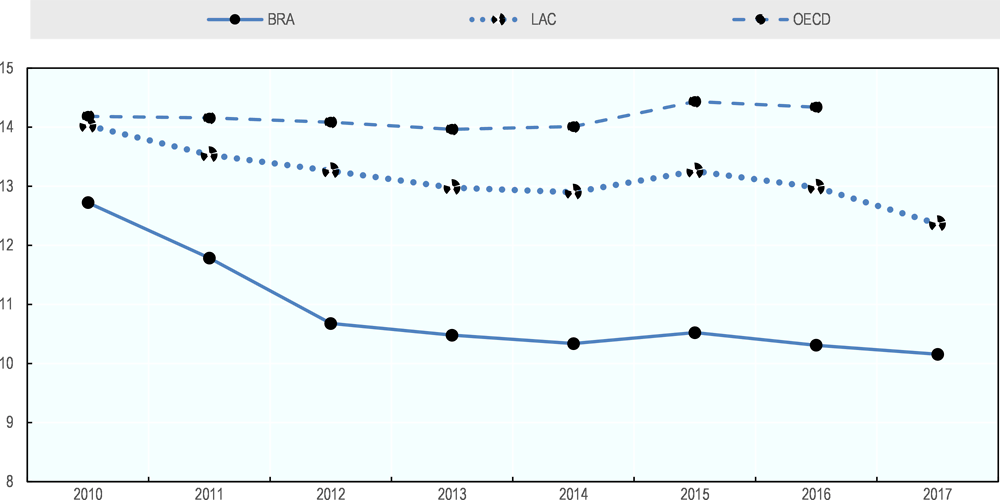
Worryingly, growth potential, which measures how fast GDP can grow over a long time horizon, has also substantially declined. This is mainly due to weak labour and total factor productivity (OECD, 2018a), partly due to a large share of the workforce having only basic skills. In fact, productivity growth started to stagnate in 2007, even before the start of the recession (Figure 1.4 and Figure 1.5). Low productivity growth and low productivity levels hinder firms’ competitiveness, especially in global markets. As a result of this lack of competitiveness, over the past two decades, Brazil’s manufacturing sector has shrunk significantly, and relatively more than in other Latin American countries and OECD countries in terms of value added out of GDP (Figure 1.6).
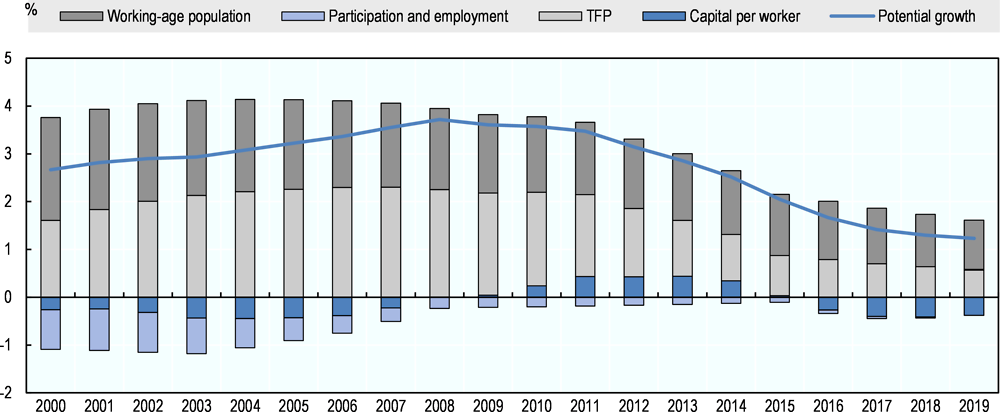
Note: Growth rates expressed in percentage. Potential growth rate decomposed in the working age population growth, participation and employment growth, Total Factor Productivity (TFP) growth and capital per worker growth.
Source: OECD Economic Outlook 102 database.
Note: Labour productivity in thousands of 2010 USD per employee.
Source: World Bank, ILO, IBGE.
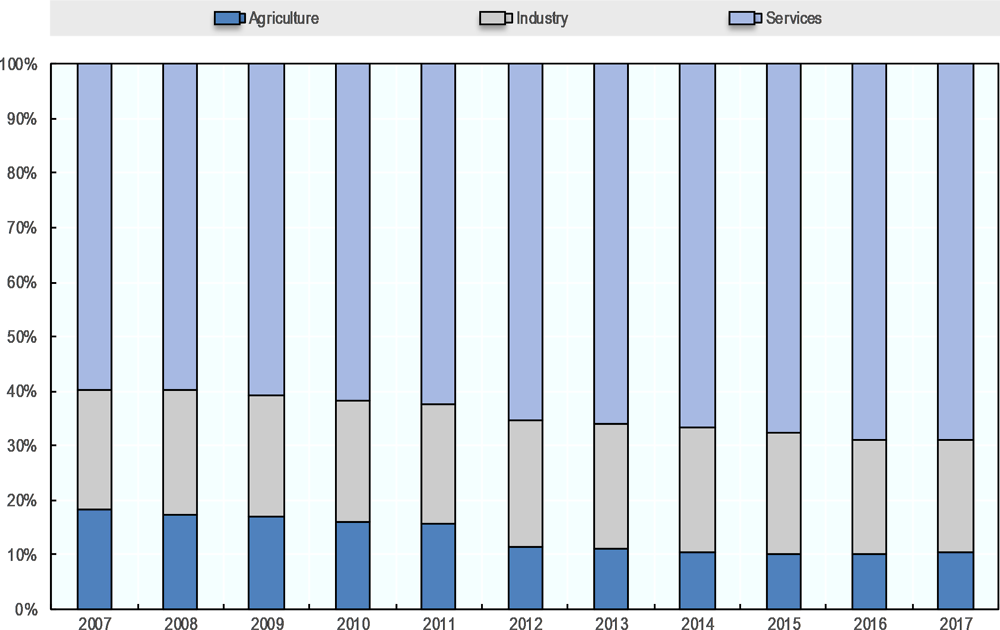
One of the consequences of the fall in the relative importance of manufacturing out of GDP is that it can lead to a fall in the demand for manufacturing and production skills. In fact, employment in the manufacturing sector in Brazil has stagnated, while employment in services increased at the expenses of employment in the agricultural sector (Figure 1.7). Such structural transformations inevitably affect the demand for skills. The rise of services will most likely be accompanied with an increase in the demand for skills such as social skills, communication skills, or customer services skills, for example.
Source: World Development Indicators.
So far, Brazil has not fully reaped the benefits that integrating into the world economy can offer, remaining on the side lines of an increasingly integrated world economy, compared to other emerging economies (OECD, 2018a). Nevertheless, several measures have been implemented so as to increase Brazil’s participation in global trade, such as relaxing measures that favour the domestic industry at the expenses of foreign competitors (Local content rules or LCRs). Opening to global markets will induce several changes to the type of skills that are needed by employers. For instance, if Brazilian firms start offshoring, non-tradable services are expected to grow in importance. Such services include food preparation and hospitality, for example. As these changes have not yet fully materialised, Brazilian policymakers have a window of opportunity to prepare for these transformations.
Brazil was particularly successful in developing and adopting new technologies during the third industrial revolution. In particular, production of hardware and software was higher than in other developing economies, as well as the use of automation in the banking sector, for example (Frischtak, 1992). The country has still to catch-up with the current trends of artificial intelligence, machine learning, smart and autonomous systems or the internet of things (Zanotto, 2002). Profound changes in the industrial structure are to be expected in the coming decades.
Source: World Bank.
In countries that have already adopted some of these new technologies, low and middle-skilled occupations have become less important. Cognitive non-routine skills that are associated with occupations such as managers and analysts will become in high demand, driven by substantial work reorganisation (NESTA, 2017). Other skill shortages that can be expected to emerge with automation are communication skills, social perceptiveness, and instructing, persuasion and negotiation skills. In fact, these are all skills related to human interactions that are, so far, difficult to automate through the use of artificial intelligence or robotics. On the other hand, control precision abilities (e.g. the ability to quickly and repeatedly adjust the controls of a machine or a vehicle to exact positions), finger dexterity, peripheral vision or depth perception, are examples of skills that lost importance with the adoption of technologies such as smart sensors and sophisticated robots (OECD, 2017c).
1.1.2. Demographic changes
A worsening demographic dividend is also putting pressure on the Brazilian labour market. Brazil’s demographics is much less favourable than it used to be (OECD, 2017a). The country now has a total fertility rate below replacement level, at 1.75 children per woman, and the population growth rate is decreasing every year. Low fertility and an increasing life expectancy jointly contribute to Brazil’s increasingly high old-age dependency ratio. In Brazil there are currently about 13 individuals aged 65 and over per 100 people of working age defined as those aged between 20 and 64. However, this number is set to increase strongly in the next decades and Brazil is projected to have a higher dependency rate than most OECD and G20 countries by 2075 (Table 1.1).
Population aging will call for longer working lives and lifelong learning to maintain and upgrade workers skills. There is evidence that the speed at which people can process information declines with age, while experience and general knowledge increase. This will affect the stock of available skills in the labour market. Moreover, a shrinking workforce will require a better use of human resources available, meaning that employees should be well matched in occupations where they are able to use their competencies more effectively.
On the other hand, demand for health and personal care services are likely to increase. Skills usually required in the health care sector comprise communication and interpersonal skills, but also, the ability to listen attentively, to show empathy, to work in teams, to deal with pressure and to have a strong work ethic.
1.1.3. Educational outcomes and lifelong training
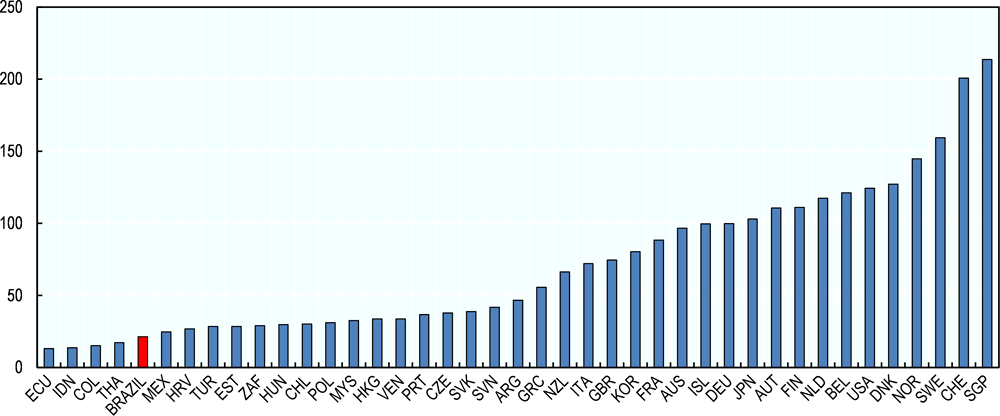
Strong basic skills acquired in initial education are key for participation in further education and training throughout one’s working life. Education in Brazil faces challenges in terms of reach and quality. Only 59% of Brazilians are expected to complete upper secondary education before they turn 25 (OECD, 2017b). The share of tertiary graduates is also relatively low, when compared with other countries (Figure 1.8 and Figure 1.9). Moreover, quality is not assured for those who do enrol in secondary education. PISA, which evaluates the performance of 15 year olds in reading, mathematics and sciences, shows that adolescents in Brazil perform poorly in all three subjects, even when comparing to other middle-income countries (Figure 1.10).
Not only is initial education a fundamental building block for further learning, it also has the potential to respond to existing skill shortages by providing skills that can be put to immediate good use in the labour market, particularly through vocational education.
Unfortunately, only 4% of Brazilians enrolled in upper secondary education opt for a vocational track (Figure 1.11). This is in sharp contrast with the OECD where one out of four upper secondary students on average are enrolled in a vocational programme. There is a strong need for expansion of vocational training at secondary level to guarantee better integration of high school graduates in the labour market, especially in a context where tertiary education is inaccessible to most individuals. Moreover, the unmet supply of vocational graduates at upper secondary level is not compensated by technical training at tertiary level. Only 14% of tertiary students are enrolled in fields such as Engineering, Manufacturing, Construction, Natural Sciences, Mathematics or Statistics (OECD, 2018a).

Source: World Bank World Development Indicators database; OECD Education at a Glance database; UNESCO Education database.
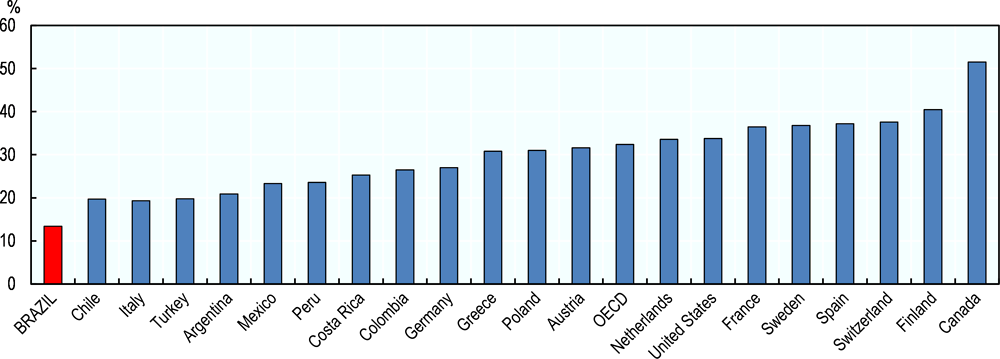
Source: World Bank World Development Indicators database; OECD Education at a Glance database; and UNESCO Education database
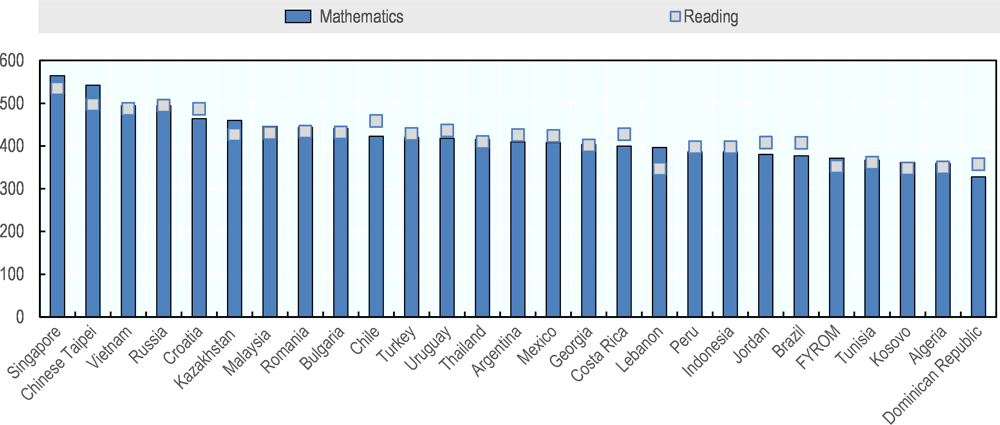
Source: PISA (2015).

Source: UNESCO Institute for Statistics.
Although there is still limited enrolment in vocational education, technical and vocational training exhibit higher wage return than general education degrees. Individuals who complete a vocational training course at the upper secondary level enjoy a wage premium of 9.7% compared to those who completed the general education track (Almeida et al., 2015). In the manufacturing sector only, wage returns to vocational training can go up to 20% (CNI, 2013). These high wage returns can be interpreted as a market signal for the shortage of vocational graduates.
Currently, vocational education in Brazil is mostly dominated by technical schools from “Sistema S”. Technical schools from “Sistema S” (S-system) are private, non-profit organisation, financed, managed and led by firms (Box 1.1). These schools – just as public technical schools - offer vocational education at the secondary and tertiary level, as well as short training courses called “Cursos de Formação Inicial e Continuada (Cursos FIC)” (initial and continuing training programmes).
Empirical evidence suggests that S-system trainees are disproportionately male, non-enrolled in the formal schooling system, heads of households, with bi-parental families, living mostly in the northern and southern parts of the country, and likely to be affiliated to a workers’ union (Villalobos Barría and Klasen, 2016). Among individuals aged 15 to 29 years old, technical schools from the S-system yield a considerably higher return than those trained in other institutions: 28.3% versus 10.4%. The difference in returns between technical schools from the S-system and other institutions seems to be higher in rural areas, compared to urban areas. Finally, training has been shown to increase monthly labour earnings by improving hourly pay, rather than by increasing the monthly hours of work (Villalobos Barría and Klasen, 2016).
Short training courses or “Cursos FIC” are professional qualification courses that do not necessarily fit within the formal education system. Such courses do not lead to a certificate that can be considered equivalent to a secondary or tertiary educational degree. To that extent, these courses are sometimes considered free-form qualification (“qualificação livre”) as opposed to formal qualification (“qualificação formal”). Since these courses are structured independently of the formal education system (general and vocational), they are aimed at individuals who have already left education and represent an opportunity for lifelong learning. Wage returns to “Cursos FIC” have been estimated at 2.2% on average (Almeida et al., 2015).

Source: SENAI.
Figure 1.12 shows the share of workers in the manufacturing sector that possess a general education degree, a vocational education degree and who attended a free-form professional qualification course (disentangling professional courses with less than 200 hours and those with more than 200 hours). Most workers only possess a short free-form training course. Therefore, for many workers, these short professional courses are the only opportunity to acquire technical skills. Despite that, up until recently, out of all public expenditures on Active Labour Market Policies (ALMPs), funding allocated to boost training was almost inexistent in Brazil (Figure 1.13).
The government has started to address the lack of a well-developed public vocational and technical education system by developing federal programmes that promote technical training and that are directly funded by the Federal budget. The latest of these programmes, PRONATEC, will be extensively reviewed in this report.

Note: ALMPs expenditures do not include funding transferred to the S-system levy-scheme, nor Federal funding directly allocated to large-scale Federal training programmes.
Source: OECD Public expenditure and participant stocks on LMP database; ILO; and ILO (2016) "What works? Active labour market policies in Latin America and the Caribbean."
“Sistema S” was established by the Brazilian government in the early 1940s. The establishment of this system was meant to encourage vocational and technical training through a collective arrangement where all employers fund training through a levy. This levy scheme requires that firms in each sector (agriculture, trade, manufacturing and transportation) transfer a share of their revenues to the institution supporting training in their area of activity. The system includes nine institutions in total (Table 1.2). These institutions are organised at the national and state level.
Originally, institutions from the S-system would provide training courses in institutions and firms directly. However, the arrangement was considered overregulated, making it unattractive for many companies (Schartzmann and DeMoura Castro, 2013). As a consequence, it was difficult to find firms willing to offer training positions and employers took little advantage of the levy-scheme. Institutions from the S-system then moved away from this structure and developed their own training schools as a stand-alone operation not linked to any particular job or firm (Almeida et al., 2015). Courses are open to current and prospective workers in each sector of activity.
Following an agreement signed with the Brazilian government in 2008 and called “Acordo de Gratuidade” (gratuity agreement), technical schools from “Sistema S” have an obligation to use parts of the funding received through levies to provide training for free to certain segments of the population. Individuals who qualify for free training courses must satisfy some criteria, such as being in receipt of welfare benefits, for example. Therefore, despite charging a tuition fee to the remaining enrolled students, training activities from S-system technical schools are not meant for profit.
Contribution rates for the levy-scheme are different across sector of activity (Table 1.3). This contribution rates are in line with other OECD and non-OECD countries’ training levies (Table 1.4). In 2016, these contribution rates represented a transfer of funds of about BRL 16 billion to institutions from the S-system. This corresponds to half the Federal budget allocated to the conditional cash transfer programme “Bolsa Família” in 2017.
In the last decade, technical schools from the S-system have diversified their funding structure. On top of training courses funded by the levy-scheme and tuition fees, schools have started to offer consultancy and privately-mandated research services. They have also started to sign training agreements with particular firms directly – without passing through the levy-scheme – so as to sale job-specific training services that meet firms’ particular needs.
Funding coming from the levy-scheme is protected against inflation and it provides a secure and stable income to S-system training institutions. Funding towards training in the public system is much more dependent on economic and political fluctuations. This is a critical advantage for “Sistema S” technical schools. On the other hand, the fact that these institutions were able to diversify their sources of funding, in particular through the offer of training services to firms directly, means that this system does not suffer from the pitfalls of a fully levy-based financing model. For instance, there is no monopoly in the training market and enterprises are not bounded to specific training institutions. Furthermore, training courses offered by S-system technical schools under the gratuity agreement are also accessible to unemployed workers and workers in the informal sector.
Currently, SENAI alone has over one thousand training units across the country, including 442 mobile ones. Indeed, SENAI, is the largest “Sistema S” institution in terms of training capacity. SENAI has provided training to over 35% of the manufacturing sector’s workers. Even among those with tertiary education, despite being a minority in the industry, almost 15% studied at a training unit of SENAI (Figure 1.15). Almost 40% of the FIC course training received by workers in manufacturing was provided by a SENAI technical school.

Note: Values expressed in billion Brazilian Reals.
Source: Federal budget.

Source: SENAI.
1.1.4. Employer-provided on-the-job training
Employers are usually reluctant to provide general skills training as they fear that workers will leave the firm and earn a premium for their skills elsewhere. As a result, general skills training is underprovided by firms. Employers may have stronger incentives to provide training for job-specific skills. But even so, there are several market failures that can lead employers and employees to sub-optimally invest in job-specific skills. For example, problems with credit markets can prevent firms from financing their investment in training. If employers have market power and are able to keep wages down, workers are also less likely to invest in their own training.
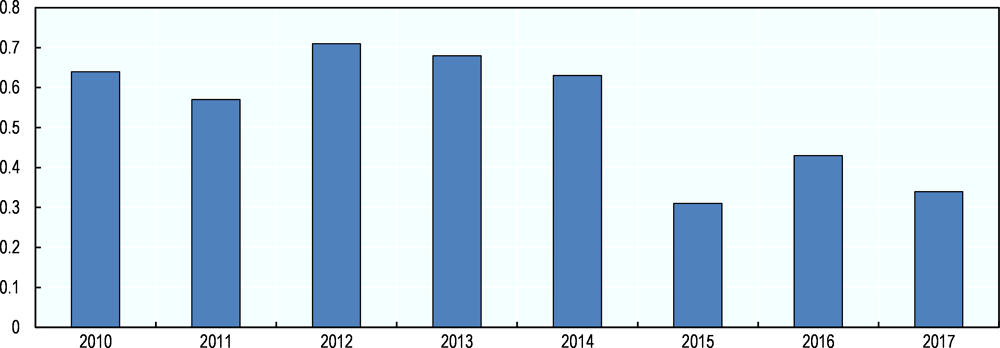
In Brazil, employers remain reluctant to provide on-the-job training. Only 42% of the firms enquired by the World Bank Enterprise Survey in 2009 offered formal training to their employees. From the firms that provided formal training, on average, less than 62% of their workforce took advantage of that training. Both figures lie well below the average for all Latin American and Caribbean countries. In 2016, Brazilian firms offered an average of 22 hours of training per employee, compared to 32 hours in the United States. Furthermore, multinational firms settled in Brazil offered 38% more hours of on-the-job training than domestic firms. In terms of financial investment, Brazilian firms invested in 2016 about 0.46% of their volume of sales on training and personnel development, compared to 1.5% for firms in the United States (ABTB/Integração/Carvalho & Mello/Inteligência Corporativa, 2016). One key barrier for employer-provided training in Brazil is high job turnover rates, which significantly reduce incentives for employers to invest in training of any kind. In Brazil, less than 20% of jobs have a tenure of more than two years (OECD, 2018a).
A sub-optimal level of investment in job-specific skills calls for government intervention to build and upgrade job relevant skills amongst the Brazilian workforce. Solutions can include subsidizing training, tax benefits for firms who invest in on-the-job training, or designing contracts that reduce the likelihood of poaching (payback clauses or apprenticeship contracts), for example.
Government intervention is even more necessary since Brazilian employers report notoriously high levels of hiring difficulties. Before the crisis, over 60% of employers reported difficulties filling out jobs. This figure decreased, but in 2017, despite high unemployment, still one-third of employers kept reporting hiring difficulties (Figure 1.16). This indicates that employers cannot find among the large number of unemployed people, those with the necessary skills set.
Lack of skills is the most important reason why those employers experience hiring difficulties. In fact, 41% of employers cannot find the hard skills they need and another 17% reports difficulties recruiting workers with the necessary set of soft skills (Figure 1.17). Based on the World Bank Enterprise Survey, in 2009, 75% of firms in Brazil identified an inadequately educated workforce as a major constraint to their activity. In comparison, the share of firms identifying an inadequately educated workforce as a major constraint over all Latin and Caribbean countries was less than 32%.
Overall, the conjugation of the economic and labour market situation in Brazil, the demographic pressure, the low educational attainment, the lack of a solid vocational training system and the sub-optimal investment in on-the-job training, will most likely induce several skill imbalances in the form of skill mismatch and skill shortages. The next section highlights the current skill imbalances in Brazil, based on the OECD Skills for Jobs Database 2018.
Source: Talent Shortage Survey 2015 - Manpower Group.

Source: Talent Shortage Survey 2015 - Manpower Group.
1.2. Skill shortages and mismatch in Brazil: highlights from the OECD Skills for Jobs database
The effectiveness of skills policies in addressing existing skill imbalances, promoting employment and fostering firms’ innovation and growth strategies depends on their alignment to labour market needs. That is, whatever policies governments decide to put in place - subsidizing training, tax benefits for firms who invest in on-the-job training, designing contracts that reduce the likelihood of poaching, etc. - their effectiveness will depend upon their capacity to ultimately equip individuals with the skills needed to find jobs.
For that purpose, understanding what these skill imbalances are, whether they come in the form of mismatch or shortages, who experiences skill mismatch and where skill shortages are mostly felt, is crucial to design effective programmes and policies. Brazil already faces several skills shortages, which are unequally spread across its regions. In this section, the current skill shortages in Brazil are underlined using the OECD Skills for Jobs Database 2018.
The Skills for Jobs Database (OECD, 2017c) provides regularly-updated international evidence on skill shortages, surpluses and mismatch. It includes over 30 OECD and partner countries. Two indicators are constructed: an occupational-level indicator and skill-level indicator. The occupational-level indicator measures the extent of shortage/surplus for each occupation at the two-digit ISCO-08 (International Standard Classification of Occupations) level1. However, the use of occupational dynamics to approximate for skill needs does not usually provide the necessary granularity to truly understand the phenomenon (OECD, 2017c). Therefore, occupations are mapped into skill requirements using the O*NET database and another indicator is constructed at the skill-level (further details about the methodology in Box 1.2).
In order to draw a multidimensional picture of the surplus and shortage of workers in specific occupations, the OECD skill needs indicator is made up of five complementary sub-indices capturing different signals of mismatch:
Wage pressure
Wages can be interpreted as the price measure attached to the scarcity of workers and to the skills they possess, which vary according to supply and demand pressures. If wages grow significantly and above the national trend in a specific occupation, this points towards the direction of shortage of skills used in that occupation. Therefore, wage pressure is measured using hourly wage growth by occupation.
Employment pressure
If wages can be interpreted as the price attached to workers’ skills, employment levels are the volumes or quantities. An increase in the quantity of employed workers in a particular occupation or possessing a particular skill can be interpreted as an indication that demand for this occupation or skill is rising.
Nevertheless, statistics about the number of employed individuals are only an imperfect proxy for the volume of services supplied as workers in different jobs often also work different hours. When facing shortages, employers may respond by incentivising over-time or by increasing the hours worked of the available workforce. Hence, an increase in the hours worked by individuals employed in a certain occupation is interpreted as a signal of stronger demand for that occupation and for the associated skills.
Finally, information about skill shortages or surpluses can be extracted from the analysis of unemployment rates at the occupational level. Unemployment provides information about the relative difficulty for specific workers in re-entering the labour market, functioning as a proxy for the demand for the skills of these workers. As such, low unemployment rates signal shortages.
Therefore, employment pressure is measured using total employment growth, growth in hours worked and the unemployment rate, by occupation.
Talent pressure
Pronounced increases in the share of workers with qualifications that are lower than those required by their jobs can be interpreted as a situation where employers are unable to find well-matched candidates and, as a result, revert to hiring underqualified workers. Hence, a sustained increase in under qualification in specific occupations can be signalling the existence of a relatively small pool of candidates with the adequate skills. Therefore, talent pressure is measured using the percentage point difference in the share of workers who are underqualified by occupation.
No single sub-index provides, on its own, a perfect signal for skill needs. Wage growth, for example, might be driven by collective bargaining agreements, rather than by skills imbalances, and employment growth may signal demand for labour, but not necessarily a shortage of skills. By combining all sub-indices into one final composite indicator, the impact of confounding signals is minimised and the power of the final indicator amplified. The value of this index signals the extent of the shortage (positive values) or surplus (negative values) in the occupation.
The composite indicator of surplus and shortage at the occupational level is then translated into skill needs by mapping the occupations to their skill requirements. This mapping is carried out by attaching to occupational results the information provided by O*NET on both the level and importance of different skill dimensions for each one of the occupations analysed (for more information on O*NET). For each skill dimension, the final skill shortage/surplus indicator takes the average of the occupational indicators, weighted by how much they require that particular skill dimension (taking the product of the importance and level for each skill dimension) and by their employment share.
A given skill will be in shortage if occupations in shortage use this skill intensively. In contrast, another skill will be in surplus if occupations do not require the skill as much or the occupations that use the skill intensively are in surplus. The final skill needs indicator provides information about the direction – surplus (negative values) or shortage (positive values) - and the magnitude of the need for a range of skill dimensions.
For Brazil, the indicators were constructed using data from the “Pesquisa Nacional por Amostra de Domicílios” (PNAD), which is an annual national household survey that aims at producing longitudinal information about the population’s participation in the labour market in association with demographic and educational characteristics. The data used refers to 2014. Data from PNAD is collected and statistically treated by the “Instituto Brasileiro de Geografia e Estatística” (IBGE) or the Brazilian Institute for Geography and Statistics.
Administrative data from RAIS (“Relação Annual de Informações Sociais”) could have also been used, however, it is only representative of the formal labour market. Formally employed workers make up only 54% of the entire workforce (Santiago and Vasconcelos, 2017). Therefore, although the sample size in RAIS is much larger than PNAD and data on earnings might be more reliable for not being self-reported, using data that is representative of the entire labour market in Brazil is preferable.
1.2.1. Occupational shortages
According to the 2018 OECD Skills for Jobs database, the occupations that are currently in shortage in Brazil are mostly occupations in the services, health and Information and Communications Technology (ICT) sectors (Figure 1.18).
To begin with, personal care workers, personal services workers and protective services workers, all appear to be in high shortage in Brazil. This includes workers in tourism and hospitality, domestic services, and public safety. Curiously, these are all occupations whose importance is expected to rise further with population ageing, automation and globalisation. For instance, health care assistants and home-based personal care workers are expected to be increasingly needed as life expectancy increases. Travel attendants, touristic guides, cooks, waiters and bartenders, hairdressers and beautician workers, as well as protective services workers, are all related to non-tradable services, that is, services that cannot be off-shored or imported from abroad. Finally, tasks carried out by child care workers and individuals working in teaching or instruction cannot be easily automated.
Health professionals, and particularly, health associated professionals also appear to be in shortage in Brazil. Again, this could be explained by population ageing in Brazil as discussed in sub-section 1.1.2. Health professionals include medical doctors, nurses and midwives, paramedical workers, veterinarians, dentists, pharmacists, physiotherapists, nutritionists, opticians, among others. But the occupations that appear to be in even more significant shortage are medical imaging technicians, pathology laboratory technicians, pharmaceutical assistants, dental prosthetic technicians, dental assistants, ambulance workers, veterinary assistants, among others.
ICT professionals is the second occupational category most in shortage in Brazil. This includes software and applications developers and analysts, as well as database and network professionals. ICT technicians also exhibit a moderate shortage. This refers to ICT user support technicians, web technicians, broadcasting and audio-visual technicians, among others.
Customer services clerks and clerical support workers also seem to be in shortage in the Brazilian labour market. This includes bank tellers, money-lenders, debt collectors, travel consultants, hotel receptionists, survey and market research interviewers, library receptionists or mail carriers. General keyboard clerks and numerical and material recording clerks, however, seem to be in surplus. This includes secretaries, typists, data entry clerks, accounting and bookkeeping clerks or yet, payroll clerks. The former occupations require workers to carry tasks with a human interaction or inter-personal component. The later, on the opposite, are occupations whose tasks are mostly manual, repetitive, and that do not require much human interaction. To some extent, this could already reflect the assimilation of new technologies in Brazil.
Business and administration professionals also appear to be in high shortage, while managers, on the other hand, are in surplus. This means that financial analysts, investment advisers, training and staff development professionals, public relations, advertising and marketing professionals are increasingly difficult to find, while senior managers and chief executives abound.
None withstanding, there are still some low-skilled occupations that seem to be in shortage in Brazil. This includes house builders, bricklayers, stonemasons, carpenters, floor layers, plumbers, precision-instrument makers and repairers, handicraft workers in wood, textile or leather, miners and quarries, shoemaking machine operators, chemical products plant and machine operators, mechanical machinery assemblers, railway operators, taxi, bus, tram and truck drivers, as well as garbage collectors, among many others.
The three occupational categories that exhibit higher surplus are electrical and electronics trades workers, metal, machinery and related trades workers, and sales workers. The first two occupational groups include electrical equipment installers and repairers, electronics and telecommunications installers and repairers, metal workers, metal moulders, and machinery mechanics and repairers. Sales workers include shop sales assistants, shopkeepers, and shop supervisors.
Finally, individual working in legal, social and cultural activities, seem to be in considerable surplus. Individuals working in sciences and engineering, on the other hand, appear to be in right number for the existing demand.
The pattern of occupational shortage in Brazil is quite consistent with the Latin American average (Argentina, Brazil, Chile, Mexico and Peru), with a few punctual exceptions. Compared to the OECD average, however, there are some substantial differences. For instance, all the low-skilled occupations in shortage in Brazil, are in surplus in OECD countries: refuse workers and other elementary workers, assemblers, building and related trades workers, handicraft and printing workers, or drivers and mobile plant operators. On the other hand, workers in sciences and engineering, who are neither in surplus or shortage in Brazil, are mostly in shortage across OECD countries.
These findings are consistent with the previous literature on skill shortages in Brazil. Based on a review of that literature, there is no evidence of a generalised shortage of skilled workers in Brazil, but rather some punctual shortages in very specific areas (Nascimento, 2015). For instance, shortages of builders and health professionals were identified in the recent years.
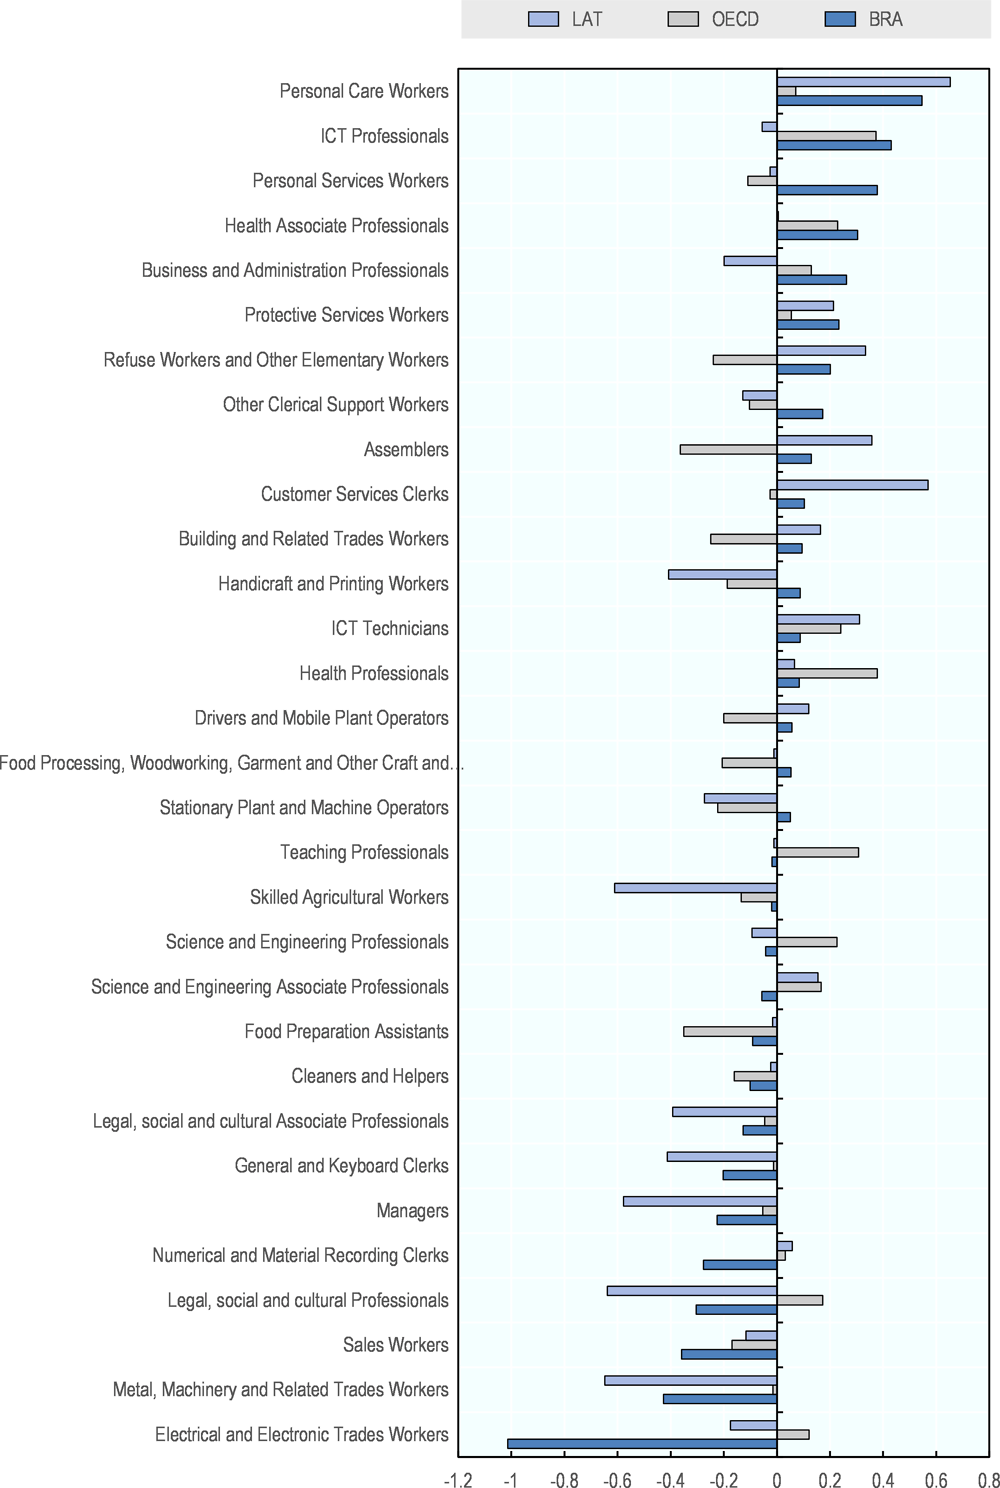
Note: Negative (Positive) values indicate that a specific occupation is in surplus (shortage). Values for Latin America are obtained by taking the average of the occupational indicators for Argentina, Brazil, Chile, Mexico and Peru. Values for the OECD are obtained by taking the average for all OECD countries included in the 2018 OECD Skills for Jobs database. Latest year available for each country.
Source: OECD 2018 Skills for Jobs database. Results for all countries can be visualised at http://www.oecdskillsforjobsdatabase.org.
1.2.2. Skills shortages
Going beyond the shortages indicators at the level of occupations, it is possible to look at the pattern of shortages per work activities, work styles, abilities, knowledge and skills, as defined in the O*NET database.
Work activities are typical behaviours and tasks required to a smaller or larger extent in a very large number of occupations and observed in almost all industries. In O*NET, for example, work activities include looking for and receiving job-related information. This comprises getting information, monitoring processes and surroundings, etc. Another work activity considered is identifying and evaluating job-related information. This includes activities such as identifying objects, actions and events, inspecting equipment, structures and materials, estimate quantities of products, etc.
According to the 2018 OECD Skills for Jobs database, in Brazil and other Latin American countries, there are still shortages of individuals able to perform physical and manual work activities (Figure 1.19). This is in clear contrast with OECD countries, where physical and manual work activities are in surplus. The two other work activities that are most in shortage are to identify and evaluate information, as well as looking for and receiving information, which are cognitive activities also in shortage across OECD countries. On the other hand, administering and data processing are work activities in surplus in Brazil.

Note: Negative (positive) values indicate that a specific work activity is in surplus (shortage). Values for Latin America are obtained by taking the average of the occupational indicators for Argentina, Brazil, Chile, Mexico and Peru. Values for the OECD are obtained by taking the average for all OECD countries included in the 2018 OECD Skills for Jobs database. Latest year available for each country.
Source: OECD 2018 Skills for Jobs database. Results for all countries can be visualised at: http://www.oecdskillsforjobsdatabase.org.
Figure 1.20 looks at the pattern of shortages for work styles. Work styles refer to personal characteristics that can affect how well someone performs a job. Work styles in O*NET are grouped in achievement orientation (achievement/effort, persistence and initiative), social influence (leadership), interpersonal orientation (cooperation, concern for others, social orientation), adjustment (self-control, stress tolerance, adaptability/flexibility), conscientiousness (dependability, attention to detail, integrity), and practical intelligence (Innovation and analytical thinking).
Interpersonal orientation seems to be the work style most in shortage in Brazil. In fact, all its components – concern for others, cooperation and social orientation – exhibit a positive value for the shortage indicator. The second work style most in shortage seems to be conscientiousness, with again, all of its components – dependability, attention to detail and integrity - being in shortage too. Finally, the capacity to adapt, measured through adaptability/flexibility, self-control and stress tolerance, is the third work style most in shortage. On the opposite of the spectrum, analytical thinking and leadership are work styles in surplus. Surpluses could be explained because individuals possess those characteristics in excess or because there is no demand for such character traits.

Note: Negative (positive) values indicate that a specific work style is in surplus (shortage). Values for Latin America are obtained by taking the average of the occupational indicators for Argentina, Brazil, Chile, Mexico and Peru. Values for the OECD are obtained by taking the average for all OECD countries included in the 2018 OECD Skills for Jobs database. Latest year available for each country.
Source: OECD 2018 Skills for Jobs database. Results for all countries can be visualised at: http://www.oecdskillsforjobsdatabase.org.

Note: Negative (positive) values indicate that a specific ability is in surplus (shortage). Values for Latin America are obtained by taking the average of the occupational indicators for Argentina, Brazil, Chile, Mexico and Peru. Values for the OECD are obtained by taking the average for all OECD countries included in the 2018 OECD Skills for Jobs database. Latest year available for each country.
Source: OECD 2018 Skills for Jobs database. Results for all countries can be visualised at: http://www.oecdskillsforjobsdatabase.org.
Figure 1.21 looks at shortages in abilities. Abilities are enduring individual attributes that can influence performance at work, how individuals approach tasks, and how they acquire relevant knowledge and skills. Abilities can be classified in cognitive abilities (verbal abilities, reasoning abilities, quantitative abilities, memory, perceptual abilities, spatial abilities, attentiveness), psychomotor abilities (fine manipulative abilities, control movement abilities, reaction time and speed abilities, physical abilities, physical strength abilities), endurance (stamina), flexibility, balance and coordination (extent flexibility, dynamic flexibility, gross body coordination, gross body equilibrium), sensory abilities (visual abilities, auditory and speech abilities).
In Brazil, consistent with the work activities most in shortage, the abilities that are most needed are related to psychomotor abilities and endurance. On the contrary, cognitive abilities are either in surplus, or exhibit a small shortage. Cognitive abilities, especially quantitative abilities, verbal abilities, memory and reasoning abilities, are amongst the least needed ones. This is in sharp contrast with OECD countries, where cognitive abilities are significantly in shortage and psychomotor abilities are in surplus.
Knowledge are organised sets of principles and facts applying in general domains. Knowledge can be acquired or developed through experience and education. Some jobs require specific knowledge, in which case, having acquired such facts and principles may affect work performance. O*NET considers several categories of knowledge. For example, the knowledge category “business and management” includes knowledge in the areas of administration and management, clerical, economics and accounting, sales and marketing, customer and personal services, personnel and human resources. The shortage indicators for knowledge are depicted in Figure 1.22.

Note: Negative (positive) values indicate that a specific knowledge is in surplus (shortage). Values for Latin America are obtained by taking the average of the occupational indicators for Argentina, Brazil, Chile, Mexico and Peru. Values for the OECD are obtained by taking the average for all OECD countries included in the 2018 OECD Skills for Jobs database. Latest year available for each country.
Source: OECD 2018 Skills for Jobs database. Results for all countries can be visualised at: http://www.oecdskillsforjobsdatabase.org.
Business and management, including personal and human resources management, is the knowledge type most in surplus in Brazil. It is followed by knowledge in engineering and technology. On the other hand, knowledge in health services is in significant shortage. Knowledge in education and teaching also appears to be in shortage in Brazil, which is consistent with the revision of the previous literature (Nascimento, 2015). Again, the pattern in Brazil is very much in line with the pattern of shortages in knowledge types experienced by other Latin American countries, with the exception of knowledge in manufacturing and production, education and training, and finally, mathematics and science. Brazil and other Latin American countries exhibit a pattern that is quite distinct from OECD economies, where all knowledge are in shortage except for knowledge in manufacturing and production.
Finally, skills allow individuals to establish procedures to work with given knowledge. Skills are also acquired or developed through experience. In O*NET, skills are divided into different categories. Basic content skills, for example, includes reading comprehension, active listening, writing, speaking, mathematics and science. Basic process skills, on the other hand, includes critical thinking, active learning, learning strategies, and monitoring. Skills shortages are represented in Figure 1.23.
Resource management skills are amongst the skills most in surplus in Brazil – either because the current workforce already possesses too much of this type of skills or because current jobs and vacancies do not require them. System skills also appear not to be needed at the current moment, particularly, systems analysis and systems evaluation. Some basic skills, such as mathematics, reading comprehension, writing and speaking, are also in surplus. On the contrary, in Brazil, social and technical skills appear to be in shortage. This includes service orientation, coordination and social perceptiveness in one hand, and operation monitoring, operation and control, and quality control analysis, on the other hand.
Analysing the results of the OECD Skills for Jobs database can be very informative about the current skill shortages in Brazil. Nevertheless, there are other methods to assess skill shortages that are less data intensive and that should be used to complement the type of analysis conducted in this chapter. Additionally, for education, training, employment and migration policies, assessing the current state of the labour market may already be too late, as some policies take a significant amount of time to be implemented and to produce the desired effects. The next chapter will describe methods to anticipate skill needs and how these methods could be implemented in Brazil.

Note: Negative (positive) values indicate that a specific skill is in surplus (shortage). Values for Latin America are obtained by taking the average of the occupational indicators for Argentina, Brazil, Chile, Mexico and Peru. Values for the OECD are obtained by taking the average for all OECD countries included in the 2018 OECD Skills for Jobs database. Latest year available for each country.
Source: OECD 2018 Skills for Jobs database. Results for all countries can be visualised at: http://www.oecdskillsforjobsdatabase.org.
References
ABTD/Integracao / Carvalho & Mello / Inteligencia Corporativa (2016), O panorama do treinamento no Brasil: Fatos, Indicadores, Tendências e Análises, 11ª edição. https://www.integracao.com.br/pesquisa-panorama-do-treinamento-no-brasil-2016.pdf.
Almeida R. et al. (2015), “Investing in technical and vocational education and training: does it yield large economic returns in Brazil?” Policy Research Working Paper No. 7246, World Bank, Washington. License: CC BY 3.0 IGO. https://openknowledge.worldbank.org/handle/10986/21861.
CNI (2013), Sondagem especial indústria de transformação e extrativa, Confederação Nacional da Indústria, Ano 3, No. 2, Brasília. http://arquivos.portaldaindustria.com.br/app/conteudo_18/2013/10/28/5230/20131028145358467214a.pdf.
FGV (2016), Mapping New Skills in the State of São Paulo. https://www.jpmorganchase.com/corporate/news/pr/addressing-the-workforce-readiness-gap-in-sao-paulo.htm
Frischtak, C. (1992), “Banking automation and productivity change: the Brazilian experience”. World Development, Vol. 20, Issue 12, pp. 1769-1784.
Girardi, S. N. et al. (2011), Índice de escassez de médicos no Brasil: um estudo exploratório do âmbito da atenção primária. In: PIERANTONI, C. R.; POZ, M. R. D.; FRANÇA, T. (Eds.). O trabalho em saúde: abordagens quantitativas e qualitativas. Rio de Janeiro: IMS/ObservaRH, pp. 171-186.
Hershbein, B. and B. Kahn (2017), “Do recessions accelerate routine-biased technological change? Evidence from vacancy postings”. NBER Working Paper No. 22762. Employment Research, vol 24(4), pages 1-4.
Maciente, A. N. and P. Nascimento (2014), Demanda por engenheiros e profissionais afins no mercado de trabalho formal. In: OLIVEIRA, M. et al. (Ed.). Coletânea da rede de pesquisa “Formação e Mercado de Trabalho”. Brasília: Ipea; ABDI, v. 4 – A formação nas áreas de ciências, tecnologia, engenharia e matemática (CTEM), cap. 3, p. 99-133.
Nascimento, P. (2015), Escassez de força de trabalho: uma revisão da literatura internacional e interpretação dos resultados empíricos referentes ao Brasil, IPEA.
Neri, M. et al. (2013), Escassez de médicos. Rio de Janeiro: CPS/FGV, 2008. http://goo.gl/9KMRRT.
Neri, M. (2013), Escolhas universitárias e performance trabalhista. Radar: tecnologia, produção e comércio exterior, v. 27, p. 7-20. http://goo.gl/3mZAEv.
NESTA (2017), The future of skills: employment in 2030. https://www.nesta.org.uk/report/the-future-of-skills-employment-in-2030/.
OECD (2018a), OECD Economic Surveys: Brazil 2018, OECD Publishing, Paris. https://doi.org/10.1787/eco_surveys-bra-2018-en
OECD (2018b), Getting Skills Right: Future-ready adult learning systems, OECD Publishing, Paris. Forthcoming.
OECD (2017a), Pensions at a Glance 2017: OECD and G20 Indicators, OECD Publishing, Paris. https://doi.org/10.1787/pension_glance-2017-en
OECD (2017b), Education at a Glance 2017: OECD Indicators, OECD Publishing, Paris. https://doi.org/10.1787/eag-2017-en
OECD (2017c), Getting Skills right: Skills for Jobs Indicators, OECD Publishing, Paris, https://doi.org/10.1787/9789264277878-en
OECD (2016), Low-Performing Students: Why They Fall Behind and How To Help Them Succeed, OECD Publishing, Paris. https://doi.org/10.1787/9789264250246-en.
OECD (2015), OECD Economic Surveys: Brazil 2015, OECD Publishing, Paris. https://doi.org/10.1787/eco_surveys-bra-2015-en
Ruiz, A. I. et. al. (2007), Escassez de professores no ensino médio: propostas estruturais e emergenciais. Brasília. MEC. http://goo.gl/2pdT8X.
Santiago, C. and A. Vasconcelos (2017), Do catador ao doutor: um retrato da informalidade do trabalhador por conta própria no Brasil. Nova Economia, 27(2).
Schartzmann, S. and C. de Moura Castro (2013), “Ensino, formação professional e a questão da mão de obra”. Aval. pol. públ. Educ., Rio de Janeiro, v. 21, n. 80, p. 563-624.
SENAI (2016), Mapa do Trabalho Industrial 2017-2010. http://arquivos.portaldaindustria.com.br/app/conteudo_18/2016/10/19/12033/ApresentaoMapadoTrabalhoIndustrial20172020.pdf
Vieira, R. S. and L. Servo (2014), Escassez de médicos no Brasil: análise de alguns indicadores econômicos. Radar: tecnologia, produção e comércio exterior, v. 32.
Villalobos Barría, C. and S. Klasen (2016), “The impact of SENAI’s vocational training program on employment, wages, and mobility in Brazil: Lessons for Sub Saharan Africa?” The Quarterly Review of Economics and Finance, vol. 62, issue C, pp. 74-96.
WORLD BANK GROUP (2016), Retaking the Path to Inclusion, Growth and Sustainability: Brazil Systematic Country Diagnostic. World Bank, Washington, DC. License: CC BY 3.0 IGO. https://openknowledge.worldbank.org/handle/10986/23954
Zago, R. (2018), Skill mismatch and the Great Recession. https://doi.org/10.2139/ssrn.3004759.
Zanotto, E. D. (2002), “Scientific and technological development in Brazil: the widening gap”. Scientometrics, Vol. 55, No. 3, pp. 383-391
Note
← 1. The International Standard Classification of Occupations (ISCO) has been developed by the International Labour Organisation (ILO). More information at: http://www.ilo.org/public/english/bureau/stat/isco/isco08/.