Chapter 2. The expansion of the financing for sustainable development system: More actors and resources
The sustainable development finance system has profoundly changed in recent years, with a greatly expanded number of actors. The expansion raises questions about the distribution of the roles and calls for a new mapping of contributions.
This chapter presents snapshots of the sustainable development finance landscape by presenting the volumes provided by different actors – external, domestic, public and private – and the repartition of different sources over time. A more granular picture is given about the different roles of actors and their resources. The chapter further examines the impact of the financial and economic shifts of recent years on these types of finance, with emphasis on the historical context and each financing type’s particular niche.
In brief
The Addis Ababa Action Agenda (AAAA) widens traditional definitions of development finance, outlining responsibilities and actions for domestic, international, private and public actors. The potential scope of resources available to finance sustainable development is greatly expanded.
Developing country governments and their resources are the central pillar of the financing for sustainable development landscape. But there is a clear need for more revenue.
-
In 2016, tax revenues amounted to USD 4.3 trillion, more than twice the volume of cross-border flows.
-
But the tax revenue-to-GDP ratios in low-income and least developed countries average 14% and in many cases are far below the 15% threshold recommended as necessary for effective state functioning.
Domestic investment makes up a substantial proportion of most countries’ GDP, but due to tighter financing conditions private investment appears to be in sharp decline.
-
Excluding the People’s Republic of China (“China”), domestic mergers and acquisitions declined by over 60% between 2010 and 2017, falling from USD 237 billion to USD 95 billion.
Substantial amounts of cross-border finance already flow to developing countries, amounting to a total of USD 1.7 trillion in 2016.
Private sector actors provide the bulk of cross-border finance, but these flows show an alarming decline.
-
Commercial investors are the single largest provider, with USD 890 billion in FDI, portfolio investment and long-term debt in 2016.
-
Developing countries have foregone between USD 400 and 450 billion of FDI from 2012-2016. In addition to the substantial decline in financing, this can mean fewer opportunities to access international markets and technical know-how.
Developing country emigrants provide remittances, the second largest and the most stable source of external financing for sustainable development.
-
Remitters sent USD 466 billion in 2017 and in some smaller economies these flows make up close to or more than 30% of national GDP, the latter being the case in Kyrgyzstan.
Public sector, i.e. official, providers deploy substantial resources and can play a special role in targeting the most vulnerable countries.
-
Bilateral and multilateral providers deployed USD 311 billion in 2016. Since 2000, financing provided at concessional terms grew most rapidly for the group of low-income countries and fragile and conflict-affected countries.
Philanthropic foundations are key players in the health sector and sometimes pioneer innovative financing solutions, but they have provided smaller volumes than other providers.
-
Of the USD 8 billion of philanthropic giving that flowed into developing countries per year from 2013-2015, an average USD 3.21 billion or 40% of the total targeted the health sector.
Financing the Sustainable Development Goals (SDGs) in developing countries can only be successful if these different contributions are fully understood and exploited. Although the sum of available resources holds great promise to meet the financing needs of the 2030 Agenda, they are not yet sufficiently oriented towards development goals – and, indeed, bringing together this diverse set of actors with different motivations is an enormous challenge in itself.
Data constraints, for example regarding actors in developing countries, make it difficult to fully take in the total picture.
-
One example of such constraints is that estimates on the amounts of concessional finance provided by China in a year range from USD 3 billion to USD 7 billion.
-
Another example is that while domestic public expenditure and private investment are important drivers of financing for development, data on their volumes and uses are extremely limited.
A further challenge is that the SDGs and the AAAA reflect commitments by countries that are made in the name of non-state, third parties who also have important roles in financing for sustainable development. Decisions regarding some of the largest pools of resources – cross-border investments and remittances – are based on private actors’ considerations that are not primarily motivated by the SDGs. A key challenge, then, is to identify win-win opportunities that meet the motives of such private actors and contribute to the achievement of the SDGs at the same time.
Domestic sources of financing and internal drivers
The AAAA underscores that every country has primary responsibility for its own economic and social development (paragraph 9). The ultimate aim of development finance efforts is to achieve a sustainable development finance system that is based on well-functioning and effective domestic mechanisms and integrated into the global system. Effective and efficient tax systems, public financial management systems, governance, and vibrant and resilient markets all play key roles.
While it is the primary role of domestic actors in developing countries to ensure that these internal drivers and domestic resources function properly, the international community and external resources (flows) could support their efforts. The domestic and international spheres are highly interconnected in areas such as taxation and the financial system, highlighting the importance of the international environment and policy framework to support an individual country’s efforts.
Domestic public sector
The domestic public sector’s resources affect the Sustainable Development Goals
Governments have the primary responsibility for implementation of the 2030 Agenda, through direct financing and setting the regulatory environment for foreign and domestic private investment.
Tax revenues are the largest source of finance, exceeding the volumes of any single cross-border resource. In 2016, tax revenues in developing countries amounted to USD 4.3 trillion. The share of tax revenues in the overall finance mix varied from 42.7% in least developed countries and 42.4% in low-income countries to 62.2% in lower middle-income countries and 78.2% in upper middle-income countries.

Note: The estimates have been calculated for the list of developing countries eligible for ODA but do not include a number of countries and territories because of lack of data on tax revenue. Those excluded are the following low-income countries (LICs): Democratic People's Republic of Korea; Somalia, which is also a least developed country (LDC); and South Sudan (also an LDC).
Among lower middle-income countries and territories (LMICs), the following are excluded: Bhutan (LDC), Kosovo, Mongolia, Myanmar (LDC), Sri Lanka, Syrian Arab Republic, Vanuatu (LDC), West Bank and Gaza Strip. A third group excluded are upper-middle income countries (UMICs): Cuba, Fiji, Former Yugoslav Republic of Macedonia, Libya, Montenegro, Nauru and Venezuela.
Sources: IMF (2017[1]), “World Revenue Longitudinal Data”, https://data.world/imf/world-revenue-longitudinal-dat; OECD (2018[2]), “Global Revenue Statistics Database”, https://stats.oecd.org/index.aspx?DataSetCode=REV;
OECD (2018[3]), “Creditor Reporting System” (database), https://stats.oecd.org/Index.aspx?DataSetCode=crs1;
World Bank (2018[4]), “Migration and Remittances Data”, http://www.worldbank.org/en/topic/ migrationremittancesdiasporaissues/brief/migration-remittances-data; IMF (2017[5]), “Balance of Payments” (database) 2017, http://www.imf.org/external/datamapper/datasets/BOP for private investment data.
Greater public resources are associated with greater spending on SDGs such as health (SDG 3) and education (SDG 4).1 Domestic public resources can help tackle inequality (SDG 10) by redistributing wealth in ways that are acceptable to society as a whole. While evidence on the redistributive implications of tax systems in developing countries remains limited, recent findings confirm that fiscal systems in developing and developed countries can reduce inequality and support inclusive growth (Box 2.1).
The experience of developed countries shows that sound fiscal policies can play an essential role in mitigating inequalities and also can foster sustainable growth. Most countries have experienced a rise in income and wealth inequality in recent decades, but to different extents and at different speeds. The dynamics of inequality are strongly influenced by management of public wealth, regulation of financial markets, labour laws and fiscal policies such as efforts to prevent tax evasion (Alvaredo et al., 2018[6]). The experience of developed countries with regard to inequality and fiscal policies has proven that progressive taxation, well-targeted transfers and quality expenditure to benefit the poor show great potential to efficiently perform redistribution. Indeed, regression-based studies, carried out for the most part in developed economies, suggest that higher spending on social benefits and greater reliance on direct taxes may reduce inequalities (IMF, 2014[7]).
How taxes are structured matters for their impact on inequality. Indirect taxes are usually regressive because poorer populations consume a greater proportion of their income. Direct taxes levied on labour, capital income, wealth and inheritance are more likely to be progressive and are more likely to reduce inequality, if designed to impose higher tax rates on individuals who are able to contribute more (Alvaredo et al., 2018[6]).
Like taxes, social expenditures can reduce inequality. Expenditure on education and health systems that cover a wide range of the population may bring about better employment prospects, wider participation in the political process and increased well-being, and so foster equality of opportunities (OECD, 2008[8]). Social safety nets such as unemployment benefits and social pensions can improve the resilience of households to economic shocks and, in this way, help to lift the most vulnerable individuals out of poverty (World Bank, 2018[9]).
The composition of spending can be as important as the volume of public resources available, and redistributive spending can help rebalance regressive features in the tax system. It thus is important to look at redistributive impact of the fiscal system as a whole. A commitment to equity in the design of fiscal policies can itself support a reduction of inequality. Social spending as a share of GDP in most low-income and middle-income countries amounts to barely half the average social spending in high-income countries. An ongoing study of 28 low-income and middle-income countries has found that fiscal policies2 unambiguously reduce inequality and increase equality of income. They also have a poverty-decreasing effect in most countries (Lustig, 2017[10]).
Domestic public resources are not yet sufficient to meet global and country ambitions
Countries may choose different approaches to the financing of development that involve lower tax ratios; different dimensions of development such as fragility, economic vulnerability and human capital development may affect the ability to raise revenues.3 Without an agreed, ideal tax-to-GDP ratio, a ratio of 15% is increasingly recommended as a minimum benchmark for effective state functioning (IMF et al., 2016[11]) (Gaspar, Jaramillo and Wingender, 2016[12]). As shown in Figure 2.2 2.2, low-income and least developed countries remain some distance below this ratio, although since 2005, some progress has been made in increasing the ratios. The average ratio in middle-income countries is above 15% but this is still well below the 2016 OECD average of 34.3%,4 indicating significant room to grow tax revenues to finance sustainable development. Such growth becomes increasingly urgent if – due to rising debt levels in developing countries – opportunities to finance public spending through debt financing narrow in the future (Chapter 5).

Note: The ratios are calculated for countries in the OECD list of developing countries receiving ODA.
Sources: (IMF, 2017[1]), “World Revenue Longitudinal Data”, https://data.world/imf/world-revenue-longitudinal-dat; (OECD, 2018[2]), “Global Revenue Statistics Database”, https://stats.oecd.org/index.aspx?DataSetCode=REV.
There are substantial differences in countries’ ability and capacity to increase tax revenues. Moreover, mobilising more tax revenues may not always be desirable given the opportunity costs it involves. Tax effort estimates gauge the ratio between revenue and potential revenue given a country’s current GDP, level of development, etc. While there is relatively little research in this area, one study by Fenochietto and Pessino (2013[13]) has found high-income countries showed a higher tax effort (77%) than did low-income countries (65%) and middle-income countries (64%). However, there is significant variation within these categories and a large number of developing countries appeared to be operating close to their potential. Regionally, Africa had the second-highest level of tax effort (71%), behind only Europe (77%) and significantly ahead of Asia Pacific (59%).
Especially where tax effort is already high, increasing revenues often depends not just on tax policy changes and administrative improvements but also on growth and structural changes in the economy. In consequence, growing the domestic private sector is vital, as is discussed further elsewhere in this chapter. Many developing countries also have very large informal sectors and underground economies where cash transactions leave no audit trails for tax purposes. Even where income is declared, it is often grossly underestimated. Many developing countries face additional challenges to growing tax revenues, among them weak revenue administrations and poor governance. But assertive policy approaches can make a difference, as shown in the essay on Indonesia’s tax reform (Box 2.2 “Tax reform and quality spending are crucial for a more sustainable and inclusive economy”).
International tax policies also have a substantive impact on tax revenues, for example by eroding multinational enterprises’ ability to shift profits offshore and avoid corporate taxes in the countries of operation. This is particularly important for developing countries, for which spillovers in international corporate taxation are especially marked and important (IMF, 2014[14]).
Reform is essential for revenue collection and equity promotion
Understanding that a sound tax system is a core element to support sustainable development, the government of Indonesia recently implemented the tax amnesty programme. Launched in 2016, this programme has successfully involved 973 400 taxpayers with total redemption payments reaching Rupiahs 115.9 trillion (around USD 8.5 billion) and a total of IDR 4 865.7 trillion (approximately USD 366 billion) worth of assets have been declared to Indonesia's tax office under the programme, surpassing the government’s target.
As a follow-up to the tax amnesty programme, the government of Indonesia has also implemented a comprehensive tax system reform to enhance progressivity and to address ineffective and excessive incentives and exemptions. Through simplification of the tax administration process, tax compliance will be enhanced in the short term. To maintain the compliance in the long term, tax education will be integrated into the formal education programme. The use of information technology will facilitate the improvement of tax database management and tax monitoring.
The quality of spending helps drive sustainable and inclusive development
Following an increase in global oil prices, Indonesia undertook reforms in the fuel subsidy scheme in 2015, to increase the fiscal space and to reduce incentive distortions from mis-targeted subsidies. Fuel subsidies amounting to Rupiahs 180 trillion were re allocated to more productive spending such as infrastructure financing, which increased significantly to Rupiahs 410.4 trillion in 2018 from Rupiahs 154.7 trillion in 2014.
Removal of the fuel subsidy also provided the opportunity to increase budget allocations to other priorities such as health, education and social assistance. In addition, the government is currently ramping up the social services programmes and increasing transfers to subnational governments and villages to create a more balanced, inclusive and sustainable economy.
The OECD has an important role to play
Learning from Indonesia’s experience, the OECD’s role in financing for development can include helping developing countries to bridge their policy gaps in addressing sustainable and inclusive development while also bringing them closer to a level playing field. This means capacity building through country-level policy review and global-level policy and performance benchmarking. In addition, the OECD can help to fine tune and improve the implementation of initiatives and programmes by providing review and assessment on progress, identifying problems, and providing policy recommendations at the global, regional and country level. In addition, and, based on its country-level work, the OECD can provide advice to better link global and regional initiatives to country priorities, thus further enhancing country ownership and commitment.
International efforts are needed for more domestic resource mobilisation
International partners need to consider how best to support developing countries to reach their potential to mobilise greater domestic revenue. For most countries, the most effective actions will be a combination of development co-operation and policy coherence. The Addis Tax Initiative acknowledges this: donor country signatories have committed to collectively double their spending on tax capacity development between 2015 and 2020 and to improve policy coherence for development in tax matters.
Committing resources for capacity building is important, but this must be matched with a commitment to ensuring impact. Even when doubled, ODA to domestic revenue mobilisation will only be USD 445 million and represent just around 0.3% of ODA, so ensuring maximum return is important. To do so may require new approaches to capacity building. One innovative approach is that of Tax Inspectors Without Borders, which deploys experienced tax auditors to work with countries’ revenue authorities on live cases and has mobilised USD 414 million in additional tax revenue so far. Its return on investment is thus more than 100:1.
Additionally, domestic policies in developed countries can be aligned to support domestic revenue mobilisation in other countries. The most obvious way to accomplish this is by adopting new international standards on exchange of information and taxation of multinational enterprises and by supporting their implementation. These standards commit countries to co-operation and therefore enhance the ability of all countries to raise revenues (Chapter 5). The automatic exchange of information (AEOI) will enable tax authorities to automatically receive information about their taxpayers’ offshore financial accounts. Over 100 jurisdictions are currently committed to implementing AEOI. Bringing more developing countries into this network offers huge potential, as testified by Indonesia’s experience and described in Box 2.2. The OECD/Group of Twenty (G20) Base Erosion and Profit Shifting (BEPS) project provides a range of tools to address the main methods used by multinational enterprises to shift profit offshore. Moreover, the 117 countries and jurisdictions that are members of the Inclusive Framework on BEPS are committed to meeting the four minimum standards that address cross-border challenges. Both information exchange and the BEPS Actions significantly increase the information available to and options for developing countries to effectively tax cross-border activity. To further realise this potential, it is important that the tools are designed in a way that is fit for purpose and especially that takes account of capacity constraints in developing countries. In this regard, the establishment of the Inclusive Framework on BEPS is a significant development as it brings developing countries into the international standard-setting processes on tax on an equal footing.
Efforts to grow tax revenues must be accompanied by support for strong public financial management systems. The role of governments is not only to mobilise resources but also to use those resources to advance sustainable development. Improvements in the tax system that are not accompanied by improvements in the way resources are spent are not likely to achieve the desired development outcomes. To ensure that resources are spent in an effective and sustainable way, it is important to embed domestic resource mobilisation approaches in broader fiscal governance frameworks.
Domestic private sector
Domestic investment is the main source of capital formation, but it appears to be in decline
Domestic private investment can take the form of investment by private enterprises of retained profits and/or finance from other sources and potentially through banks, private equity or the growing number of stock markets.
Domestic private investment is challenging to measure empirically because indicators are often mingled with other categories. One possible proxy to estimate the portion of capital formation financed by domestic resources is gross fixed capital formation less FDI as a percentage of GDP. Figure 2.3 shows that despite considerable variation across developing countries, total domestic investments generally make up a sizable portion of GDP. The relationship between domestic investments and GDP increases steeply at lower per capita income levels and reaches over 20% of GDP for many developing countries including low-income countries and lower middle-income countries. In comparison, total external financing on average represents less than 20% in low-income countries, less than 10% lower middle-income countries and less than 5% in upper middle-income countries.

Note: The graph plots domestic resources as captured by the difference between gross fixed capital formation (GFCF) in the private sector and foreign direct investment net inflows. Countries included in the graph are low to upper middle-income countries for which data on GFCF in the private sector, FDI and GDP are available. These are Angola, Bangladesh, Bolivia, Botswana, Burundi, Cameroon, Chad, Republic of the Congo, Croatia, Democratic Republic of the Congo, Egypt, El Salvador, Georgia, Ghana, Guyana, Honduras, the Islamic Republic of Iran, Lebanon, Madagascar, Malawi, Malaysia, Mauritania, Mauritius, Mexico, Nepal, Niger, Pakistan, Panama, Peru, Philippines, Russian Federation, Senegal, Sierra Leone, South Africa, Sudan, Suriname, Swaziland, Thailand, Togo, Uganda, Uzbekistan and Yemen.
Source: World Bank (2018[15]), “World Development Indicators” (database), http://databank.worldbank.org/data/reports.aspx?source=world-development-indicators.
Domestic private investment appears to be in decline. Excluding China, domestic mergers and acquisitions (M&A) declined by over 60% between 2010 and 2017, falling to USD 95 billion from USD 237 billion. This decline corresponds closely to the broader downward trend in foreign investment and especially cross-border M&A in developing countries, which fell by about USD 72 billion, or 30%, as discussed later in this chapter. With some notable exceptions,5 domestic M&A has fallen faster. This suggests that some of the same factors that have reversed the foreign investment trajectory, such as economic recovery in developed countries and record levels of corporate debt in developing countries, are also dampening domestic investment M&A.
To counterbalance these trends, active measures have to be taken to promote domestic investment in developing countries by addressing bottlenecks and risks. The international community can support this by providing technical as well as financial assistance for a better enabling environment including legal and regulatory frameworks.
Financial sector development is a key driver of domestic investment
In designing enabling environments, financial sector development will be key. A well-functioning financial system mobilises domestic savings, improves resource allocation, and facilitates diversification and management of risk (Levine, 2005[16]). Financial sector development is a critical enabler of the 2030 Agenda. Indeed it is included as a target in 8 of the 17 SDGs. These include SDG 1 on eradicating poverty; SDG 2 on ending hunger, achieving food security and promoting sustainable agriculture; SDG 3 on ensuring health and well-being; SDG 5 on achieving gender equality; SDG 8 on promoting economic growth and jobs; SDG 9 on supporting industry, innovation, and infrastructure; and SDG 10 on reducing inequality. SDG 17 on strengthening the means of implementation also includes an implicit role for greater financial inclusion through greater savings mobilisation for more investment and growth (UN Capital Development Fund, 2018[17]).
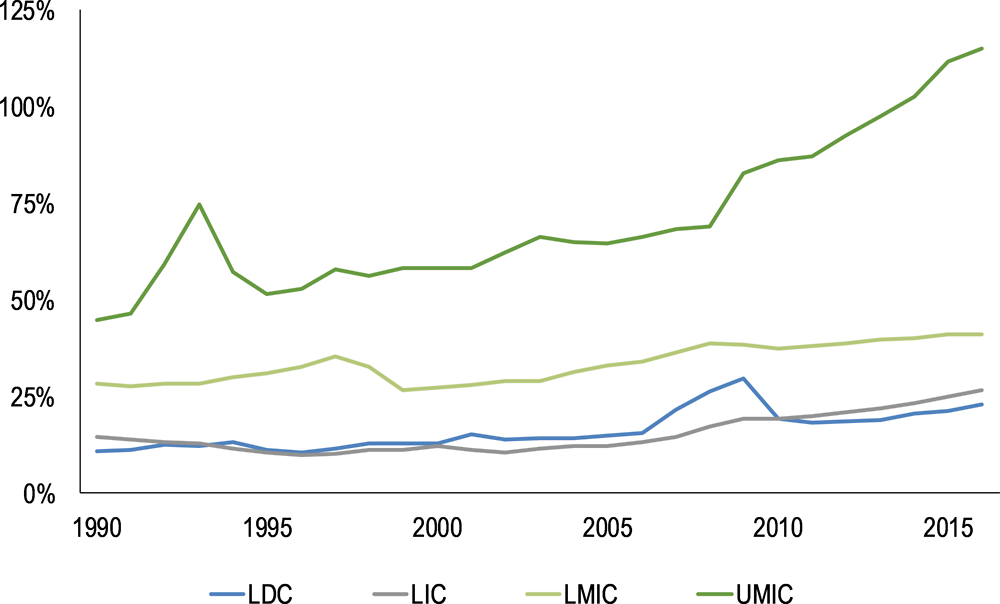
Globally, some progress is being made in terms of promoting financial sector development. Financial sector deepening, which can be measured by the extent of domestic credit generation and its share in GDP, has increased especially sharply for upper middle-income countries (Figure 2.4). At the same time, the ratio in low-income countries has increased by nearly 50% since 1990 but nevertheless remains very low, suggesting the need for additional deepening. Weak institutional, legal and regulatory environments and capacities are often cited as the main challenges to be overcome to deepen the financial system (IMF, 2012[18]).
Source: World Bank (2018[15]), “World Development Indicators” (database), http://databank.worldbank.org/data/reports.aspx?source=world-development-indicators.
In addition to depth, financial sector access, efficiency and stability are important for development outcomes (Levine, 2005[16]). Between 2011 and 2017, the proportion of the world’s adult population with an account at a financial institution grew to 69% from 51%, an increase of about 1.2 billion people (Demirgüç-Kunt et al., 2018[19]). Technological advances have led to an expansion of financial services: mobile banking services now are helping to reach large numbers of unbanked people and extend formal financial services to the poor, especially in sub-Saharan Africa. In Kenya, 73% of adults have a mobile payment account and about 50% have one in Uganda and Zimbabwe (Demirgüç-Kunt et al., 2018[19]). Nevertheless, serious concerns remain about the security of transactions that are made through mobile banking, and regulatory mechanisms are not yet in place (Reaves et al., 2017[20]).
Foreign-owned banks dominate the banking systems of many developing countries, notably in Latin America and sub-Saharan Africa. This brings competition and efficiency but also the risk of transmitting external shocks. For developing countries, the median share of assets held by foreign banks rose to 52% in 2008 from 8% in 1995. In comparison, the median share in developed countries rose to 27% from 5% over the same period.6 Foreign banks can bring competition, efficiency and a stabilising influence on domestic economies in times of crisis (Cull et al., 2017[21]). But the global financial crisis highlighted that foreign banks also can transmit external shocks and crises to the domestic economy by reducing their lending earlier and faster than domestic banks and by repatriating funds to their home countries (Anginer et al., 2014[22]).
There have been efforts since the crisis to ensure that developing country concerns are reflected in the international financial system. At the request of the G20, the Financial Stability Board, in collaboration with the International Monetary Fund (IMF) and the World Bank, has been monitoring the effects of regulatory reforms on emerging markets and developing economies, taking developing country concerns into account in the design of the international regulatory framework. With the recent finalisation of global financial regulatory reforms, international financial organisations also are preparing to step up capacity-building efforts to assist the implementation of the new standards. An example is the launch by the IMF of the Financial Sector Stability Fund in November 2017 to assist low-income and lower middle-income countries as they assess and address risks and vulnerabilities in the financial sector.
Despite significant progress, deficiencies or market failures can often hamper access to finance for segments of society. A lack of sustainable lending to small and medium-sized enterprises (SMEs) constrains growth in low-income countries. The International Financial Corporation (2013[23]) estimates that the credit financing gap for formal SMEs in developing economies is close to USD 1 trillion. A gender gap in access to finance also persists. Globally, 72% of men have a bank account compared to just 65% of women, and the gender gap is even higher – at nine percentage points – in developing countries (Demirgüç-Kunt et al., 2018[19]).
Policy makers have to ensure that the financial sector is socially and environmentally sustainable. Initiatives to build what Grameen Capital India has termed a “capital-with-a-conscience ecosystem” are examples of ongoing efforts described in Box 2.3 “Getting private resources on board for sustainable development”. Particular attention has to be given to low-income countries, as financial sector inefficiencies tend to weigh more heavily on these places than on middle-income countries, as the former tend to be more vulnerable to fluctuations in commodity prices and external financing (Eichengreen, Park and Shin, 2017[24]).
GOOOOAAAAAALLLLLL! The frenzied celebration that reverberates across the globe every time a goal is scored reflects the seemingly universal passion for football. The game cuts across generations, blurs political boundaries and traverses ethnic divisions. Sadly, some other things do too – hunger, refugee crises, poverty and global warming, to name a few. And yet, everywhere I look, there also exist shining examples of H.O.P.E.
Holistic approach. Governments, corporations, capital markets, non-governmental organisations, etc. need to find integrated solutions. One exceptional example is the catalytic potential of using corporate social responsibility/philanthropic capital to de-risk investment from the capital markets. The financial sector can help guide companies to look towards a long-term sustainable future. Grameen Foundation’s Growth Guarantees programme did precisely that by bringing together donors, international and local banks, microfinance institutions, and poor, vulnerable women borrowers.
Outcome funding. For too long, the focus has been financing for inputs such as grants for health programmes, budget allocations for education outreach and similar targets. However, the recent innovations in outcome financing or “pay for success” seem to be gathering momentum. The Educate Girls programme in Rajasthan, India, aims to improve learning outcomes and enrolment in schools in Rajasthan. This has tremendous potential, as capital market players can collaborate with development agencies to structure innovative financing vehicles that de-risk the investor and ensure outcomes are well-defined, measured and achieved, leading to a win-win situation for all.
Policy-led leadership. Policy makers have a key role as enablers in meeting the 2030 Agenda. Some of the recent policies in India are heartening – changing the country’s fund architecture to include social venture capital funds, the Companies Act regulation proposing that 2% of profits be contributed to CSR, the Central Bank regulations related to priority sector lending and small finance banks – and they point as well to a greater sensitivity and a crowding-in of conscious capital. Similar policy initiatives in developing countries could trigger the initial momentum required to catalyse the development of the market. Globally, countries such as the United Kingdom and the United States have also instituted treasury initiatives to attract commercial capital to the impact landscape.
Ecosystem. Each stakeholder has a role to play. But the effect is even more pronounced, scalable and sustainable when an enabling ecosystem is created. It is heartening to witness the collaboration, especially regarding sustainable development, among many multilateral agencies, foundations, corporations and non-governmental organisations (NGOs). The OECD is a stellar case in point with its pioneering work on such issues as impact measurement and blended finance. At Grameen Capital India, we are committed to building a “capital-with-a-conscience” ecosystem, helping to connect enterprises serving the poor with mainstream capital markets. Today a unique debt vehicle has been added, with plans to create a Social Venture Fund and a Social Stock Exchange to democratise funding access for impact enterprises.
Clearly, desperate times call for creative, compassionate and collaborative (and sometimes desperate, out-of-the-box) measures if we are to meet the 2030 Sustainable Development Goals. I can only imagine the universal euphoria that will erupt when each goal is met. I am sure I will be cheering with my loudest “GOOOOAAAAAALLLLLL!”
External actors and financing flows
External flows can be crucial in financing the SDGs. They can help to fill gaps in low domestic savings, fund productive investments and promote development of domestic enabling environments. External financing flows are defined by the type of actor. Financial flows that originate from public sector actors, i.e. bilateral and multilateral providers, are referred to as official flows and are either concessional or non-concessional. The financing provided by private actors, on the other hand, take the form of commercial investments, philanthropic flows and/or remittances.
External financing flows increased through the MDG era but have fallen since 2013
The volume of external finance available to developing countries has been substantial, increasing to USD 1.7 trillion in 20167 from roughly USD 675 billion in 2000. But trends since 2013 are more sobering, with a decline in total external finance of 12% (see Figure 2.5).
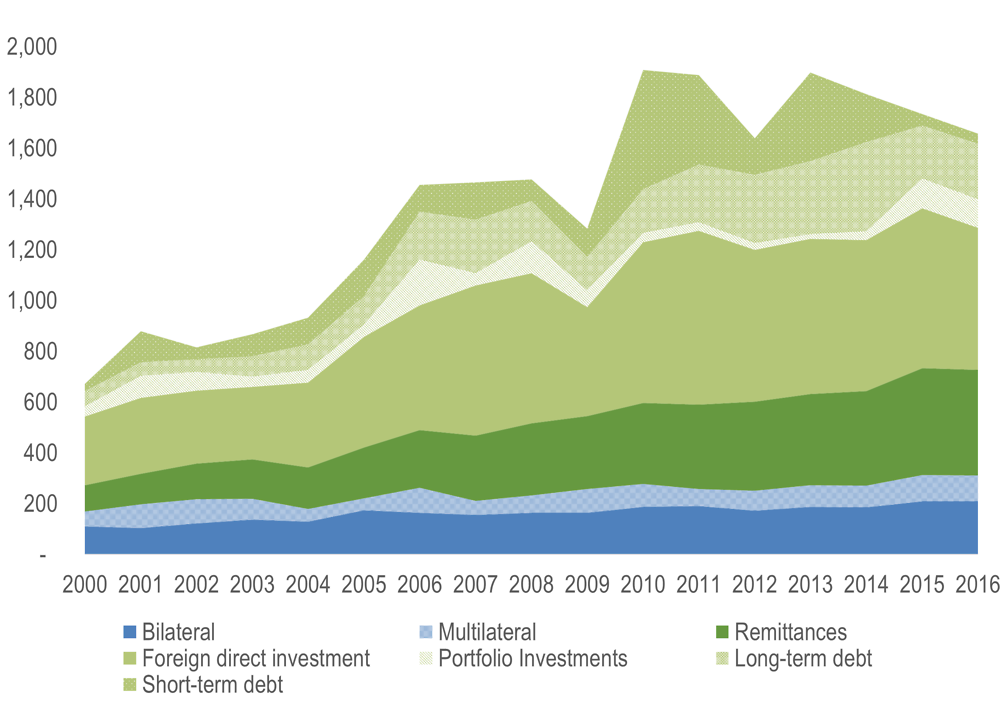
Source: OECD calculations based on OECD (2018[3]), “Creditor Reporting System” (database), https://stats.oecd.org/Index.aspx?DataSetCode=crs1 for official bilateral and multilateral flows; World Bank (2018[4]), “Migration and Remittances Data” http://www.worldbank.org/en/topic/migrationremittancesdiasporaissues/brief/ migration-remittances-data for remittances; IMF (2017[5]), “Balance of Payments” (database), http://www.imf.org/external/datamapper/datasets/BOP for FDI, portfolio investments, and long-term and short-term debt.
Trends over time of external flows vary depending on the type of flow:
-
The rates of increase in private investment flows have declined, a trend that holds across all income groups.
-
Official flows to low-income countries have declined recently in favour of a more rapid increase for middle-income countries.
-
Growth in remittances has remained stable in the low-income country context while remittances are increasing at a slower pace for upper middle-income countries.
Different actors have different roles
The international community calls on all the various actors to play a part in financing for sustainable development, but this goal is complicated by the individual objectives of different actors.
-
Concessional flows as well as philanthropic flows usually aim to further sustainable development.
-
Commercial investments are driven by a profit motive.
-
Remitters are mainly motivated to contribute to the well-being of individual recipients at the household level.
To evaluate the implications of trends in cross-border actors and their resources, it is important to understand their role in the sustainable development financing system. Private sector actors can bring productivity gains and job creation while the public sector can have a comparative advantage in targeting poverty and gender inequality. Moreover, the sectoral destination may vary according to the type of actor. While the private sector tends to invest in economic sectors such as manufacturing, official flows are well placed to target social sectors such as health and education (see Chapter 4). These roles can change at different income levels (see Chapter 6).
The destination of flows also varies by the type of actor. Low-income countries tend to have a higher reliance on official and especially concessional flows while for lower middle-income countries (LMICs), remittances are a major source of external financing. Non-concessional official flows target LMICs and upper middle-income countries (UMICs). The major share of private finance goes to UMICs but it is an important source for LMICs as well (Figure 2.6).

Source: Authors’ calculations based on OECD (2018[3]), “Creditor Reporting System” (database), https://stats.oecd.org/Index.aspx?DataSetCode=crs1 for official bilateral and multilateral flows; World Bank (2018[4]), “Migration and Remittances Data”; IMF (2017[5]), “Balance of Payments” (database) for FDI, portfolio investments, and long-term and short-term debt.
Currently, USD 1.7 trillion in resources are already flowing into developing countries but not every dollar will have the same development impact, as Chapter 4 discusses further. To ensure these are spent in a way that is conducive to sustainable development, the diversity and distinct comparative advantages of actors must be exploited.
Commercial investors
-
Private investment including FDI, portfolio investment and long-term debt to developing economies amounted to around USD 890 billion in 2016.
-
Investment flows are drying up one after another. This process started with cross-border mergers and acquisitions, which started to decline around 2012 and were down by USD 72 billion in 2017 from the high of USD 234 billion reached in 2011.
-
FDI flows, which constitute the largest private investment flow, are following this downward trend. Over the period 2015-16, FDI flows to developing countries fell by USD 70 billion, or 11%, a trend that appears to have continued into 2017.
-
Most recently, project finance in the first half of 2018 was down by 30% year on year.
Commercial investors have become increasingly important and diverse
Over the past 30 years, multinational enterprises (MNEs) have become important actors channelling FDI8 to establish a presence in developing countries. Over the last 20 years in particular, the nature of MNE investment flows to developing countries has evolved beyond a relatively narrow focus on the extractive industries to become one of the cornerstones, along with trade, of global value chains (GVCs) Box 2.4. Many developing countries are now involved in the production of increasingly sophisticated goods and services that feed into the international production networks of MNEs. Global value chains are increasingly used as channels contributing to sustainable development, mostly through financial transfers but also through the transfer of knowledge, standards and skills.
MNEs also engage in portfolio investments, especially within the context of strategic partnerships with other MNEs and domestic firms. Multinational enterprises base their decisions to invest on a broad range of factors including market size, labour force skills, macroeconomic and institutional stability, physical infrastructure, and natural resources.
Other actors involved in portfolio investments include institutional investors such as pension funds, sovereign wealth funds, mutual funds, private equity funds, and hedge funds. Often these investors seek opportunities in developing countries to reduce the risks of their investment portfolios through diversification and higher returns. Since financial assets in developing countries have low correlation with returns in developed economies, they complement the risk-return profile of financial investors in developed countries.
Trade has always been central to economic co-operation and development. The current global system overseeing trade and investment evolved from efforts to create a rules-based system after the Second World War that would regulate investment and business practices, establish labour standards, and promote development. The General Agreement on Tariffs and Trade, or GATT, grew out of these efforts and led to the World Trade Organization (WTO). A series of tariff reductions resulted in significant trade liberalisation and growth in international trade. For several decades, global trade grew substantially faster than global GDP.
Global value chains (GVCs) have had a significant impact on development. These international production and distribution networks have increased developing countries’ growth prospects and integration in global markets. For example, their share of global value-added trade rose to 40% in 2012 from 20% in 1990 (UNCTAD, 2013[25]). GDP-per-capita growth rates in economies showing the fastest‐growing participation in global value chains are about two percentage points above the average. However, the benefits of GVCs are concentrated in specific regions including North America, Europe and East Asia, meaning many developing countries are being left behind (UNCTAD, 2013[25]).
Multinational corporations generate some 80% of trade flows (UNCTAD (2013[25]), which are intrinsically linked with FDI decisions. Trade and FDI can be seen as two facets of a single economic activity: international production sharing (World Economic Forum, 2013[26]). The positive correlation between FDI stocks and global value chain participation is especially present in the poorest countries, indicating that FDI may be an important way for developing countries to access and increase their participation in global value chains (UNCTAD, 2013[25]).
Some GVC activities are declining, raising questions about the future of trade’s impact on development. Since the Second World War, the volume of world trade has on average grown about 1.5 times faster than world GDP, and in the 1990s it grew more than twice as fast. However, in the aftermath of the global financial crisis, the ratio of trade growth to GDP growth has fallen to around 1:1 and GVC activities also decreased (World Bank Group et al., 2017[27]). It is not yet clear whether this may change the nexus between investment, trade and development, or what the impacts will be on financing for development.
Investors in developing countries themselves account for one-quarter of global FDI outflows, up from around 12-13% before the 2008-09 global financial crisis (World Bank, 2013[28]). The rapid rise of China as one of the world’s largest sources of FDI, including through Chinese state-owned enterprises, has been particularly important (Box 2.5).
The growing visibility of this relatively new kind of actor – the state-owned enterprise (SOE) – goes hand in hand with the growing significance of investments from developing countries, as these countries often channel their investment through SOEs. Although not strictly a private sector actor, state-owned enterprises often behave in ways that are similar to their private sector MNE counterparts. This may mask significant government involvement in some cases. Data on FDI do not allow for a distinction between international investments by state-owned enterprises and privately-owned MNEs, but data on cross-border M&A suggest conservatively that the former account for around 10-20% of global FDI flows.
Finally, a multitude of private actors are often involved in project finance, one of the most important forms of investment from a development perspective and a primary method for financing so-called greenfield investments. Project finance usually involves a combination of MNEs and commercial lenders as well as many of the public-sector partners discussed later in this chapter, such as bilateral and multilateral donors, regional development banks, and export credit agencies. Although project finance is smaller in volume terms than are other private flows, it is important from an SDG perspective insofar as it often directly supports specific SDGs. Among these are SDG 7 (the development of renewable sources of energy), and SDG 9 (transport infrastructure).
An increasingly important source of investment in developing countries is China. A major driver of China’s outward investment has been its One Belt, One Road initiative, which has channelled billions of dollars into infrastructure projects in the Eurasian countries and beyond (OECD, forthcoming).
One indicator of China’s growing influence is the increase in merger and acquisition (M&A) investments. Chinese M&A accounted for 20% of all cross-border M&A received by developing countries, making China the top source of investment into developing countries ahead of Japan and the United States. Chinese investment in developing countries grew rapidly beginning around 2010 and has continued to grow even as the Chinese government has been reigning in outward investment more generally. Overall outward M&A from China declined by USD 115 billion, or 53%, between 2016 and 2017, but M&A to developing countries doubled to USD 25 billion (Figure 2.7).9

Source: Authors based on data from Dealogic (2018[29]), https://www.dealogic.com/content/.
This increase in Chinese investment in developing countries would seem to represent a purposeful, policy-driven trend. Most of this investment is being undertaken by fully owned Chinese state-owned enterprises, as it has been since the Chinese investment boom in developing countries started in 2010. Over this eight-year period, fully owned state-owned enterprises undertook 63% of this investment in value terms.10 These data likely understate the extent to which the government participates in China’s outward investment flows, especially in the context of the One Belt, One Road initiative, insofar as they do not include the activities of partially state-owned firms or the role of state-owned banks in financing outward investments by privately owned firms.
Private finance can bring benefits beyond pure financing
Private investors are the single largest providers of cross-border financing to developing countries. This means that encouraging even a relatively small share of this investment to align to the SDGs has significant potential. Even without intending to, private investors and the FDI they generate are particularly relevant for the SDGs for a variety of reasons including but not limited to the following:
-
They transmit new technologies
-
They provide access to new international markets
-
They can fill gaps that domestic investors and other investors or sources of financing cannot reach
-
They can generate decent jobs and tend to pay higher wages and better uphold the principles of responsible business conduct than domestic enterprises
-
They tend to create business linkages in the economy that support domestic enterprises
-
They generate revenues
Private sector actors can play especially important roles in the financing of specific Sustainable Development Goals such as SDG 7 (affordable and clean energy) and SDG 9 (industry, innovation and infrastructure). Where public budgets are under strain, private investors can fill infrastructure financing gaps and bring expertise to improve project efficiency. Chapter 4 explores the specific contributions of commercial investors towards the SDGs in greater detail.
These benefits, however, are not always automatic or even guaranteed. The logic and motivations driving private investors differ from those of public actors and investment returns need to be transformed into development gains. To harness the full sustainable development potential of private investors, it is important to identify mutually beneficial opportunities that satisfy the objectives of private actors and contribute to the achievement of the SDGs at the same time. Moreover, a key challenge is to move away from a narrow focus on quantities and volumes to the quality and development impact of financing, as discussed further in Part II.
An era of foreign investment prosperity for developing countries comes to an end
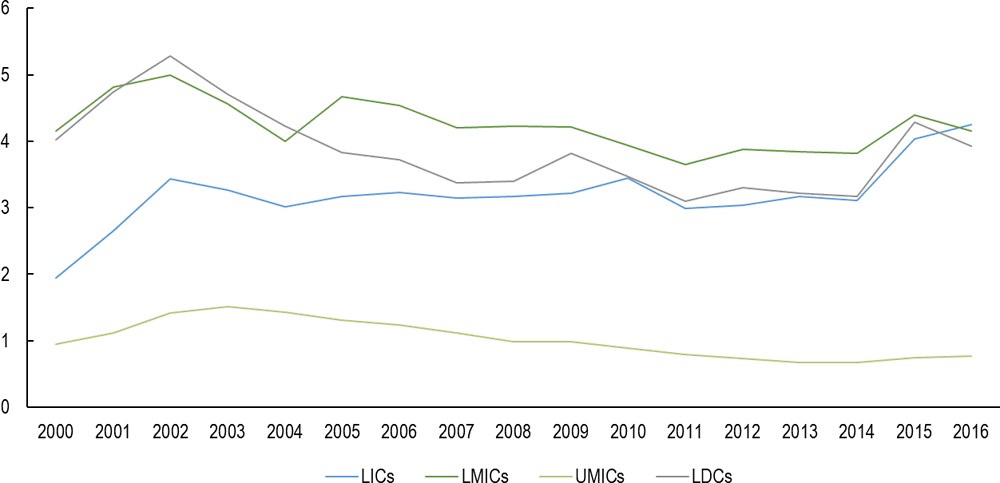
Private investment including FDI, portfolio investment and long-term debt to developing economies amounted to around USD 890 billion in 2016. At their peak in the early 2000s, private investment inflows amounted to more than 8% of GDP for LICs and UMICs.11 In the period 2000-16, private investment as a share of GDP was on average 6.2% for LICs, 5.6% for UMICs and 4% for LMICs. With fluctuations from year to year, the share of private investment over GDP has generally declined compared to the early 2000s and early 2010s (Figure 2.8).

Source: Authors’ calculations based on IMF (2017[5]), “Balance of Payments” (database), http://www.imf.org/external/datamapper/datasets/BOP; IMF (2018[30]), “World Economic Outlook” (database), https://www.imf.org/external/pubs/ft/weo/2018/01/weodata/index.aspx.
FDI, which makes up the largest part of these flows, has shown relatively solid growth and resilience until recently. Developing economies fared relatively better than developed countries during the financial crisis and experienced a one-year decline in FDI of around 30%, with volumes dropping to around USD 430 billion12 in 2009 compared to the 40% drop in global FDI flows. FDI flows recovered strongly in 2010, thanks in large part to a 50% increase in flows to developing economies that year. Over the following five years, flows to developing countries were relatively stable, growing to around USD 630 billion in 2015.
This period of FDI prosperity, as some have called it, came to an end in 2016, when FDI flows reversed course at the global level. Over the period 2015-16, flows to developing countries fell by USD 70 billion, or 11%, in a trend that seemed to continue into 2017. The reasons behind these declines include a mix of broad cyclical and more country-specific factors. Among the former are tighter monetary policy in developed economies and the reversal of the commodity super-cycle (OECD, 2016[31]). More country-specific factors include various sources of geopolitical instability, concerns over rising protectionism and record levels of corporate debt in emerging markets (IMF, 2016[32]). FDI outflows to developed countries followed a similarly broad reversal.
Trends in mergers and acquisitions13 in developing countries show that, in contrast to FDI inflows, M&A inflows were already beginning to decline in 2012 (Figure 2.9). Overall, M&A volumes in developing countries were USD 162 billion in 2017, down by USD 72 billion from the high of USD 234 billion that was reached in 2011. The biggest declines were in upper middle-income developing countries, with annual M&A inflows to China decline by USD 19 billion between 2011 and 2017, to Chile by USD 14 billion, to Turkey by USD 10 billion and to Brazil by USD 9 billion.

Source: Authors’ calculations based on data from Dealogic (2018[29]), https://www.dealogic.com/content/.
The decline in cross-border M&A would not be a negative development on its own had it been offset by a rise in domestic M&A, since this is a trend generally associated with economic development. Over the past decade, developed countries received 29% of their M&A investment from foreign sources; 71% was generated domestically.
In contrast, developing countries received 44% of their M&A investment from foreign sources and generated 56% domestically. The main reason for this difference relates to domestic market weaknesses, imperfections and failures such as a weak domestic financial sector. These can hold back domestic investors but foreign investors are able to overcome them given their significant resources. However, as noted, domestic M&A in developing countries has trended downward more rapidly than cross-border M&A flows, suggesting an overall decline in private sector investment in developing countries.
This downward trend is mirrored in project finance flows. Despite showing resilience to the overall downward investment trends in 2016 and 2017, project finance in 2018 experienced its worst first half in ten years, with volumes down 30% year-on-year (Figure 2.5) and affecting all regions. The number of new transactions declined by 50% to 377 in the first half of 2018 from 725 in the same period of 2017. In addition, around 38% of project finance was for refinancing purposes, up from 24% in the first six months of 2017. In other words, just as the volume of project finance is declining, a shrinking share is going towards new projects.
Policy action is needed to counteract the decline in foreign investment
Business investment in developing countries is currently like a river whose feeder streams are drying up one after another. This process started with cross-border M&A, which started to decline around 2012. This was followed declines in FDI and domestic M&A in 2016, and most recently, in the first half of 2018, in project finance. Portfolio investment is also under pressure in developing countries as interest rates begin to rise in the developed economies and record-high levels of corporate debt have raised the spectre of financial turbulence (OECD, 2018[33]).
Whether this situation worsens depends on many variables. But the current trend is clearly not encouraging. Given data limitations, putting a precise number on the extent to which private business investments in developing countries have shrunk is not possible. However, an orders-of-magnitude calculation based upon cumulative declines in FDI against a counter-factual assumption of zero growth from the previous high in FDI in 2011 suggests that developing countries have foregone between USD 400 and USD 450 billion of FDI from 2012-2016.
Given this scenario, which is leading from billions to millions instead of billions to trillions, an urgent and challenging policy agenda suggests itself. Elements of such an agenda might be expected to address the following challenges:
-
The global rules for trade and investment need to be improved and made to work better in support of an open, rules-based global economy. One of the greatest threats for developing countries would be the widespread outbreak of protectionist trade and investment wars that could accelerate what to date has been a significant but measured retreat of the private sector from developing countries.
-
As private sources of financing that align with and can support achievement of the SDGs retreat, public sources will become relatively more important and will need to play a counter-cyclical role, while recognising that they cannot fill the gap left by the private sector. The author of the essay “Adapt finance and the financial system to “save the world”” calls for the strategic use of public resources to mobilise and attract private capital. This will be difficult in developing countries given that declining business investment has a knock-on negative impact on the ability of governments to maintain adequate levels of tax receipts; this could feed negative spirals as public spending on critical business infrastructure is cut back, further undermining business climates. Co-ordination among donors to maximise the development impact of official development assistance ODA and other forms of public financing becomes critical.
-
Considerable scope remains for pursuing domestic policy reform agendas to improve business climates and to put in place investment promotion and facilitation strategies. Private investment has been declining but continues to play a critical role in helping countries to develop critical infrastructure, generate employment and foster innovation. Governments have an important role to play in helping to better align business interests and the SDGs, thus generating more development impact from less investment. Fostering such closer alignment can also be achieved through the promotion of responsible business conduct.
Private flows constitute the largest single source of foreign financing going to developing countries. Looking forward and beyond the looming development crisis, much more needs to be understood about private flows and the full implications of this financing for achievement of the SDGs. The AAAA created high expectations regarding the contribution of the private sector to sustainable development – expectations that stand in contrast to the current trend line of private flows. This points to an important knowledge gap that will need to be filled to inform an empirical policy-oriented agenda in the future.
Without a doubt, 2015 was a pivotal year. The Addis Ababa conference on financing for development. The unanimous agreement in New York by the United Nations of the Sustainable Development Goals. The climate agreement in Paris. A truly ambitious set of goals and commitments and nearly three years on, substantial progress is being made. However, if we are genuinely serious about these agreements and about these commitments, then it is imperative that we adapt finance and the financial system. Both of these must be revamped to meet the expectations we have created. We need to keep pushing hard to make the necessary progress and get points on the scoreboard before apathy sets in.
Collectively, we need to focus on the key tenet of “billions to trillions” that I and others led back in 2015. We must mobilise and attract private sector capital to finance much needed investment in emerging and developing economies. History has demonstrated that this capital will typically not flow there naturally, at least not in the amounts needed. Mechanisms need to be set up that will create that flow.
Here is where the rest of the system has a vital role to play. Embedding such an approach into the overall finance system will drive the capital. This means that every participant, every stakeholder, has to orientate the way it thinks about capital mobilisation. The multilateral development banks and donor countries are pivotal as they have the resources and the appropriate layers of capital and systems that can be brought together with the private sector capital for that clichéd “win-win”. Regulators are also critical and need to continually evolve to meet the new paradigms and to help fuel innovation within an appropriate framework. This is not an easy task by any means but is much needed if we are to restore the trust that was lost following the financial crisis. The pressure is even greater now to ensure that we are undertaking more than just superficial changes but rather proper, deep transformations – a real change for many of the incumbent participants.
Co-operation is key. The public and private sectors need to work together. This necessitates a fundamental shift in how each views the other and how, on a basic level, each is willing to engage in business with the other. This will be successful only when both make significant moves. Improved co-operation among public sector actors also is needed. Additionally, the private sector must continually reassess and advance to a more long-term perspective in the way it carries out its business. The real beauty of all this change is that, given the different incentive mechanisms, the new co-operation can be truly symbiotic. Money will follow cultural changes. Shift in culture will mean shift of money!
Fundamental change is needed. Stamina and patience are required. If we can come together and adapt, if we are willing to pay this “price”, then we stand a chance of achieving the rightly ambitious goals. The rub? If we are serious, if we are not inconsequential – which like most I hope we are – we do not have a choice.
Migrant remitters
-
Beginning in the early 2000s, global remittance flows increased sharply, aided by technological advances in financial infrastructure that significantly reduced the costs of transmitting funds.
-
The amount of global remittances rose to USD 466 billion in 2017 from USD 122 billion in 2000, making remittances the second largest type of cross-border financing to developing countries.
-
The average cost of sending remittances has remained flat at 7.1% – far higher than the SDG target (indicator 10.c) of less than 3%.
Migrants from developing countries act as providers of financing for sustainable development
Recent years have seen an increase in international migration. In 2015, 3.3% of the world’s population or 244 million people were international migrants. This is a significant increase from the estimated 155 million people who were international migrants in 2000 and who then represented 2.8% of the world’s population. Many of the migrants come from developing countries and send home remittances to support their families.
Decisions to send remittances are essentially private and personal in nature. Remitters may be motivated by altruism, but they are not necessarily taking into explicit consideration the achievement of the SDGs in their home countries. As outlined in Box 2.7 migrants are influenced by a range of factors that can include a desire to support family members and the intention to prepare for a return to their home country (OECD, 2006[34]). The willingness to remit also depends on the duration of migration (the length of time a migrant intends to stay abroad and whether the stay is temporary or permanent); family situation (whether the migrant is single or married and has children); and network effects (whether the migrant moved alone or with family members and the degree of attachments to those left behind) (OECD, 2006[34]).
A number of theories to explain the motives for sending remittances have been put forward, ranging from pure altruism (e.g. the migrant’s concern for relatives left in the home country) to pure self-interest (e.g. aspiration to inherit or desire to invest in financial assets or real estate in the home country). One theory between those two extremes rests on an insurance model that views migration and remittance as a household risk strategy that builds on informal agreements with family members remaining in the home country. In this scenario, the migrant’s family finances the initial costs of the migration project that the migrant alone often cannot cover. In turn and once the migrant secures employment, high enough earnings and positive expectations about further income, he or she sends remittances to the family to finance investments such as education of the younger generation and/or to support the family during emergencies and times of need (OECD, 2006[34]).
Remittances are also sent collectively through migrant and diaspora associations such as hometown associations or diaspora direct investments, often with an explicit development orientation. Diaspora groups form hometown associations in the country of destination to collectively support the country of origin through investments in development projects. Mexican migrants in the United States, for example, form such associations to channel funds back to Mexico’s poorest rural areas with high levels of out-migration. Another form of such financing is investment by diaspora-owned firms or firms with diaspora members in top management in productive activities (Rodriguez-Montemayor, 2012[35]).
Remittance volumes have surged to become the second largest source of external financing
The volume of remittance flows has continued to steadily climb in tandem with the movement of people. Experience has shown that remittances, constituting a steady stream of foreign exchange, can help to alleviate poverty and stimulate economic growth in migrants’ countries of origin (Singer, 2010[36]). A case in point is Korea. Remittances from Korean workers in West Germany and the Middle East and from Korean soldiers deployed to Viet Nam provided foreign exchange that contributed to jumpstarting the rapid economic development in the 1960s.
Beginning in the early 2000s, global remittance flows increased sharply, helped by technological advances in financial infrastructure that significantly reduced the costs of transmitting funds.14 The amount of global remittances rose to USD 466 billion in 2017 from USD 122 billion in 2000, making remittances the second largest type of cross-border financing to developing countries. Regional growth trends and projections suggest remittances will increase in developing countries overall, following a decline in 2015 and 2016 that is attributed to weak economic growth in the sending countries of the Gulf Cooperation Council and the Russian Federation (“Russia”) and to exchange rate movements.
Remittances make up a sizable portion, around 4%, of GDP in both lower middle-income countries and low-income countries (Figure 2.10). For lower middle-income countries, it has remained fairly constant from the early 2000s through 2016. But the share of remittances in GDP increased sharply for low-income countries, doubling during this period. Among the top receiving countries in terms of remittances as a share of GDP are small economies such as Kyrgyzstan, Tonga and Tajikistan, which each receive more than or close to 30% of GDP in remittances. In nine out of ten top receiving countries, remittances correspond to 20% of GDP or more.
Source: Author’s calculations based on World Bank (2018[4]), “Migration and Remittances” (database), http://www.worldbank.org/en/topic/migrationremittancesdiasporaissues/brief/migration-remittances-data for remittances. IMF (2018[30]), “World Economic Outlook” (database), April 2018 Edition, http://www.imf.org/external/pubs/ft/weo/2018/01/weodata/index.aspx, for GDP data.
Transaction costs involved in sending remittances to developing countries, however, far exceed the SDG target (indicator 10.c) of less than 3%. The average cost of sending remittances has remained flat at 7.1% (Figure 2.11Moving towards financing for development), with the lowest average transaction costs in South Asia (5.2%) and highest in sub-Saharan Africa (9.4%). Remittance costs across many African corridors and small islands in the Pacific remain above 10% because of the low volumes of formal flows, inadequate penetration of new technologies and lack of a competitive market environment (Ratha et al., 2018[37]). Potential remedies in terms of domestic policy are discussed in the essay “How to mobilise remittances for development financing”.

Source: World Bank (2018[38]), “Remittance Prices Worldwide” (database), https://remittanceprices. worldbank.org/en.
Remittances can be mobilised for development financing
For a long time, remittances were ignored as small change. But these small sums of money sent by migrants to family back home in developing countries actually add up to more than three times the total of official development assistance (ODA). In 2017, remittances reached USD 466 billion. In contrast to the outlook for ODA – flat at best for the medium term – remittances are expected to rise at an annual rate of over 4%. The true size of remittances, including flows through informal channels, is significantly larger.
Yet remittances are private money and they should not be used (through taxes) for public spending. There is also a concern that most of the remittances received by poor families are used for essential consumption such as for food, clothing and housing, although we know now that they are also used for financing education and business investments. Remittance flows are more stable than private investment flows. These flows are also better targeted to the needs of recipient households, given they are timelier, and better monitored than official aid.
Can these private flows be used for more productive investments and for funding public goods? The answer is yes. Removing regulatory barriers can reduce remittance costs and translate into additional USD 20 billion in flows per year to poorer households in developing countries. Remittances can be used to improve sovereign credit ratings and bond ratings, thereby reducing the costs of financing programmes. And remittance channels can be used to mobilise USD 50 billion or more of diaspora savings through the issuance of diaspora bonds.
Lower regulatory barriers
Today, when the costs of cross-border communication have become negligible, it costs more than 9% on average to send money to a family in sub-Saharan Africa. Except in a few large country corridors, remittance costs on average top 5% in all regions, which is significantly higher than the SDG target of 3% (SDG indicator 10.c). If remittance costs are reduced by 3 percentage points, say, they could save more than USD 20 billion in the hands of migrants and their families. Remittance channels are used not only by migrants to send money to families but also for small payments for trade, investment and philanthropy.
Remittance costs can be reduced rapidly by allowing new remittance service providers into a market dominated by few large players. One self-evident option is to end exclusivity partnerships between the national post offices (especially in the OECD countries) and large money transfer operators. Another would be to recognise that small remittances are overwhelmingly used for personal uses and carry very low risks of money laundering and financing of terrorism. This would open up the market to new players using more efficient and cheaper technologies such as mobile phone or blockchain technologies.
Remittances are the most stable form of cross-border flows and can have a positive development impact
Migrants’ remittances present the most stable form of cross-border flows to developing countries. While private capital flows tend to rise during favourable economic cycles and fall in bad times, remittances appear to react less violently and may even rise during recessions in recipient countries. For example, remittances to developing countries continued to rise steadily in 1998-2001 when private capital flows declined in the wake of the Asian financial crisis (Ratha, 2005[39]). While remittances are relatively stable at aggregate levels, inflows to individual developing countries may be quite volatile, impacting on economic stability (Jackman, 2013[40]).
These benefits of remittances enhance the creditworthiness of developing countries. The World Bank-IMF Debt Sustainability Framework allows recipient countries to carry higher levels of debt when the ratio of remittances is higher than 10% of their domestic income and 20% of exported goods and services (IMF, 2017[41]).
At the micro level, too, remittances can have a positive impact on development and poverty. They are shown to increase the income of recipient households and remove financial constraints, reinforcing a household’s ability to resist external shocks. In some countries, “households that receive remittances are more likely to engage in productive activities such as owning businesses, real estate or agricultural assets” and tend to spend more on education (OECD, 2017[42]). However, the link between remittances and higher investments is not always straightforward. In some cases, remittance income is spent on the daily consumption of basic goods rather than in investments in human and physical capital (Adams and Cuecuecha, 2010[43]).
Policies in remittance sending and recipient countries can enhance development impact
How can remittances be best harnessed to benefit sustainable development? Although an important source of cross-border financing, remittances must be considered separately from other forms of financing for development due to their essentially personal nature. Not all remittances contribute to sustainable development and measuring the portion of remittances targeting sustainable development is challenging (Chapter 4).
To strengthen the development impact of remittances and make sure that remittances can be used in the most beneficial way for the migrants and their families, policy should focus on creating an enabling environment that supports the use of remittances for long-term investments (OECD, 2017[42]). For example, policies that foster financial inclusion of migrants and remittance recipients and that promote financial literacy can help to channel remittances towards investment in human capital and productive activities.
Domestic policies in remittance-sending countries that help to ensure the effective transfer of remittances at the level of non-state intermediaries also can enhance the development impact of remitters and diaspora communities (Chapter 5). Both the Addis Ababa Action Agenda and the 2030 Agenda point to high transaction costs as a potentially productive area for policy intervention.
Philanthropic foundations
-
Philanthropic giving is dominated by a handful of large players based in the United States and Europe. Just 20 foundations provided 81% of total philanthropic giving to developing countries during 2013-15. Nearly three-quarters of the amount originated from foundations based in the United States.
-
Philanthropic giving to developing countries amounted to USD 23.9 billion in the 2013-15 period, or USD 7.96 billion per year on average.
-
Middle-income countries received 67% of the flows. 37% went to lower middle-income countries and 30% to upper middle-income countries. Only a third of the flows went to least developed countries and other low-income countries.
Foundations continue the long-standing human tradition of philanthropic giving
Philanthropy has been a part of human civilisation for thousands of years. In ancient China, clan-based lineage organisations provided allowances to widows and orphans, distributed grain to the poor and built schools for children (UNDP, 2016[44]) Philanthropy is also deeply ingrained in the Judeo-Christian tradition, evidenced by the ancient Hebrews’ gifting of one-tenth of their income to those in need, and it is also a pillar of Islam, which requires zakat giving (Andrews, 1950[45]).
In the 20th century, some of the wealthiest industrialists in the United States, such as John D. Rockefeller and Andrew Carnegie, organised their philanthropic giving at an unprecedented scale with the aim of systematically addressing the social needs of the day. These philanthropists said they considered it the duty of the rich to use their skills and fortune to benefit the wider community and poor.
A surge in entrepreneurial wealth over the last 30 years has brought with it a new class of philanthropists. By bringing a business approach to philanthropy and focusing on strategy, innovation and partnerships, these actors play a unique and pioneering role in the financing for sustainable development system.
In terms of volumes, a handful of large players based in the United States and Europe dominate philanthropic giving to developing countries. A survey conducted in connection with the recent OECD (2018[46]) report, Private Philanthropy for Development, finds that just 20 foundations provided 81% of total philanthropic giving to developing countries during 2013-15 and nearly three-quarters of all such philanthropy originated from foundations based in the United States. The Annex to this chapter provides further details. The Bill & Melinda Gates Foundation, headquartered in the United States, alone accounts for nearly half (49%) of total giving, which largely explains the finding about geographic concentration. Of the 143 foundations included in the OECD data survey sample, other top originating countries were the United Kingdom (7% of total philanthropic giving), Netherlands (5%), Switzerland (2%), Canada (2%) and the United Arab Emirates (2%).
Philanthropic giving nevertheless is relatively small in volume
Philanthropic giving to developing countries amounted to USD 23.9 billion in the 2013-15 period, or USD 7.96 billion per year on average (OECD, 2018[46]). While philanthropic giving remains relatively modest compared to financing for development more broadly, foundations have become major partners in some specific areas. For example, in the health and reproductive health sectors in 2013-15, support from philanthropic foundations constituted the third-largest source of financing for developing countries, after support from the United States and from the Global Fund to Fight AIDS, Tuberculosis and Malaria.
Almost three-quarters (74%) of foundations’ giving in 2013-15 supported activities in social infrastructure and services such as health, education, human rights and social protection (Figure 2.12). Overall, health was the main sector targeted by philanthropic giving – far ahead of other sectors – with USD 12.6 billion or 53% of the total. The Gates Foundation was the major player in this arena, accounting for 72% of total giving to health. The donations of other foundations accounted for only the remaining 28% of the sector total, although the OECD survey shows that health and reproductive health was also their main funding priority.

Source: OECD (2018[46]), Private Philanthropy for Development, https://doi.org/10.1787/9789264085190-en.
Philanthropy also mainly targeted middle-income countries, who in total received 67% of the flows. 37% went to lower middle-income countries and 30% to upper middle-income countries. Only a third of country allocable funding went to least developed countries and other low-income countries (OECD, 2018[46]).
Some philanthropic foundations play key roles innovating and collaborating with other actors
Philanthropic foundations are increasingly influential actors in international development. The largest players in particular, and notably the Gates Foundation, are actively shaping the agenda setting and funding priorities of international organisations and governments by virtue of the size of their grant making, networking and active advocacy.
In some cases, philanthropic foundations can play a special role in financing for sustainable development because they are relatively less risk averse and relatively more are willing to invest in innovative business concepts and financing models (Marten and Witte, 2008[47]). Box 2.9 “Unlocking financial innovation to accelerate pro-poor innovation” reviews the range of possible collaborative opportunities with philanthropic foundations who can provide the seed capital for innovative solutions to development problems. Yet the vast majority of philanthropic foundations are traditional in the instruments and channels of delivery they use (OECD, 2018[46]).
Combined with commitment from the global community, technology and innovation can be powerful forces for improving global health and reducing poverty. Think of the potential of new crop varieties to help alleviate extreme poverty by increasing crop yields, resilience and nutritional value. Or the potential benefits of developing and widely deploying digital identification systems that can improve access to government services and give impoverished people a chance to join the formal economy and improve their lives.
But for these visions to become reality, change is needed in how the development community does business. First, governments and donors need to work more closely with those who have special expertise in helping countries adopt innovative technologies. The private sector and philanthropic organisations can and must help in this regard. Second, scaling innovation will require more flexible financing policies and a greater appetite for risk on the part of the largest providers of development finance and most notably multilateral development banks, other development finance institutions, and large institutional and private investors.
One way this can happen is through a segmentation of development finance. Philanthropic capital, which can absorb higher risks than many other types of development finance, should be used to pilot innovation. International financing institutions can then take successful pilots to scale more often than they do now. Philanthropic providers also need to become better aligned to ensure that promising ideas are supported from the conceptual stage through scaled broad deployment.
By focusing on appropriate risk sharing and mitigation, international financial institutions and the donor community can also better unlock private sector investment to do what it does best: finance commercially viable investments and bring to the table the sector’s know-how and openness to innovation. Scarce public and concessional resources can then be freed up to focus on where they are most needed.
Donors also need to engage in clear-eyed cost-benefit analyses to determine a risk-adjusted economic (not just financial) rate of return and to guide allocation toward purposes that truly help those in greatest need. The Bill & Melinda Gates Foundation has sometimes learned this lesson the hard way. One example is an investment we made to encourage commercial banks to lend to smallholder farmers. The risk sharing facility we created ultimately did not catalyse greater access to finance for smallholders. And once the facility was withdrawn, the costs to commercial banks to maintain lending were prohibitive and funding dropped.
Greater success is likely through co-operation between international finance institutions and donors. The Climate Investment Funds are a good example. A multibillion-dollar partnership of donors and development banks, the funds offer concessional financing to middle income countries for adoption of renewable energy technologies. This model could be used for scaling other promising innovations.
Another good recent example of such co-operation is the Gates Foundation and the Inter-American Development Bank working together to end malaria in Central America. The foundation’s grant money is blended with bank resources in a way that provides strong incentives for countries to implement effective programmes against malaria.
Partnerships are key. At the Gates Foundation, we are ready to partner with governments and the international finance community for the benefit of the poorest and most vulnerable people in the world. Together, we can accelerate pro-poor innovation for developing countries.
Philanthropy can further be used to bridge silos in the financing for sustainable development system, as foundations generally value partnerships and strategically engage in coalitions with government, donors, social entrepreneurs and civil society organisations. Many of the foundations assessed in the “OECD Survey on Private Philanthropy for Development” systematically engage with governments (67%) and with donors (45% when designing or implementing their programmes and projects (OECD, 2018[46]).
Better data and more co-ordination can help even more to harness their potential
-
Better and more data are needed to understand and guide the contributions of philanthropic giving to the global goals. Philanthropic foundations are concentrated in a few countries of origin and exhibit similarly significant heterogeneity in terms of the size and scope of their operations. As Chapter 4 discusses in detail, measurement of the global effect of philanthropy is fragmented. The limited availability and transparency of comparable data and measurement standards are additional challenges to mapping their contributions and impact. Recent efforts by the OECD, among them the Survey on Private Philanthropy for Development and the launch of the OECD Centre on Philanthropy in 2018, provide opportunities for improvement in reporting on philanthropic giving.
-
There is a need for closer co-ordination with other actors in the financing for sustainable development system. Given their innovative capacities and their focus on partnerships, philanthropic foundations can make a valuable and unique contribution to sustainable development. To make better use of this potential, more institutionalised platforms of co-ordination and knowledge sharing are needed to bring together philanthropic foundations, bilateral and multilateral providers of development financing, and developing country governments. Dedicated philanthropic dialogue platforms at the sectoral, regional and local levels along with international reporting and data collection initiatives (such as the DAC statistics on development finance and the OECD Centre on Philanthropy) can enhance transparency and alignment among actors, ensuring that the flows are mutually reinforcing and complementary rather than duplicative (OECD, 2018[46]).
Bilateral official providers
-
Official flows from bilateral providers amounted to USD 210 billion in 2016 and OECD DAC members provided a total of USD 167 billion the same year.
-
South-South co-operation flows from ten major countries beyond the DAC are estimated to be USD 6.9 billion in 2015, up from USD 5.2 billion in 2011.
-
From 2010-2016, per capita flows going to least developed countries and other low-income countries have declined from USD 38 to USD 32 and from USD 47 to USD 37, respectively, while flows to lower middle-income countries have increased from USD 15 to USD 20.
Bilateral providers can address pressing development needs
Bilateral providers of financing for sustainable development are governments and national development agencies that provide financing, either concessional or non-concessional, to support the economic, environmental, social and political development of developing countries.15
It is sometimes argued that geopolitical self-interest is the ultimate motivator of official development finance, e.g. the possibility to pursue concrete foreign policy interests (Alesina and Dollar, 2000[48]); (Younas, 2008[49]). Development co-operation by official providers became an institutionalised activity after the end of the Second World War and in the wake of the emerging Cold War competition. Bilateral providers deployed aid as an extension of foreign policy with the primary objective of projecting project soft power and also helping to build a vibrant post-war international economy. However, the official objectives of development co-operation, which often are clearly stated in the mission statements and mandates of the implementing agencies, are to promote the development of the recipient country. For instance, a key objective of the European Union’s policy on foreign aid is the reduction and eventual elimination of poverty, as mandated by the Lisbon Treaty of 2009.
This formal mandate of bilateral providers – to promote development – requires them to explicitly target the most pressing development needs. Thus, given the role they play, they cannot easily be replaced by alternative providers. As a guardian of development finance, the OECD Development Assistance Committee (DAC) supports members’ efforts to comply with this mandate.
Since its establishment in 1960 as part of the OECD, the DAC has institutionalised norms of donor behaviour. The DAC coined new terminology in 1961 by distinguishing concessional flows or official development assistance (ODA) from non-concessional or other official flows (OOF) as a special measure of development assistance, applying softer terms to address the urgent needs of those less developed countries with the most severe economic and debt servicing problems. Building on this definition, DAC members agreed to raise concessional finance in the form of ODA to the level of 0.7% of each donor’s national income (GNI).16
Another norm for bilateral donors is to explicitly target the most vulnerable countries and sectors with high development impact. In December 2014, DAC members agreed to allocate more ODA to the group of countries and territories that are classed as most in need: least developed countries, low-income countries, small island developing states (SIDS), landlocked developing countries, and fragile and conflict-affected contexts.
Beyond the group of DAC members, there are many bilateral actors who are providing development co-operation, which is also referred to as South-South co-operation. Its steady rise is mirrored in the substantial increase in the number of bilateral providers reporting their development finance to the DAC, which grew to nearly 50 in 2016 from fewer than 20 in 1960.
Moreover, there are many other development co-operation providers who do not report their financing to the DAC. While many of these countries have longstanding development co-operation programmes, their weight in the financing for sustainable development system has increased significantly and reflects their growing importance as drivers of global trade, investment and growth. The lack of transparent data on their activities makes it challenging to understand the full sustainable development finance system and to co-ordinate efforts across different groups of actors (Chapter 4).
As noted in this chapter, many South-South providers extend official financing through state-owned enterprises such as sovereign wealth funds, which often act like private investors. China’s development co-operation, in particular, often mixes concessional with non-concessional resources, which blurs the distinction between public and private actors.
A large portion of bilateral official flows comes from OECD countries and is concessional
Official flows from bilateral providers amounted to USD 210 billion in 2016, of which 74% (USD 155 billion) were concessional flows. In 2016, OECD DAC members provided a total of USD 167 billion, of which concessional flows constituted the majority (71%). South-South co-operation flows from ten major countries beyond the DAC are estimated to be USD 6.9 billion in 2015, up from USD 5.2 billion in 2011. The overall share of these providers in total cross-border financing in developing countries remains small compared to that of DAC members. Nonetheless, some bilateral providers, among them Saudi Arabia and the United Arab Emirates, ranked among the top ten bilateral concessional finance providers in 2015. Moreover, China’s development assistance efforts, articulated in the form of megaprojects around the One Belt, One Road initiative are quite substantial in both size and impact, and amounted to USD 3.1 billion in 2015, according to OECD estimates.17
However, data constraints mean it is difficult to accurately estimate and fully acknowledge the contribution of South-South co-operation. In the above-mentioned case of China, estimates of the amounts of concessional finance provided in a single year range from USD 3 billion to USD 7 billion. In some cases, a large portion of official finance is channelled through state-owned enterprises and resembles private investments. For example, China’s development finance extends beyond the traditional concepts of aid to include “export buyers’ credits, official loans at market rates and strategic lines of credit provided to Chinese enterprises” (Lakatos et al., 2016[50]). This can make it even more difficult to fully grasp the full picture of South-South co-operation.
Bilateral flows can target development needs
Bilateral providers are well positioned to target economic and social vulnerabilities, as confirmed by the sectoral allocation of their financing. Due to limited availability of data on the sectoral allocation of flows, the analysis is based exclusively on bilateral providers reporting to the DAC. Compared to multilateral providers, these providers allocate a greater share of flows to social sectors such as government and civil society (11.4%) and education (7.7%). The respective values for multilateral providers are 5.4% (government and civil society) and 3.2% (education). Moreover, a sizable proportion of financing (13.4%) is allocated to humanitarian aid. All of these flows are concessional in nature, as bilateral concessional finance almost exclusively targets economic sectors.
Moreover, bilateral providers have demonstrated a commitment to countries most in need. Since 2000, concessional finance by bilateral actors to countries most in need – including least developed countries, low-income countries, and fragile and conflict-affected countries and territories – increased more rapidly than did financing for other country groupings (Figure 2.13).

Note: The peaks in 2005 and 2006 for UMICs and fragile and conflict-affected states and contexts are due to high levels of debt relief.
Source: OECD (2018[3]), “Creditor Reporting System” (database), https://stats.oecd.org/ index.aspx?DataSetCode=CRS1.
However, more recently, these trends do not seem to continue to the same extent. Figure 2.14 shows that although per capita flows to fragile and conflict-affected contexts have increased from 2010-2016, flows going to least developed countries and other low-income countries in per-capita terms have declined to USD 32 from USD 38 and to USD 37 from USD 47, respectively. This suggests that increases in financing have not been able to keep up with population growth in these countries and contexts. At the same time, concessional and non-concessional flows per capita to lower middle-income countries have increased to USD 20 from USD 15.
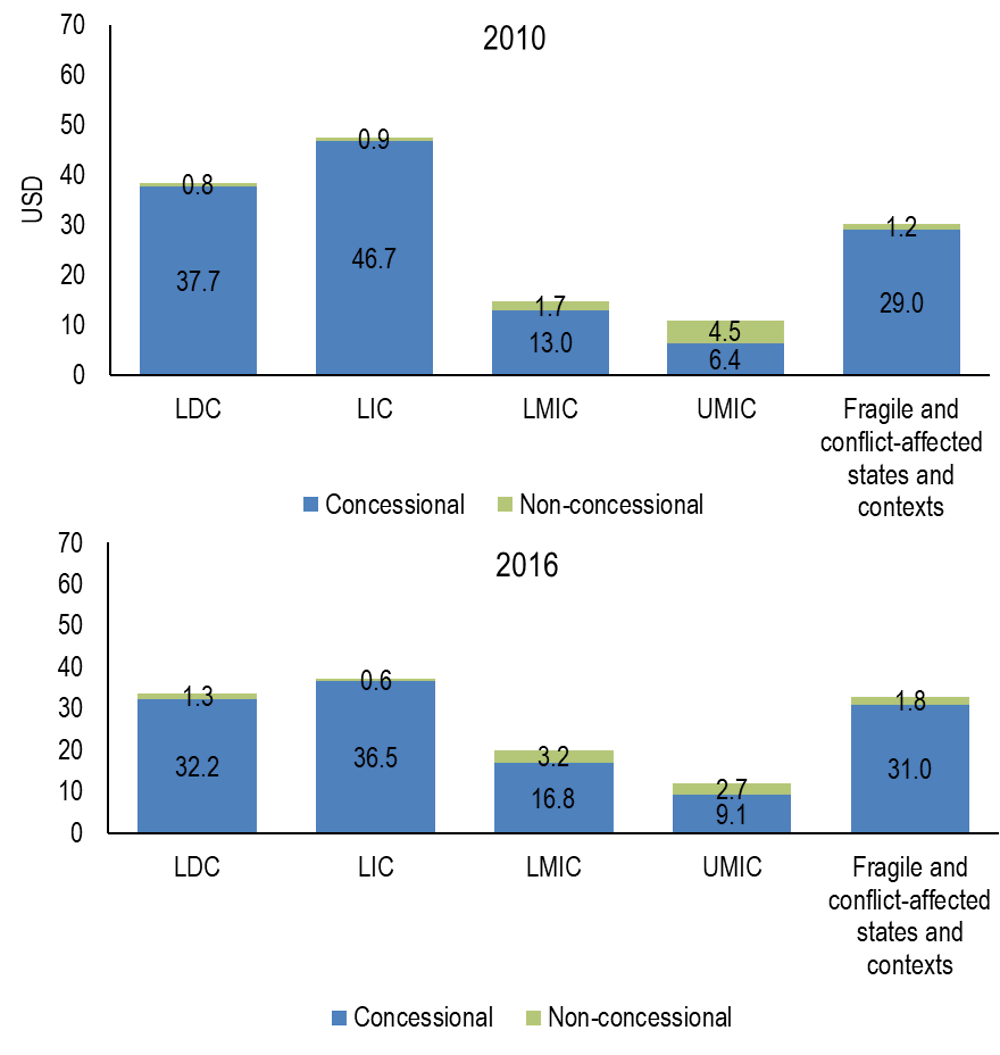
Note: The figure includes concessional and non-concessional financing provided by OECD DAC members.
Source: OECD (2018[3]), “Creditor Reporting System” (database), https://stats.oecd.org/ index.aspx?DataSetCode=CRS1.
Although it is difficult to make quantitative statements about the destinations and qualities of South-South co-operation, the added value of non-DAC providers often lies in their innovative approaches. South-South co-operation offers opportunities for technology transfers and knowledge sharing at low overheads and draws on the providers’ own development experiences. One example was an arrangement to transfer agricultural techniques between and among SIDS. Cuban experts “introduced the drip irrigation technique for adoption by local farmers in other SIDS countries, which proved to be cost-effective and suitable to conditions in small islands where irrigation water is particularly rare” (UNDP, 2016[51]). Enhancing dialogue with such actors is crucial so that their voices, views and lessons from their development experience are integrated in DAC and DAC members’ policies and practices.
Bilateral actors can achieve more through co-ordination among themselves and collaboration with others
-
The universe of bilateral financing for sustainable development providers is becoming increasingly diverse, and non-DAC providers sometimes set alternative benchmarks for development assistance (Esteves and Assunção, 2014[52]). This leads to more choice for developing countries. But the diversity of providers also raises concerns that lack of co-ordination may lead to fragmentation. While the allocations of official resources are sovereign decisions motivated by poverty alleviation, historical ties, economic interests and/or other factors, the lack of co-ordination in allocation practices can result in gaps if providers choose to focus on the same set of countries or sectors (OECD, 2013[53]).
-
Bilateral financing for development providers is well placed to target social needs and vulnerable countries, having clearly demonstrated a commitment to do so. Recent trends, however, suggest that financing to low-income countries and least developed countries, for example, has increased at a slower pace than to financing to other developing countries and lags behind population growth. The relatively high reliance of these countries on cross-border financing suggests that a decrease in the per capita level of official flows into these countries can affect them more severely than other countries.
-
Official flows can be used to support the mobilisation of other financing for development resources such as domestic revenues and private sector financing. Development co-operation has the potential to mobilise tax revenues for developing countries and provide needed support to public financial management systems. Given the recent retreat of private investment flows, which has been described earlier in this chapter, official flows can also play a role in mobilising private resources. The targeted support for enabling environments can ensure that both domestic and international resources are channelled to areas with the greatest need and impact and utilised in a way that is conducive to sustainable development. Yet the need to mobilise private sector resources could clash with the commitment to countries most in need, as they are often less attractive to private investors. A careful balance must be struck, as is argued in Box 2.10 “Increasing the pie”, but in the context of clear criteria to guide the allocation of funds to conflicting priorities.
Since the adoption of the SDGs and the Addis Ababa Action Agenda, we have seen new challenges arise. The demand for financing humanitarian assistance and programmes for handling refugees and migration has grown and together with domestic agendas this increases pressure on public resources available for international development finance. In this situation, public sector actors, particularly the 30 OECD DAC members should focus their resources such as official development assistance (ODA) to make sure it delivers maximum impact where it is needed the most.
When planning distribution of ODA, countries should continue to have a focus on supporting those who risk being left behind. Projections from World Bank and UN data tell us that as many as 85% of the world’s poor will be concentrated in one group of countries by 2030. Many of these countries happen also to be in conflict or post-conflict situations. This calls for increased investments in prevention of violent conflicts.
The pressure on limited public resources could make countries “stick to the core” and shy away from using ODA to catalyse other financial resources. That would be the wrong thing to do. It is even more important now than it was a few years ago to use public sector finance to leverage private finance for development purposes. We are seeing more and more good examples where the blending of public and private finances is increasing the total resources.
It’s a delicate balance: upholding development assistance funding for countries that need it, while simultaneously being innovative and catalytic to “increase the pie” by leveraging other sources of finance, and also making sure there are incentives for partner countries with growing economies to increase their domestic resource mobilisation.
More and more countries and a broader group of stakeholders are increasingly involved in financing for sustainable development. One example is the growth of development co-operation of emerging economies, with China in a leading role and also with many Arab countries showing commitment to international development. Another example is the growing importance of private foundations that play an important role in financing health outcomes in developing countries. A third example is the institutional investors who are increasingly shaping their investment strategies and dialogues with portfolio companies based on the SDG framework.
To maximise the impact of this diverse community, strike the right balance and address the financing gaps, we need a strong global partnership where countries and other actors can co-ordinate. The OECD countries and other emerging donors are dependent on good data, sharp analysis and frank policy recommendations going forward. By increasing the knowledge of what works and focusing on analysis of the development impact of existing and new development financing models, we will build evidence that decision makers can use to make the right choices. The OECD is well positioned to deliver this today and in the future.
Multilateral providers
-
In 2016, multilateral concessional and non-concessional financing reporting to the DAC amounted to USD 33 billion and USD 68 billion respectively.
-
37.2% of all multilateral flows were concentrated in infrastructure.
-
Per capita financing from multilateral institutions for fragile and conflict-affected states and contexts increased from USD 14 in 2010 to USD 17 in 2016.
Multilateral actors are a central pillar of the financing for sustainable development system
Multilateral actors are international agencies, organisations and funds that provide financing for sustainable development. The members of these institutions are governments who are represented at the highest decision-making level by persons acting in an official and not individual capacity. Multilateral institutions are a central pillar of the international development finance framework that was founded on the two Bretton Woods institutions, the World Bank and the IMF. The establishment of the International Development Association (IDA) in 1960 was another milestone in the evolution of this framework, reflecting a general sense that a multilateral approach was needed to overcome co-ordination problems that were arising from the large number of individual development co-operation programmes. The 1960s also saw the establishment of an additional tier of multilateral development banks whose governance arrangements more reflected the rise of regional powers. Since the 1990s, vertical funds18 and trust funds19 have come on the scene and grown in number and importance. Confined to specific purposes such as regions, countries and thematic focuses, these have contributed to the specialisation and also proliferation of multilateral channels in the financing for sustainable development system (Figure 2.15).

Source: Authors based on Faure, Prizzon and Rogerson (2015[54]), Multilateral development banks: A short guide, https://www.odi.org/sites/odi.org.uk/files/resource-documents/10650.pdf.
Multilateral actors, as discussed throughout this chapter, can be categorised as multilateral development banks (MDBs) such as the World Bank Group and regional development banks; the United Nations system;20 the IMF; and other organisations such as vertical funds. Their functions and relationships are outlined in Box 2.11Multilateral providers. These multilateral institutions are simultaneously providers of financing for development in their own right and serve as intermediate channels or agents assisting their member states to implement sustainable development policies.
Multilateral development banks (MDBs) provide financial and technical assistance for development in low-income and middle-income countries. In addition to the World Bank Group, they include regional development banks: the African Development Bank (AfDB), the Arab Bank for Economic Development in Africa (BADEA), the Asian Development Bank (ADB), the European Bank for Reconstruction and Development (EBRD), the Islamic Development Bank (IDB), and the Inter-American Development Bank (IADB).
MDBs have two main funding channels, the first providing financing at non-concessional terms and the second providing concessional financing. (The exception is the EBRD, which extends only non-concessional financing.) Non-concessional financing is extended to governments of middle-income countries, some creditworthy governments of low-income countries, and in some cases to private companies. Soft windows provide grants and highly concessional loans to the poorest countries. Most loans are (nearly) interest-free and have a maturity of 25 to 40 years.
In the case of the World Bank Group, the International Bank for Reconstruction and Development (IBRD) and the International Development Association (IDA) function as the non-concessional (hard) and concessional (soft) lending windows, respectively. MDBs can also have commercial arms that invest exclusively in private sector projects in developing countries through loans, equity products and trade finance. The International Finance Corporation (IFC) fills this role for the World Bank Group.
MDBs are being called on to increase their catalytic role in finance to mobilise more financing for sustainable development, especially from the private sector. Discussions also are underway at the G20 to ramp up MDB capital to address challenges to the international financial system and better provide global public goods.
The UN development system consists of 34 UN system entities (funds, programmes and agencies) that received funding for operational activities for development. These include affiliate organisations such as the UN Development Programme (UNDP), the UN Children’s Fund (UNICEF) and the World Food Programme (WFP) as well as specialised agencies such as the Food and Agriculture Organization (FAO) and the World Health Organisation (WHO). The International Fund for Agricultural Development (IFAD), the Office for the Coordination of Humanitarian Affairs (OCHA) and the UN Secretariat also are part of the development system of the UN. The mandates of these entities vary widely, ranging from service provision to policy development and standard setting.
Funding for operational activities for development amounted to USD 26.7 billion in 2015, of which 77% was earmarked to specific projects and entities. Some 80% of total contributions in 2015 were made by governments. The European Commission, non-governmental organisations, public-private partnerships and other multilateral institutions such as global funds provided the remaining 20%.
Within the UN Economic and Social Council (ECOSOC), discussions are underway to reform the UN development system and refocus its functions to better align them with implementation of the 2030 Agenda. In January 2018, UN Secretary-General António Guterres proposed reforms that anticipate an improvement of the UN’s country presence by rationalising and streamlining UN country teams and reinvigorating the leadership of Resident Coordinators (UN, 2017[55]) The refocusing of UN functions has implications for its financing model and points in particular to the need for strengthened system-wide funding mechanisms. Given the high reliance on earmarked funding, the reforms aim to enhance the predictability of resources by increasing the share of core funding to individual agencies and the share of pooled funds at the country level (UN, 2017[55]).
The International Monetary Fund (IMF) provides financial support for member countries facing balance of payments crises upon request of the country. The IMF does not lend for specific projects, unlike development banks, and most of its lending is non-concessional. In most cases, a country’s commitment to implement the IMF’s recommended policies, known as policy conditionality, must be assured before lending is provided.
The IMF also provides concessional financial support, currently at zero interest rates, through the Poverty Reduction and Growth Trust (PRGT), which has three lending windows and a target annual lending capacity of SDR 1.25 billion (USD 2 billion) (IMF, n.a.[56]):
-
Extended Credit Facility (ECF): Medium- to long-term engagement for protracted balance-of-payment-crises
-
Standby Credit Facility (SCF): Financing for actual or potential short-term balance of payments and adjustment needs
-
Rapid Credit Facility (RCF): Rapid financial support as a single up-front payout for urgent balance of payments needs
In addition to its lending activities, the IMF provides technical assistance and training in a wide range of areas, such as central banking, monetary and exchange rate policy, tax policy and administration, and official statistics.
A large portion of multilateral resources is non-concessional and targets middle-income countries
Depending on the type of organisation, financing flows from multilateral providers can be concessional or non-concessional. Financing from most UN entities is concessional and consists of grants for projects in developing countries. MDBs have both concessional and non-concessional financing windows. Non-concessional financing typically consists of loans extended to middle-income country governments, some creditworthy low-income country governments and in some instances to private companies. Concessional windows of MDBs provide grants and highly concessional loans to low-income country governments.
In 2016, concessional and non-concessional financing provided by multilateral actors reporting to the DAC amounted to USD 33 billion and USD 68 billion respectively.21 While non-concessional flows are more than twice as large as concessional flows, they are provided exclusively by multilateral development banks (USD 59.6 billion) and the IMF (USD 7.8 billion). Multilateral flows tend to focus on middle-income countries. This is due to the fact that non-concessional financing, which takes up a larger share of the overall financing provided, often targets countries who are able to repay financing at market terms. Regarding non-concessional flows (excluding IMF loans), 41% were allocated to lower middle-income countries and 52% to upper middle-income countries. Low-income countries received 30% of concessional flows and lower middle-income countries 50% of the total.
Multilateral providers have several comparative advantages
Multilateral providers have several advantages that give them a special place within the financing for sustainable development system. Because of their convening power, they are unique in the support they can give to collective international action to provide the global public goods needed to tackle border-transcending problems such as climate change and humanitarian and global health crises (OECD, 2015[57]). By pooling resources from multiple bilateral providers, multilateral providers can help to reduce fragmentation of development efforts and enhance policy coherence.
Multilateral providers often have specialised knowledge in policy reforms and/or specific sectors, for example in infrastructure in which 37.2% of all multilateral flows are concentrated. Multilateral organisations often have extensive country presence and political knowledge, in particular in fragile contexts. From 2010 to 2016, per capita financing from multilateral institutions for fragile and conflict-affected states increased to USD 17 in 2016 from USD 14 in 2010, indicating an increased focus on fragile contexts.
Multilateral providers, and MDBs in particular, are well equipped to leverage resources from private sources to support the shift from billions to trillions for financing the SDGs. As they generally finance only a share of a project, MDBs by design are in the business of mobilising additional investors by setting up pooled funding structures and providing advice and risk mitigation (World Bank, 2015[58]). In addition to participating in the financing of projects, MDBs also explore other means of private sector resource mobilisation, some of which are discussed in Chapter 3. One example is the IFC Asset Management Company (AMC). A wholly owned subsidiary of the IFC in the form of a private equity company, it manages funds from private investors and invests them in companies and projects in developing countries. Since its establishment in 2009, the AMC has raised USD 10 billion across 13 funds (International Finance Corporation, 2018[59]).
Partnerships are key to making the multilateral system fit for purpose
The multilateral system is expanding and becoming more complex. The arrival of new players such as the Asian Infrastructure Investment Bank (AIIB) and the New Development Bank (NDB) reflects changing dynamics in the financing for development system. The addition of new international agencies may be a double-edged sword. The share of bilateral contributions channelled through multilateral agencies has remained stable. But the increasing number of players, in some cases with overlapping responsibilities, comes at the risk of aid fragmentation.
The best way for multilateral providers to maintain their credibility in this environment is to better co-ordinate their efforts and division of labour. Initiatives aimed at encouraging and enhancing such collaboration are underway to make full use of core comparative advantages. For example, the UN-World Bank partnership framework to build resilience and sustain peace in conflict areas, which has been in place since 2008 and was updated in 2017, provides a platform to “develop joint analyses and tools for more effective solutions; co-ordinate support to address protracted crises; and scale up impact by leveraging financing” (UN-World Bank, 2017[60]).
In order to remain relevant in an increasingly diverse sustainable development finance system, multilateral providers are also pursuing more inclusive partnerships with various financing for development actors including the private sector, civil society and countries engaging in South-South co-operation (Kharas, 2010[61]). MDBs in particular need to act on their ability to catalyse private sector financing. The forthcoming OECD report, Multilateral Development Finance 2018, focuses on efforts by MDBs to mobilise private finance (OECD, forthcoming[62]).
Subnational providers
-
Funds channelled through decentralised development co-operation are relatively small, with volumes standing at USD 1.9 billion in 2015.
-
The portions of decentralised development co-operation going to different sectors is 12% to health; 10% to, agriculture, 8% to education and 6% to water.
Subnational actors are involved in financing for sustainable development at various levels
Subnational actors contribute to financing for sustainable development through activities that are collectively termed decentralised development co-operation. The concept of decentralised development co-operation originated in the 1980s in the context of a retrenchment of central governments in favour of an increased role for local and regional governments to promote public-private partnerships. However even earlier, in 1971, the UN General Assembly recognised in a resolution the practice of municipal twinning as a tool for international co-operation. Over time, these city-to-city partnerships grew to involve other subnational public authorities and public agencies. Examples include water authorities in the case of France and in the Netherlands. In this way, decentralised development co-operation activities were expanded not only in terms of the sectoral focus but also the levels of government involved. The Addis Ababa Action Agenda reaffirmed the growing trend in decentralisation of public spending to local and regional actors across developing and developed countries alike (paragraph 34).
The actors involved in DDC range from governmental to non-governmental and across the local to the regional and provincial levels. The OECD report, Reshaping Decentralised Development Co-operation (2018[63]), identifies four tentative categories with respect to roles and responsibilities of various actors, according to whether the lead role is that of a promoter, enabler, facilitator or implementer (Figure 2.16Decentralised development co-operation contributes to the localisation of financing for sustainable development). This section on subnational providers overall is largely drawn from the analysis in this report.
Subnational governments including regions, provinces and municipalities tend to be the primary promoters of decentralised development co-operation, together with central government public agencies or sectoral ministries. Beyond central and subnational governments, decentralised development co-operation activities involve diverse partnerships with a wide range of actors. Universities and research centres are often active as enablers, facilitators and implementersDecentralised development co-operation contributes to the localisation of financing for sustainable development. They can offer support to strengthen the evidence base and evaluation of decentralised projects, leading to a strengthening of local technical capacity. NGOs, civil society organisations and youth volunteers increasingly play a significant role in decentralised development co-operation projects, specifically as implementers.
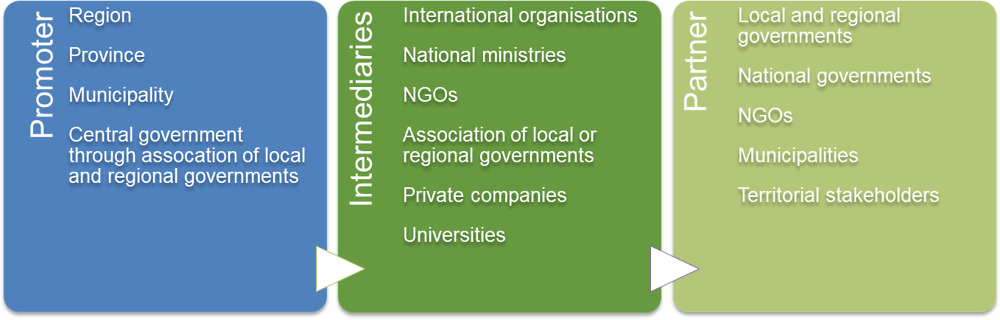
Source: OECD (2018[63]), Reshaping Decentralised Development Co-operation: The Key Role of Cities and Regions for the 2030 Agenda, https://doi.org/10.1787/9789264302914-en.
Decentralised development co-operation contributes to the localisation of financing for sustainable development
Funds channelled through decentralised development co-operation are relatively small, with volumes standing at USD 1.9 billion in 2015. Variation in volumes across countries and years is quite high – much greater than variations in ODA extended by central governments. Over the 2005-15 period, decentralised development co-operation spending increased for Austria (+360%), Switzerland (+44%), Italy (+39%) and Belgium (+16%). It decreased for Greece (-100%), Portugal (-97%), Spain (-56%), Japan (-46%) and Germany (-4%).
Decentralised development co-operation owes its comparative advantage to its reliance on local know-how and expertise through local governments. Reshaping Decentralised Development Co-operation (OECD, 2018[63]) argues that this form of development co-operation contributes to improving the quality of local government services and broadens their coverage, increasing the satisfaction with and trust in local administration, and providing wider access to financing for sustainable development.
Specific challenges such as delivery of public services to informal urban settlements, action led by local governments to face climate change and migration to urban areas are key areas where subnational actors can have a significant development-enhancing role. Local government empowerment is expected to develop competences for local revenue mobilisation and to provide access to long-term financing for sustainable development mechanisms.
In line with these priorities, decentralised development co-operation targets primarily health, education, agriculture and water (Figure 2.17Systematic data collection and co-ordination can support subnational actors). In 2015, decentralised development co-operation mainly targeted multisector activities, which represented 21% of total sector-allocable resources. The sectors included were education/training, scientific research, rural development, and in-donor refugee costs. Health and agriculture sectors represent 12% and 10% of decentralised development co-operation respectively; education amounted to 8% and the water sector amounted to 6% of total sector-allocable decentralised development co-operation. However, these figures must be treated with caution, as reporting on sector-allocable decentralised development co-operation is limited due to reporting challenges faced by several DAC members.
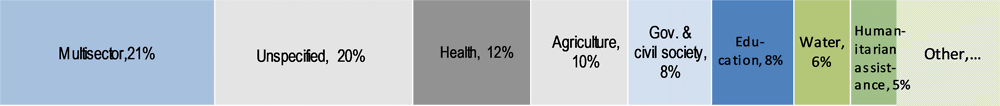
Source: OECD (2018[63]), Reshaping Decentralised Development Co-operation: The Key Role of Cities and Regions for the 2030 Agenda, https://doi.org/10.1787/9789264302914-en.
Systematic data collection and co-ordination can support subnational actors
-
Though small in absolute volumes, financing for development by subnational actors contributes to the localisation of the SDGs. Based on a spirit of voluntarism and commitment to embed in local communities and mechanisms, these activities help to bring global agendas close to home. Further engagement through decentralised development co-operation activities can support and strengthen local governance in developing countries while empowering communities and promoting collaboration between local authorities and civil society.
-
Challenges in decentralised development co-operation lie mainly in the high transaction costs associated with the small scale of the projects. National governments, global networks or platforms, and national associations of local and regional governments can play an important role to facilitate the co-ordination of decentralised development co-operation activities. Better reporting on these activities can facilitate the stock taking and information gathering that are pre-requisites for a better and more systematic co-ordination of efforts across levels of government and across sectors.
Moving towards financing for sustainable development
The different actors discussed in this chapter make distinct contributions – in volume as well as in type – to financing sustainable development. External finance of many types remains critical, while domestic resources are the predominant form of financing. Sustainable development pathways will see countries growing their own public and private domestic resources while retaining interdependence with the global economic system.
The remainder of this report argues that while it is necessary to mobilise a greater volume of financing, an even more fundamental shift is required – that is, a shift of the trillions of already-available domestic and external finance towards achieving the SDGs.
To achieve this, it is important to exploit the diversity of this financing landscape and the actors within it, effectively creating a financing for sustainable development system. This requires a thorough understanding of the role of different actors, the instruments they use and how they interact. Equally important is the establishment of measurement, policy and operational frameworks to make the most of each actor and each source of financing. However, bringing together this diverse set of actors with different motivations is an enormous challenge. There are key limitations that need to be addressed to move from mere financing for development to financing for sustainable development. Some examples are:
-
Data availability is a serious constraint in mapping the contributions of different actors. While ample anecdotal evidence suggests that new actors in developing countries are providing a larger portion of cross-border finance, the lack of consolidated data (beyond ODA provided by the DAC members) makes it difficult to sufficiently consider their role. For example, estimates of the amounts of concessional finance provided by China in a single year range from USD 3 billion to USD 7 billion. Further efforts are needed to promote transparency and a more systematic and comparable reporting of contributions, such as the measure of total official support for sustainable development (TOSSD), as is recognised in paragraph 55 of the AAAA.
-
Different actors have different degrees of obligation towards the SDGs. For example, cross-border investments and remittances are based on inherently private decisions rather than a motivation to achieve the SDGs. Policy, both in developing countries and in sending countries, can influence these private actions. For example, promoting financial inclusion can help to channel remittance flows to areas with high development impact.
These limitations will be addressed in Part II of this report, which introduces action areas to tackle the challenges of measurement (Chapter 4), policy coherence and policy gaps (Chapter 5), and operational choices (Chapter 6).
References
[43] Adams, R. and A. Cuecuecha (2010), “The economic impact of international remittances on poverty and household consumption and investment in Indonesia”, Policy Research Working Papers, World Bank, Washington, DC, https://doi.org/10.1596/1813-9450-5433.
[117] Agarwal, R. (1997), “Foreign portfolio investment in some developing countries: A study of determinants and macroeconomic impact”, Indian Economic Review, Vol. 17/2, pp. 217–229, http://www.jstor.org/stable/29794138.
[118] Ahmed, S. and A. Zlate (2014), “Capital flows to emerging market economies: A brave new world?”, Journal of International Money and Finance, Vol. 48/Part B, pp. 221-248, https://doi.org/10.1016/j.jimonfin.2014.05.015.
[121] Albuquerque de Sousa, J. et al. (2016), “Nascent markets: Understanding the success and failure of new stock markets”, ISS Working Papers, No. 623, International Institute of Social Studies of Erasmus University Rotterdam (ISS), The Hague., https://ideas.repec.org/p/ems/euriss/94639.html.
[119] Alden, C. (2007), China in Africa, Zed Books.
[48] Alesina, A. and D. Dollar (2000), “Who gives foreign aid to whom and why?”, Journal of Economic Growth, Vol. 5/1, pp. 33-63, https://doi.org/doi:10.1023/A:1009874203400.
[102] Ali, M. and A. Seric((n.d.)), “Diffusion of labor standards from origin to host countries: Cross county evidence from multinational companies in Africa”.
[6] Alvaredo, F. et al. (2018), World Inequality Report 2018, World Inequality Lab, https://wir2018.wid.world/files/download/wir2018-full-report-english.pdf.
[45] Andrews, F. (1950), Philanthropic Giving, Russell Sage Foundation, New York, https://www.russellsage.org/publications/philanthropic-giving.
[22] Anginer, D. et al. (2014), “Foreign bank subsidiaries' default risk during the global crisis: What factors help insulate affiliates from their parents?”, IMF Working Papers, No. 16/109, International Monetary Fund, https://www.imf.org/en/Publications/WP/Issues/2016/12/31/Foreign-Bank-Subsidiaries-Default-Risk-during-the-Global-Crisis-What-Factors-Help-Insulate-43944.
[120] Arnold, J. and B. Javorcik (2009), “Gifted kids or pushy parents? Foreign direct investment and plant productivity in Indonesia”, Journal of International Economics, Vol. 79/1, https://doi.org/10.1016/j.jinteco.2009.05.004.
[65] Banks, N., D. Hulme and M. Edwards (February 2015), “NGOs, States, and Donors Revisited: Still Too Close for Comfort?”, World Development, Vol. 66, pp. 707-718, https://doi.org/10.1016/j.worlddev.2014.09.028.
[137] Bhattacharya, A. et al. (2018), The New Global Agenda and the Future of the Multilateral Development Bank System, Brookings Institution/Center for Global Development/Overseas Development Institute, https://www.brookings.edu/wp-content/uploads/2018/02/epg_paper_on_future_of_mdb_system_jan301.pdf.
[90] Chong, A. and M. Gradstein (2008), “What determines foreign aid? The donors' perspective”, Journal of Development Economics, Vol. 87/1, pp. 1-13.
[126] Cuervo-Cazurra, A. and M. Genc (2008), “Transforming disadvantages into advantages: Developing-country MNEs in the least developed countries”, Journal of International Business Studies, Vol. 39/6, pp. 957-979, https://doi.org/10.1057/palgrave.jibs.8400390.
[21] Cull, R. et al. (2017), “Bank ownership trends and implications”, IMF Working Papers, No. 17/60, https://www.imf.org/en/Publications/WP/Issues/2017/03/22/Bank-Ownership-Trends-and-Implications-44753.
[138] Davies, R. and J. Pickering (2015), “Making development co-operation fit for the future: A survey of partner countries”, OECD Development Co-operation Working Papers, No. 20, OECD Publishing, Paris, https://doi.org/10.1787/5js6b25hzv7h-en.
[29] Dealogic (2018), , https://www.dealogic.com/content/.
[19] Demirgüç-Kunt, A. et al. (2018), Global Findex Database 2017: Measuring Financial Inclusion and the Fintech Revolution, World Bank, Washington, DC, https://doi.org/10.1596/978-1-4648-1259-0.
[139] Di Giovanni, J. and A. Levchenko (2008), “Trade Openness and Volatility”, Review of Economics and Statistics, Vol. 91/3.
[127] Dollar, D. (2016), “China as a global investor”, Asia Working Group Paper, No. 4, The Brookings Institution, Washington, DC, https://www.brookings.edu/wp-content/uploads/2016/07/China-as-a-Global-Investor_Asia-Working-Paper-4-2.pdf.
[88] Dollar, D. and V. Levin (2006), “The Increasing Selectivity of Foreign Aid, 1984-2003”, World Development, Vol. 34/12, pp. 2034–2046.
[140] Easterly, W. and C. Williamson (2011), “Rhetoric versus reality: The best and worst of aid agency practices”, World Development, Vol. 39/11, pp. 1930–1949.
[24] Eichengreen, B., D. Park and K. Shin (2017), “The lansdcape of economic growth: Do middle-income countries differ?”, ADB Economics Working Paper Series, No. 517, Asian Development Bank.
[52] Esteves, P. and M. Assunção (2014), “South–South cooperation and the international development battlefield: between the oecd and the UN”, Third World Quarterly , Vol. 35/10, pp. 1775-1790.
[130] Estrada, G., D. Park and A. Ramayandi (2015), Financial development, financial openness, and economic growth, Asian Development Bank, https://www.adb.org/sites/default/files/publication/172441/ewp-442.pdf.
[110] European Commission (2017), Echo Factsheet - Turkey: Refugee Crisis.
[54] Faure, R., A. Prizzon and A. Rogerson (2015), Multilateral development banks: A short guide, ODI, https://www.odi.org/sites/odi.org.uk/files/resource-documents/10650.pdf.
[13] Fenochietto, R. and C. Pessino (2013), “Understanding countries' tax effort”, IMF Working Papers, No. 13/234, International Monetary Fund, https://www.imf.org/en/Publications/WP/Issues/2016/12/31/Understanding-Countries-Tax-Effort-41132.
[111] G7+((n.d.)), Policy Note on Fragile-to-Fragile Cooperation, http://www.g7plus.org/sites/default/files/basic-page-downloads/g7%2B-Policy-Note-on-Fragile-to-Fragile-Cooperation-English.pdf.
[12] Gaspar, V., L. Jaramillo and P. Wingender (2016), “Tax capacity and growth : Is there a tipping point?”, IMF Working Papers, No. WP/16/234, IMF, https://www.imf.org/en/Publications/WP/Issues/2016/12/31/Tax-Capacity-and-Growth-Is-there-a-Tipping-Point-44436.
[69] Greenhill, R., A. Prizzon and A. Rogerson (2013), The age of choice: developing countries in the new aid landscape.
[107] Griffith-Jones, S., E. Karwowski and F. Dafe (2014), A financial sector to support development in low income countries.
[91] Gulrajani, N. and L. Swiss (2017), Why do countries become donors? Assessing the drivers and implications of donor proliferation.
[92] Hernandez, D. (2016), Are " New " Donors Challenging World Bank Conditionality?.
[23] IFC (2013), “Access to credit among micro, small, and medium enterprises”, IFC Advisory Services, International Finance Corporation (IFC), Washington, DC, https://www.ifc.org/wps/wcm/connect/1f2c968041689903950bb79e78015671/AccessCreditMSME-Brochure-Final.pdf?MOD=AJPERES.
[95] IMF (2018), Macroeconomic Develoopments and Prospects in Low-Income Developing Countries.
[30] IMF (2018), “World Economic Outlook (database)”, http://www.imf.org/external/pubs/ft/weo/2018/01/weodata/index.aspx.
[5] IMF (2017), “Balance of Payments (database)”, http://www.imf.org/external/datamapper/datasets/BOP.
[136] IMF (2017), “Heavily Indebted Poor Countries (HIPC) Initiative and Multilateral Debt Relief Initiative (MDRI): Statistical update”, Staff Report, International Monetary Fund, http://www.imf.org/en/Publications/Policy-Papers/Issues/2017/09/15/pp090117hipc-mdri-statistical-update.
[41] IMF (2017), “Review of the debt sustainability framework in low-income countries: Proposed reforms”, IMF Policy Paper, International Monetary Fund, http://www.imf.org/en/Publications/Policy-Papers/Issues/2017/10/02/pp082217LIC-DSF.
[1] IMF (2017), World Revenue Longitudinal Data (database), https://data.world/imf/world-revenue-longitudinal-dat.
[76] IMF (2016), IMF Macroeconomic Developments and Prospects in Low Income Developing Countries -2016.
[32] IMF (2016), World Economic Outlook: Subdued Demand: Symptoms and Remedies, April, IMF, Washington D.C., https://www.imf.org/en/Publications/WEO/Issues/2016/12/31/Subdued-Demand-Symptoms-and-Remedies.
[7] IMF (2014), “Fiscal policy and income inequality”, IMF Policy Paper, International Monetary Fund (IMF), Washington, DC, https://www.imf.org/external/np/pp/eng/2014/012314.pdf.
[14] IMF (2014), Spillovers in international corporate taxation, International Monetary Fund (IMF), Washington D.C., https://www.imf.org/external/np/pp/eng/2014/050914.pdf.
[18] IMF (2012), Enhancing Financial Sector Surveillance in Low-Income Countries: Financial Deepening and Macro-stability, International Monetary Fund (IMF), Washington, DC, https://www.imf.org/external/np/pp/eng/2012/041612.pdf.
[56] IMF (n.a.), Lending by the IMF, International Monetary Fund, https://www.imf.org/external/about/lending.htm.
[75] IMF (April 2014), Public Expenditure Reform: Making Difficult Choices.
[11] IMF et al. (2016), Enhancing the Effectiveness of External Support in Building Tax Capacity in Developing Countries, OECD Publishing, Paris, http://www.oecd.org/ctp/enhancing-the-effectiveness-of-external-support-in-building-tax-capacity-in-developing-countries.pdf.
[106] Inchauste, G. and N. Lustig (2017), The Distributional Impact of Taxes and Transfers : Evidence From Eight Developing Countries. Directions in Development—Poverty, World Bank, https://openknowledge.worldbank.org/handle/10986/27980 License: CC BY 3.0 IGO.
[59] International Finance Corporation (2018), “IFC Asset Management Company: Funds (website)”, https://www.ifcamc.org/funds (accessed on 18 June 2018).
[40] Jackman, M. (2013), “Macroeconomic determinants of remittance volatility: An empirical test”, International Migration, Vol. 51/s1, pp. e36-e51.
[123] Janský, P. and M. Palanský (2018), “Estimating the scale of profit shifting and tax revenue losses related to foreign direct investment”, WIDER Working Paper, No. 2018/21, UN University World Institute for Development Economics Research, https://www.wider.unu.edu/sites/default/files/Publications/Working-paper/PDF/wp2018-21.pdf.
[93] Jenks, B. et al. (2017), Financing the UN Development System - Pathways to Reposition for Agenda 2030.
[109] Jones, E. and P. Knaack (2017), FCA Think Piece: The Future of Global Financial Regulation.
[77] Kaminsky, G., C. Reinhart and C. Vegh (2004), Frontier Markets: Punching Below their Weight? A Risk Parity Perspective on Asset Allocation.
[85] Ketkar, S. and D. Ratha (2001), Development Financing During a Crisis: Securitization of Future Receivables, https://openknowledge.worldbank.org/handle/10986/19672.
[132] Kharas, H. (2008), Measuring the Cost of Aid Volatility, Brookings Institute, https://www.brookings.edu/wp-content/uploads/2016/06/07_aid_volatility_kharas.pdf.
[61] Kharas, H. (2010), “Rethinking the roles of multilaterals in the global aid architecture”, The 2010 Brookings Blum Roundtable Policy Briefs, Brookings Institute, https://www.brookings.edu/wp-content/uploads/2016/07/09_development_aid_kharas2.pdf.
[87] Klingebiel, S. (2013), Multilateral Aid Structural Change and Donor Preferences.
[70] Easterly, W. (ed.) (2008), Donor Fragmentation, MIT Press.
[113] Kose, M., F. Ohnsorge and L. Ye (2017), Capital Slowdown, IMF.
[101] Krueger, A. (1990), “Asian trade and growth lessons”, American Economic Review, Vol. 80, pp. 108–112.
[50] Lakatos, C. et al. (2016), “China's slowdown and rebalancing potential growth and poverty impacts on Sub-Saharan Africa”, Policy Research Working Paper, No. WPS7666, World Bank, Washington, DC, http://documents.worldbank.org/curated/en/976611468194051601/pdf/WPS7666.pdf.
[16] Levine, R. (2005), “Finance and growth: Theory and evidence”, in Aghion, P. and S. Durlauf (eds.), Handbook of Economic Growth, Volume 1, Elsevier.
[122] Long, C. and M. Miller (2017), “Taxation and the Sustainable Development Goals: Do good things come to those who tax more?”, Briefing Note, ODI, https://www.odi.org/sites/odi.org.uk/files/resource-documents/11695.pdf.
[10] Lustig, N. (2017), “Fiscal policy, income redistribution and poverty reduction in low and middle income countries”, CEQ Working Paper, No. 54, CEG Institute, Tulane University, New Orleans, http://www.commitmentoequity.org/wp-content/uploads/2017/08/CEQ_WP54_Lustig_June2017.pdf.
[64] Marten, R. and J. Witte (2008), Transforming development? The role of philanthropic foundations in international development cooperation.
[47] Marten, R. and J. Witte (2008), “Transforming Development? The role of philanthropic foundations in international development cooperation”, GPPi Research Paper Series, No. 10, Global Public Policy Institute, Berlin, https://www.files.ethz.ch/isn/57130/No.10_Transforming_Development.pdf.
[141] McKenzie, D. (2014), “Almost 80 percent of the growth in remittances to developing countries over the past 20 years is an illusion”, World Bank Development Impact blog, http://blogs.worldbank.org/impactevaluations/almost-80-percent-growth-remittances-developing-countries-over-past-20-years-illusion.
[66] Morton, B. (2013), An Overview of International NGOs in Development Cooperation, UNDP, http://www.cn.undp.org/content/dam/china/docs/Publications/UNDP-CH11 An Overview of International NGOs in Development Cooperation.pdf.
[72] Odedokun, M. (2004), “Multilateral and Bilateral Loans versus Grants: Issues and Evidence”, The World Economy, Vol. 27, pp. 239–263, https://doi.org/10.1111/j.1467-9701.2004.00598.x.
[3] OECD (2018), Creditor Reporting System (database), OECD, Paris, https://stats.oecd.org/Index.aspx?DataSetCode=crs1.
[2] OECD (2018), Global Revenue Statistics (database), http://www.oecd.org/tax/tax-policy/global-revenue-statistics-database.htm.
[33] OECD (2018), OECD Economic Outlook, OECD Publishing, Paris, https://doi.org/10.1787/eco_outlook-v2018-1-en.
[46] OECD (2018), Private Philanthropy for Development, OECD Publishing, Paris, https://doi.org/10.1787/9789264085190-en.
[63] OECD (2018), Reshaping Decentralised Development Co-operation: The Key Role of Cities and Regions for the 2030 Agenda, OECD Publishing, Paris, https://doi.org/10.1787/9789264302914-en.
[81] OECD (2017), Development Co-operation Report 2017: Data for Development, OECD Publishing, Paris, https://doi.org/10.1787/dcr-2017-en.
[42] OECD (2017), Interrelations between Public Policies, Migration and Development, OECD Publishing, Paris, https://doi.org/10.1787/9789264265615-en.
[31] OECD (2016), OECD Business and Finance Outlook 2016, OECD Publishing, Paris, https://doi.org/10.1787/9789264257573-en.
[57] OECD (2015), Multilateral Aid 2015: Better Partnerships for a Post-2015 World, OECD Publishing, Paris, https://doi.org/10.1787/9789264235212-en.
[83] OECD (2014), Illicit Financial Flows from Developing Countries: Measuring OECD Responses, OECD Publishing, Paris, https://doi.org/10.1787/9789264203501-en.
[103] OECD (2014), The New Development Finance Landscape: emerging and preliminary perspectives from the cases of Ghana, Senegal and Timor-Leste.
[53] OECD (2013), Identification and Monitoring of Potentially Under-aided Countries, OECD Publishing, Paris, https://www.oecd.org/dac/aid-architecture/Identification%20and%20Monitoring%20of%20Potentially%20Under-Aided%20Countries.pdf.
[104] OECD (2011), 2011 DAC Report on Multilateral Aid.
[8] OECD (2008), Growing Unequal?: Income Distribution and Poverty in OECD Countries, OECD Publishing, Paris, https://doi.org/10.1787/9789264044197-en.
[114] OECD (2006), International Migration Outlook 2006, https://doi.org/10.1787/migr_outlook-2006-en..
[34] OECD (2006), International Migration Outlook 2006, OECD Publishing, Paris, https://doi.org/10.1787/migr_outlook-2006-en.
[62] OECD (forthcoming), Multilateral Development Finance Report 2018.
[84] OECD (19-20 November 2013), Possible Update to Classification by Types of Finance.
[116] OECD DAC (2016), “Converged statistical reporting directives for the Creditor Reporting System and the annual DAC questionnaire”, OECD, https://www.oecd.org/dac/financing-sustainable-development/development-finance-standards/DCDDAC(2016)3FINAL.pdf.
[82] OECD/ATAF/AUC (2017), Revenue Statistics in Africa 2017, OECD Publishing, Paris, https://doi.org/10.1787/9789264280854-en-fr.
[67] Overseas Development Institute (ODI); European Centre for Development Policy Management (ECDPM); German Development Institute (GDI/DIE); University of Athens; Southern Voice Network (2015), Combining finance and policies to implement a transformative post-2015 development agenda, http://ecdpm.org/publications/european-report-on-development-2015/.
[89] Palagashvili, L. and C. Williamson (2014), “Ranking Foreign Aid Agency Best Practices: New Donors, New Findings”.
[135] PWC (2018), 2017 African Capital Market Watch, PWC, https://www.pwc.co.za/en/assets/pdf/african-capital-markets-2018.pdf.
[39] Ratha, D. (2005), “Workers’ remittances: An important and stable source of external development finance”, Economics Seminar Series, No. 9, https://repository.stcloudstate.edu/econ_seminars/9/.
[37] Ratha, D. et al. (2018), “Transit Migration”, Migration and Development Brief, No. 29, World Bank Group, Washingto, DC, https://www.knomad.org/publication/migration-and-development-brief-29.
[20] Reaves, B. et al. (2017), “Mo(bile) money, mo(bile) problems: Analysis of branchless banking applications in the developing world”, ACM Transactions on Privacy and Security, Vol. 20/3, https://doi.org/10.1145/3092368.
[68] Renzio, P. and J. Seifert (2014), “South–South cooperation and the future of development assistance: mapping actors and options”, Third World Quarterly, Vol. 35/10, pp. 1860-1875, https://doi.org/10.1080/01436597.2014.971603.
[35] Rodriguez-Montemayor, E. (2012), “Diaspora direct investment: Policy options for development”, Policy Brief, No. IDB-PB-183, Inter-American Development Bank, https://publications.iadb.org/bitstream/handle/11319/1444/Diaspora%20Direct%20Investment%20Policy%20Options%20for%20Development.pdf?sequence=1&isAllowed=y.
[131] Sahay, R. et al. (2015), “Rethinking financial deepening: Stability and growth in emerging markets”, IMF Staff Discussion Note, No. 15/08, International Monetary Fund, https://www.imf.org/external/pubs/ft/sdn/2015/sdn1508.pdf.
[74] Savoy, C. and C. Perkins (2014), Taxes and Development: The Promise of Domestic Resource.
[78] Securities Commission Malaysia (2017), The Rise of Islamic Finance in Africa.
[36] Singer, D. (2010), “Migrant remittances and exchange rate regimes in the developing world”, American Political Science Review, Vol. 104/2, https://doi.org/10.1017/S0003055410000110.
[125] Sula, O. and T. Willett (2009), “The reversibility of different types of capital flows to emerging markets”, Emerging Markets Review, Vol. 10/4, pp. 296-310, https://doi.org/10.1016/j.ememar.2009.08.001.
[115] Tamarappoo, R. et al. (2016), Analysis of the Linkage between Domestic Revenue Mobilization and Social Sector Spending, USAID, Washington, DC, https://sidw.org/sites/default/files/DRM%20and%20Social%20Sector%20Spending%20-%20Pooja%27s%20Doc.pdf.
[112] Tiwari, S., R. Sahay and A. Sayeh((n.d.)), ENHANCING FINANCIAL SECTOR SURVEILLANCE IN LOW- INCOME COUNTRIES—BACKGROUND PAPER.
[96] UN (2017), FINANCING FOR DEVELOPMENT: PROGRESS AND PROSPECTS - Report of the Inter -agency Task Force on Financing for Development 2017.
[105] UN (2017), Population Facts.
[55] UN (2017), Repositioning the United Nations development system to deliver on the 2030 Agenda: Our promise for dignity, prosperity and peace on a healthy planet, United Nations, New York.
[124] UN (2015), Addis Ababa Action Agenda, United Nations, http://www.un.org/esa/ffd/wp-content/uploads/2015/08/AAAA_Outcome.pdf.
[17] UN Capital Development Fund (2018), “Financial inclusion and the SDGs (website)”, http://www.uncdf.org/financial-inclusion-and-the-sdgs.
[80] UNCTAD (2017), World Investment Report 2017.
[25] UNCTAD (2013), World Investment Report 2013 - Global Value Chains: Investment and Trade for Development, United Nations Conference on Trade and Development, Geneva and New York, http://unctad.org/en/PublicationsLibrary/wir2013_en.pdf.
[51] UNDP (2016), Scaling-Up South-South Cooperation for Sustainable Development, UNDP, New York, http://www.undp.org/content/undp/en/home/librarypage/development-impact/Scaling-Up_SSC_for_Sustainable_Development.html.
[44] UNDP (2016), “Unleashing the potential philanthropy in China (press release)”, http://www.cn.undp.org/content/china/en/home/presscenter/pressreleases/2016/05/30/unleashing-the-potential-of-philanthropy-in-china-.html.
[60] UN-World Bank (2017), “Joint statement on signing of new UN-World Bank framework to build resilience and sustain peace in conflict areas”, United Nations Secretary-General website, https://www.un.org/sg/en/content/sg/note-correspondents/2017-04-22/joint-statement-signing-new-un-world-bank-framework-build.
[97] Weber, K., G. Davis and M. Lounsbury (2009), “Policy as myth and ceremony? the global spread of stock exchanges, 1980-2005”, Academy of Management Journal.
[108] Wolff, P. (2013), Policy Briefing: The G-20 and Financial Regulation in Africa.
[71] Woods, N. (2008), “Whose Aid? Whose Influence? China, emerging donors and the silent revolution in development assistance”, International Affairs, Vol. 84/6, pp. 1205–1221.
[133] World Bank (2018), Global Findex Database 2017, World Bank, https://globalfindex.worldbank.org/.
[4] World Bank (2018), “Migration and Remittances database”, http://www.worldbank.org/en/topic/migrationremittancesdiasporaissues/brief/migration-remittances-data.
[38] World Bank (2018), “Remittance Prices Worldwide database”, https://remittanceprices.worldbank.org/en.
[9] World Bank (2018), The State of Social Safety Nets 2018, World Bank, https://openknowledge.worldbank.org/handle/10986/29115.
[15] World Bank (2018), “World Development Indicators”, https://data.worldbank.org/products/wdi.
[129] World Bank (2017), Global Financial Development Report 2017/2018: Bankers without Borders, World Bank, https://openknowledge.worldbank.org/handle/10986/28482.
[134] World Bank (2017), “Migration and remittances: Recent developments”, Migration and Development Brief, No. 28.
[73] World Bank (2015), Catalogue of the MDBs and the IMF Financing Solutions.
[58] World Bank (2015), From Billions to Trillions: MDB Contributions to Financing for Development.
[28] World Bank (2013), Capital for the Future: Saving and Investment in an Interdependent World, World Bank, Washington, DC, https://doi.org/10.1596/978-0-8213-9635-3.
[94] World Bank Group (2018), Global Investment Competitiveness Report 2017/2018 : Foreign Investor Perspectives and Policy Implications, Washington, DC: World Bank..
[86] World Bank Group (2010), Innovative Finance for Development Solutions- Initiatives of the World Bank Group., http://siteresources.worldbank.org/CFPEXT/Resources/IF-for-Development-Solutions.pdf.
[79] World Bank Group (2017), Global Investment Competitiveness Report 2017/18, https://doi.org/10.1596/978-1-4648-1175-3.
[27] World Bank Group et al. (2017), Global Value Chain Development Report 2017: Measuring and Analyzing the Impact of GVCs on Economic Development, World Bank Group, Washington, DC, https://www.wto.org/english/res_e/booksp_e/gvcs_report_2017.pdf.
[128] World Economic Forum (2013), Manufacturing for Growth: Strategies for Driving Growth and Employment, Volume 1cy, World Economic Forum, http://www3.weforum.org/docs/WEF_ManufacturingForGrowth_ReportVol1_2013.pdf.
[26] World Economic Forum (2013), The Future Role of Civil Society, http://www3.weforum.org/docs/WEF_FutureRoleCivilSociety_Report_2013.pdf.
[99] WTO (2017), Global Value Chain Report 2017- Measuring and Analyzing the Impact of GVCs on Economic Development.
[98] WTO (2017), Trade recovery expected in 2017 and 2018, amid policy uncertainty, https://www.wto.org/english/news_e/pres17_e/pr791_e.htm.
[100] WTO (2017), World Trade Statistical Review.
[49] Younas, J. (2008), “Motivation for bilateral aid allocation: Altruism or trade benefits”, European Journal of Political Economy, Vol. 24/3, pp. 661-674.
Notes
← 1. Tamarappoo et al. (2016[115]), in a recent study for USAID, estimate that a 10% increase in taxation leads to a 17% increase in public health expenditure in low-income countries, compared to a 4% and a 3% increase in lower middle-income and upper middle-income countries, respectively. See https://sidw.org/sites/default/files/DRM%20and%20Social%20Sector%20Spending%20-%20Pooja%27s%20Doc.pdf.
← 2. In the definition used in the study, fiscal policies include direct taxes, direct transfers, indirect taxes, indirect subsidies, and education and health services.
← 3. For example, Vulnerability-Adjusted Tax Effort Index, developed by the Foundation for International Development Study and Research (Ferdi), assesses least developed countries’ tax effort. It finds that higher “economic vulnerability” decreases potential tax revenue while higher “human assets” increases such revenue. See www.ferdi.fr/en/indicator/vulnerability-adjusted-tax-effort-index-vatei.
← 4. This average includes social security contributions.
← 5. A notable exception is China, where domestic business investment activity has compensated for declines in foreign investment. In China, a domestic mergers and acquisitions (M&A) boom has offset the decline in cross-border, inward M&A by more than tenfold. Between 2011 and 2017, domestic M&A in China averaged USD 322 billion while cross-border M&A over the same period amount to USD 37 billion.
← 6. The estimates are based on sample of 91 countries examined by Cull et al. (2017[21]). See www.imf.org/en/Publications/WP/Issues/2017/03/22/Bank-Ownership-Trends-and-Implications-44753.
← 7. These figures, drawn from OECD DAC statistics, include concessional and non-concessional official flows, private market flows, and remittances from OECD and non-OECD countries.
← 8. FDI is usually defined as the acquisition of at least a 10% equity stake in a firm and, usually allowing some control allowed over corporate decisions. Portfolio investment is defined as the acquisition of a less than 10% equity stake.
← 9. The value of cross-border M&As is usually one of the largest components of FDI flows. This report uses data on cross-border M&As to measure the importance of China as an investor in developing countries because bilateral FDI data does not provide sufficient coverage.
← 10. By way of comparison, fully-owned SOEs accounted for only 38% of China’s overall outward M&A during this period.
← 11. In 2001 and 2006, private investment amounted to more than 8% of GDP in UMICs. For LMICs, the share was more than 8% in 2001-03.
← 12. The figures are based on IMF Balance of Payment data and have been deflated using IMF GDP deflators and exchange rates from the April 2018 Edition of the World Economic Outlook and taking 2016 as base year.
← 13. M&As are one of the primary vehicles that multinational enterprises use to invest in foreign markets and comprise a major component of FDI. Data on M&A cover a variety of financial transactions that can range from the full merger of two previously independent firms to the acquisition of a minority stake in a strategic partner.
← 14. McKenzie (2014[141]) in a World Bank blogpost attributes part of the reported increase in remittances over time to changes in how they are measured. See http://blogs.worldbank.org/impactevaluations/almost-80-percent-growth-remittances-developing-countries-over-past-20-years-illusion.
← 15. The data on non-concessional financing provided by bilateral actors also include export credit that does not serve a development purpose.
← 16. While DAC members generally accept the 0.7% target for ODA, at least as a long-term objective, there are some notable exceptions. Switzerland, for one, did not adopt the target, and the United States stated that it did not subscribe to specific targets or timetables, although it supported the more general aims of the Resolution. See http://www.oecd.org/dac/stats/the07odagnitarget-ahistory.htm.
← 17. This figure may be subject to under-reporting. Using an open source methodology to track data on Chinese investment found in media sources, China AidData has estimated the volume of investment between 2000 and 2014 at USD 350 billion (2014 deflated USD), including USD 37 billion invested in 2014 alone. Of the estimated totals, USD 80 billion over the entire period and USD 7 billion in 2014 were comparable to ODA. See https://china.aiddata.org/.
← 18. Vertical funds are multilateral financing mechanisms that pool financing resources from both public and private sector sources to target needs in single development domains such as health (e.g. Global Alliance for Vaccines and Immunization, or GAVI) and climate finance (e.g. Green Climate Fund).
← 19. Trust funds are financing mechanisms administered by multilateral agencies on behalf of one or more bilateral donors to support defined development objectives (e.g. support for specific countries, regions or themes).
← 20. The UN system consists of the UN and many affiliated programmes, funds and specialised agencies, each with its own membership and budget. Programmes and funds are financed through voluntary rather than assessed contributions. Specialised agencies are independent international organisations financed by both voluntary and assessed contributions.
← 21. This figure does not include concessional finance in the amount of USD 18.6 billion that was provided in 2016 by the European Union, which acts more like a bilateral than a multilateral provider.