Chapter 3. Rethinking sector financing strategies to achieve the Sustainable Development Goals
Recognising that an overview of official finance by Sustainable Development Goal (SDG) is highly challenging given the multifaceted and integrated nature of the SDG agenda (Chapter 2), analyses along traditional sectors represent the strongest basis available to inform interventions targeting the SDGs. The first section of this chapter provides an overview of the main patterns and trends of sector financing by official development finance providers. It builds on an analytical framework that draws on the implications for sectoral analyses of the Addis Ababa Action Agenda, using both official development finance and private finance mobilised through official development interventions. The second section complements the first one by looking in more detail at the current division of labour between bilateral and multilateral providers across sectors. The third section then scopes the sector implications that the new SDG agenda has on providers’ sector financing strategies and how they can concretely adjust these financing strategies to reflect the new 2030 Agenda.
Key messages
Key messages to development co-operation providers emerging from this chapter include:
-
Overall, official development finance (ODF) has increased by 35% between 2012 and 2016 in real terms, benefiting all sectors in developing countries. In 2016, ODF from bilateral and multilateral providers of development co-operation amounted to USD 293.6 billion.
-
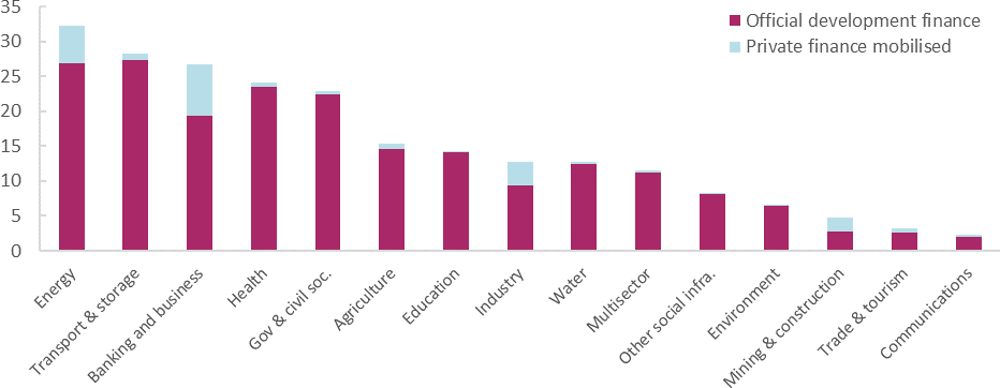
Development co-operation providers mobilise private finance only in a handful of sectors. An estimated USD 22.7 billion of private finance was mobilised every year by official development intervention during the period 2012-16. More than 80% of this was focused in just four sectors – banking and business, energy, industry and mining and construction. Unexpectedly, private finance is hardly mobilised by official interventions in sectors such as water (USD 318 million on average per year between 2012 and 2016) or transport and storage (USD 917 million).
-
The Sustainable Development Goals (SDGs) are expected results, not sectors of intervention. Providers of development co-operation have to map the impact of each sector intervention against each goal. For instance, a contribution to SDG 4 on education could be supported through direct investment in education (e.g. building schools and training teachers) and/or by increasing electricity access in rural areas (SDG 7) to enable children to study in the evening. Moreover, development partners can support global public goods as these are enablers for achieving development gains in multiple sectors.
-
Since the SDGs are primarily implemented domestically, sector strategies of development partners should align with the SDG targets defined by each partner country. SDG alignment requires engaging in dialogue with each partner country to identify the SDG priorities and aligning the providers’ country programmes with the targets identified. It will also require mainstreaming cross-cutting issues (e.g. gender and environment) as much as possible and finding the best delivery channels based on country context and local capacity. Finally, providers’ monitoring and evaluation frameworks need to be aligned with the SDGs to assess their effects and learn from experience.
-
Resources targeting the SDGs have to be distributed appropriately across sectors and countries, so as not to leave social sectors and the poorest countries, which have more difficulties mobilising financing, unfunded.
3.1. An overview of sector financing by official development partners
This section examines the contribution of official development partners to targeted sectors. In response to the Addis Ababa Action Agenda (AAAA) (United Nations, 2015[1]), it takes a broad view of this contribution. It does this by looking at the development partners’ reporting to the Development Assistance Committee’s (DAC’s) statistical systems during the period 2012-16.1 These development partners include members of and participants2 in the DAC and multilateral institutions. This section, like the rest of the publication, also presents official flows using the latest data on private finance mobilised through official development interventions. Thus it presents a global picture of officially supported flows3 to developing countries, including across sectors.
3.1.1. Official development finance is growing steadily
The share of ODF has grown steadily over the last five years
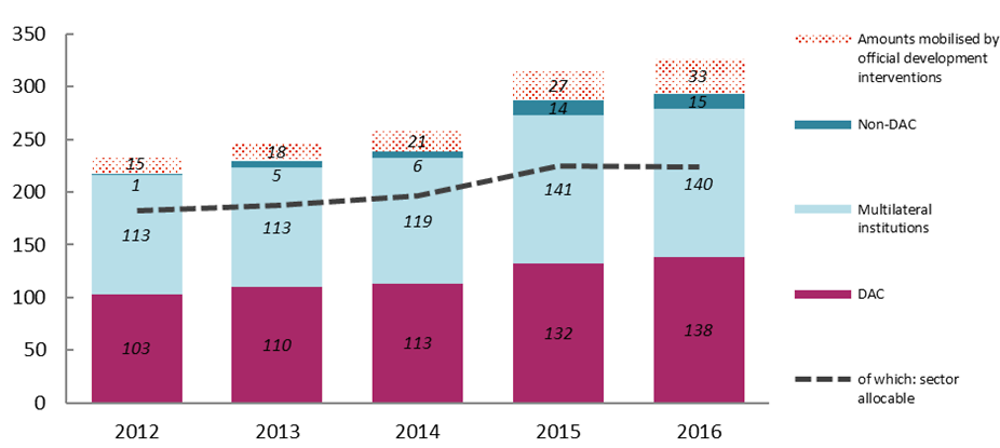
In 2016, ODF by bilateral and multilateral providers of development co-operation amounted to USD 293.6 billion, which represented a growth of 35% between 2012 and 2016 in real terms (Figure 3.1). Of this increase, 64% was support provided by bilateral providers (46% from DAC providers and 18% from non-DAC providers) and 36% was support provided by multilateral institutions. Overall, ODF grew at an average rate of 7.8% per year over this period in real terms.
Note: DAC are countries members of the Development Assistance Committee of the Organisation for Economic Co-operation and Development (OECD). European Union (EU) Institutions are also a DAC member, but are part of the multilateral institutions group in this publication.
Source: (OECD, 2018[2]), “International development statistics (database)”, http://www.oecd.org/dac/financing-sustainable-development/development-finance-data/idsonline.htm and (OECD, 2016[3]), “OECD DAC survey on amounts mobilised from the private sector by official development finance interventions 2012-2015”, http://www.oecd.org/development/stats/mobilisation.htm. Amounts of private finance mobilised are estimated for 2016.
There has also been a slight trend towards bilateralism in recent years. While the breakdown between bilateral and multilateral providers was slightly in favour of multilateral institutions five years ago (with a 52%-48% split), the breakdown is now the exact opposite with bilateral providers representing 52% of ODF in 2016.
Non-DAC providers are taking a growing place, though still modest according to OECD statistics, in the global concert of development finance
As highlighted in Chapter 2, while the DAC already covers funding by a large number of providers of development finance, there are still significant data gaps in the available information on ODF by sector, particularly from major Asian providers.
However, the number of providers that do publish official information on development finance, including by sector, keeps increasing. For example, the number of providers who are not members of the DAC, reporting to the OECD Creditor Reporting System, has increased from two in 2012 to twenty in 2016 – a substantial increase. In total, they provided an estimated USD 15 billion to developing countries in 2016. The overall evolution in ODF during the period 2012-16 reveals an increase in developmental flows coming from providers beyond the DAC community and particularly from Arab countries. This is a result, in part, of a better coverage of information reported by this group of providers (Figure 3.1). In 2016, 89% of ODF coming from non-DAC providers actually came from just three countries:
-
the United Arab Emirates, which was ranked as the first provider of official development assistance (ODA) per capita in 20164
-
Kuwait, which would feature in 2016 as the 14th biggest provider to the DAC – in sector-allocable terms – if it had been a full member of the Committee
-
Turkey, which was the second biggest provider of humanitarian aid in 2016, mainly providing assistance to the Syrian Arab Republic.
The trend of having more and more Arab countries providing information on development finance is likely to continue (See Section 3.2.1), which may also have a significant impact on the sector financing landscape in the coming years. For example, the OECD is currently working with Qatar and Saudi Arabia to include activity-level development co-operation flows in its statistical system.
Recent investments in the refugee crisis reduce the share of ODA allocated to sectors in developing countries
The share of aid that can be allocated by sector in OECD statistics is called sector-allocable aid (See Box 3.1). Overall sector-allocable aid is following a similar positive trend as ODF (Figure 3.1), showing sustained efforts by the provider community to report well by sector on its development finance. However, the share of sector-allocable aid against overall ODF has been showing signs of a decline over the last five years (Table 3.1). This is a result of the increase in humanitarian- and refugee-related costs, which are, by definition, not sector allocable. In 2016, in-donor5 refugee costs represented 8% of ODA while in 2012 it represented 2.5%. The increase of in-donor refugee costs reduces the share of development finance that can be analysed by sector. Preliminary estimates for 2017 for DAC countries, show an improving picture. ODA spent by donor countries on hosting refugees fell by 13.6% to USD 14.2 billion as refugee arrivals, mainly in Europe, decreased. In-donor refugee costs were 9.7% of total net ODA, down from 11% in 2016. Stripping out in-donor refugee costs, net ODA was up 1.1% from 2016 in real terms (OECD, 2018[4]).
In DAC statistics, while most contributions can be directly allocated to a given sector (e.g. education and infrastructure), some contributions are not susceptible to allocation by sector and are, therefore, reported as “non-sector allocable”. These are:
-
commodity aid and general programme assistance (e.g. general budget support and general food aid)
-
actions related to debt (e.g. debt forgiveness and debt rescheduling)
-
humanitarian aid (e.g. emergency response)
-
in-donor costs (e.g. administrative costs and refugee costs)
-
other unallocated costs (e.g. development awareness financing).
Source: (OECD, 2018[5]), "Converged statistical reporting directives for the CRS and the annual DAC questionnaire - Addendum 1 - Annexes - modules A, B, and C", https://one.oecd.org/document/ DCD/DAC/STAT(2018)9/ADD1/FINAL /en/pdf.
3.1.2. Providers’ sector financing strategies are very stable over time with clear patterns between bilateral and multilateral providers
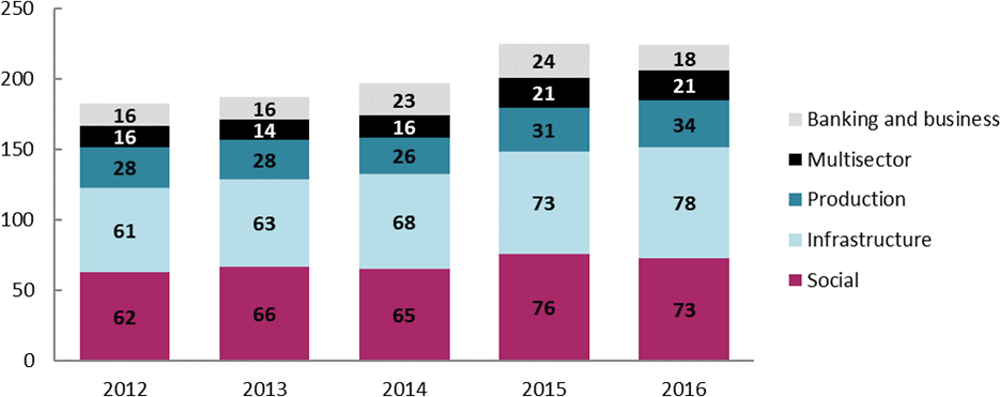
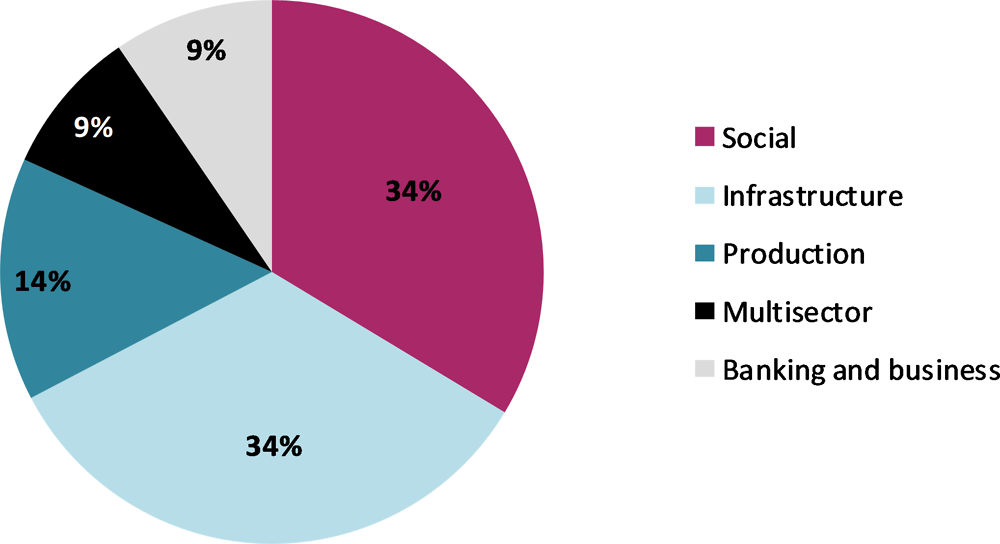
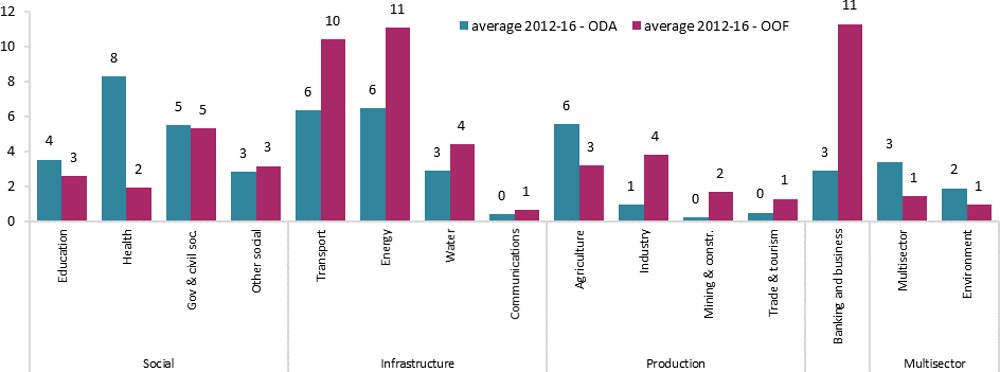
The breakdown of ODF across broad sector groupings (Figure 3.2) has not changed much in the last five years despite the recent growth in ODF. This reflects the high stability of sector allocation policies by official providers. ODF to broad sector groupings is broken down into three tiers, with “social sectors” and “infrastructure” representing two-thirds (34%, on average, over the period for each of the two groupings). The last third is broken down among the production sectors (14% of ODF on average), with “banking and business” and “multisector” activities representing approximately 9% of ODF over the period 2012-16 (Figure 3.3).
Source: (OECD, 2018[2]), “International development statistics (database)”, http://www.oecd.org/dac/financing-sustainable-development/development-finance-data/idsonline.htm.
Source: (OECD, 2018[2]), “International development statistics (database)”, http://www.oecd.org/dac/financing-sustainable-development/development-finance-data/idsonline.htm.
Concessional flows concentrate on social sectors, but also fund sectors beyond these. Non-concessional financing is supporting “hard” sectors, such as infrastructure, but also “softer” ones, such as public financial management in middle-income countries.
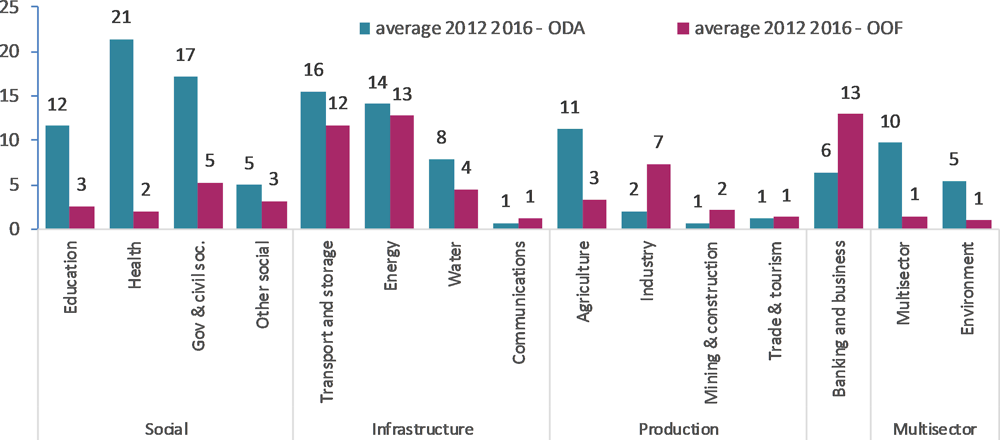
Figure 3.4 provides an overview of the allocation by individual sectors of both concessional and non-concessional official flows for the period 2012-16.
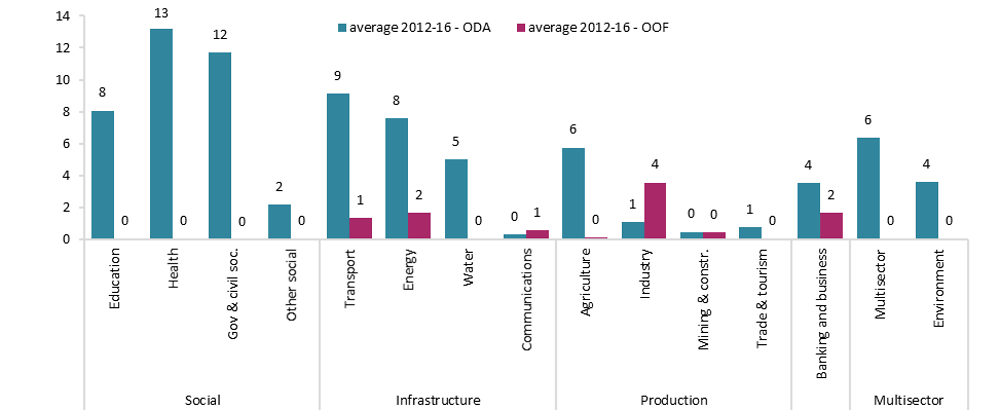
Social sectors and services (i.e. health, education, governance and civil society, and other social infrastructure and services) are mainly financed using official concessional flows. ODA represents 81% of the financing to these sectors. A noticeable exception to this trend is the financing of the “government and civil society” sector which is also funded through OOF for an average of USD 5.3 billion a year. This support corresponds, almost in its entirety, to operations by the International Bank of Reconstruction and Development, the Inter-American Development Bank (IADB) and the Asian Development Bank (AsDB) in support of activities in the areas of public finance and public policy management. In addition, it supports decentralisation processes, mostly in middle-income economies in Asia (e.g. Indonesia and Philippines) and Latin America (e.g. Brazil, Colombia and Mexico). Social sectors and services are the main destinations of ODA flows. These flows, which are close to USD 55 billion a year, accounted for 42% of total ODA to sectors, on average, during the period 2012-16.
Source: (OECD, 2018[2]), “International development statistics (database)”, http://www.oecd.org/dac/financing-sustainable-development/development-finance-data/idsonline.htm.
Infrastructure sectors (including transport and storage, energy and water and communications) are funded more through concessional than non-concessional resources; ODA accounts for 56% of total ODF to these sectors. Infrastructure is the second main destination of ODA flows, representing 29% of total ODA to these sectors. However, infrastructure remains, with 42% of the total OOF to sectors, the main sector of destination of OOF flows.
Production sectors are almost equally funded by concessional and non-concessional flows, with ODA representing 52% of ODF to these sectors.
The banking and business sectors are largely funded through non-concessional resources, showing a good use of scarce ODA resources in sectors that tend to generate financial returns on investments and, therefore, do not always need concessional resources.
3.1.3. Private finance is mobilised in sectors where business is traditionally active, but there seems to be untapped potential for mobilisation in some sectors
Providers increasingly mobilise private finance for development. Since 2012, amounts mobilised by official development interventions are estimated to have more than doubled from 15 billion in 2012 to an estimated 33 billion in 2016 (Figure 3.1).
From a sector perspective, the mobilisation of private finance takes place in many different sectors, but, unsurprisingly, in much bigger volumes in sectors where prospects of financial returns for the private sector are high. On average, for the period 2012-16, more than 80% of the total private finance mobilised occurred in four sectors: “banking and business”, “energy”, “industry” and “mining and construction” (Figure 3.5).
Source: (OECD, 2018[2]), “International development statistics (database)”, http://www.oecd.org/dac/financing-sustainable-development/development-finance-data/idsonline.htm and (OECD, 2016[3]), “OECD DAC survey on amounts mobilised from the private sector by official development finance interventions 2012-2015”, http://www.oecd.org/development/stats/mobilisation.htm.
Very little private finance is mobilised in social sectors (e.g. health, education or government and civil society), even though these sectors do present some potential to attract the private sector. This has been shown, for example, in Ghana where private sector involvement came in response to unmet local demand for quality education (World Bank Group, 2017[6]). Other sectors, where the potential for mobilising resources could be considered as high given the traditional involvement of the private sector, do not show a high level of private finance mobilised by official providers. This is, for example, the case in “water”, “agriculture” and the “transport and storage” sectors.
A first possible explanation for this potential lack of mobilisation in certain sectors may be related to the data currently available. The data collection on amounts mobilised from the private sector remains a fairly new exercise for providers, as it was only implemented in the DAC regular reporting in 20176. It is, therefore, likely that as providers get more experience, the comprehensiveness and accuracy of the data will significantly improve in future years. This is increasingly likely as data collection on private finance mobilised is now fully integrated in the yearly data collection process of the DAC. Reporting on amounts mobilised in 2018 (on 2017 flows) has improved as it includes the majority of development finance institutions’ and international finance institutions’ operations designed to mobilise private finance for development. Also, as highlighted in Chapter 2, the lack of data from some of the major emerging economies (such as the People’s Republic of China - hereafter “China” - and Brazil) also prevents drawing a comprehensive picture of the private finance mobilised for development purposes.
A second possible explanation is related to the fact that data collected on amounts mobilised only show the first sector of allocation. Therefore, funds allocated to the banking sector may well ultimately serve other sectors. This calls for a reflection on how to collect further information to improve sector analyses of the ultimate sector of financing. In that regard, “blockchain” technologies may be able to help in the future to track financial flows across sectors and institutions.
Another aspect is that the data in Figure 3.5 represent a baseline for future sector analyses. This is because providers have not yet had time to factor into their policies the AAAA, which is calling for the mobilisation of private resources. This only took place in 2015, towards the end of the period being studied in this publication. Data in future years should reflect the level of translation of political commitments taken in Addis into concrete increases in resource mobilisation.
Finally, from a policy perspective, the lack of resource mobilisation in certain sectors may indicate that providers need to step up their mobilisation efforts and systematically look into mobilising private finance in all sectors, including in the “transport and storage” or in the “water” sectors, as indicated above.
3.1.4. Providers indirectly contribute to sector financing by supporting domestic resource mobilisation, but data is missing on the magnitude of the amounts leveraged and the final destination of this financing in terms of sectors
Investing in domestic resource mobilisation is an excellent way to support sector financing. By helping to increase the tax base in developing countries, providers help them generate resources that can then be sovereignly allocated to priority sectors. This increases their autonomy and ownership over these funds. (See Box 3.2).
The Addis Tax Initiative (ATI), started by the governments of Germany, Netherlands, United Kingdom, and United States, is a multi-stakeholder partnership of development partners and partner countries. It was launched at the 3rd Financing for Development Conference in Addis Ababa in 2015. It aims to catalyse significant increases in domestic revenue and improve the transparency, fairness, effectiveness and efficiency of tax systems in partner countries. Since its launch in 2015, membership has grown to include 41 countries and 13 supporting organisations – a mix of philanthropic, regional and international organisations. Members of the Initiative have agreed to three overarching commitments. First, the ATI development partners commit to collectively doubling technical co-operation in the area of domestic revenue mobilisation by 2020. The objective is to reach, collectively, USD 223.76 million in gross disbursements and USD 237.96 million in commitments. Second, the ATI partner countries commit to stepping up the mobilisation of domestic revenues in order to spur development. Third, all ATI signatories commit to promoting and ensuring policy coherence for development.
Note: See also https://www.addistaxinitiative.net and https://www.taxcompact.net/index.htm. Source: Case study collected through the OECD DAC Survey on other official flows carried out in 2017 and the ATI (Addis Tax Initiative, 2017[7])
In 2016, DAC members’ disbursements in the area of domestic resource mobilisation represented about USD 348 million. These interventions can take many forms, including support to targeted policies or the improvement of local capacities in mobilising additional domestic resources.
In Paraguay for example, the rules on income tax and value added tax in the agricultural sector have been changed to encourage formalisation and increase tax collection in this sector. The introduction of the new agricultural income tax (IRAGRO) has been a success, recording in the first two and a half years (2014–2016) a tax-levy increase of 134.5% (Addis Tax Initiative, 2017[7])
Within a project on resource governance in West Africa, which has been implemented in Côte d’Ivoire, Guinea, Liberia, and Sierra Leone, the German Development Cooperation supported the installation of an inspection unit in Liberia’s tax administration that specialises in the mining sector. A tax audit on an iron ore producer resulted in an additional charge of USD 10,743,561.
Finally, in Zambia and the United Republic of Tanzania (hereafter, “Tanzania”), over several years in the field of tax audit of multinational companies, the Norwegian Agency for Development Cooperation made key contributions to two major court rulings in 2016. These concerned transfer pricing arrangements in the mining sector. In Zambia, the result was a tax reassessment of an additional USD 47 million while in Tanzania the tax reassessment was an additional USD 120 million.7
3.2. The global division of labour on sector financing
This section examines key systemic dimensions of the sector landscape that shape the overall analysis across sectors. It first looks at the global division of labour between bilateral and multilateral providers and the evolving landscape of actors, with new, emerging providers starting to reshape this landscape. It then provides a stock-taking of the overall distribution of concessional and non-concessional flows to developing countries between bilateral and multilateral providers. Finally, it dives into the specific analysis of cross-cutting approaches and takes the example of gender equality as a fundamental dimension to consider when analysing sector financing.
3.2.1. The sector division of labour between bilateral and multilateral providers
A global division of labour: bilateral providers tend to focus on social sectors while multilaterals’ portfolios target infrastructure as well as banking and business
Is there a global division of labour between bilateral and multilateral providers with regards to sectors? Considering that several bilateral providers (such as China, Brazil and India) do not, as yet, report data in a sufficiently granular way to enable analysis by sector, the current landscape provided in this section focuses on providers’ reporting to the OECD Creditor Reporting System (OECD CRS) (OECD, 2018[8]).
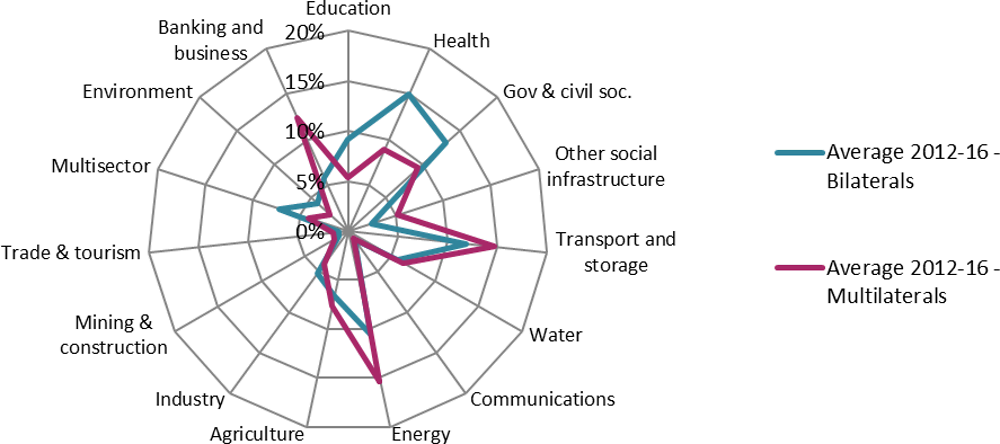
Overall, even if both types of provider – bilateral and multilateral – support all sector groupings, multilateral institutions tend to focus their portfolios on infrastructure and the banking and business sectors8, while bilateral providers rather favour social sectors (Figure 3.6).
During the period 2012-16, bilateral providers contributed, on average, USD 88 billion of sector-allocable ODF per year. Approximately 40% of their portfolios9 has been focused on the social sectors compared with 29% for multilaterals. In these social sectors, bilateral providers also tend to provide slightly higher volumes of assistance than multilaterals (USD 35.2 billion versus USD 33 billion).
Multilateral institutions have been the most prominent actors in the infrastructure sector with an average USD 42.6 billion of ODF, compared to only USD 25.8 billion from bilateral providers. Overall, infrastructure represents a higher share of the multilaterals’ portfolios (37%) versus the 29% share of the bilaterals’ portfolios. In other sector groupings, the “banking and business” sector remains a grouping where multilaterals have a greater presence both in volume (almost three times that of bilaterals) and share (more than twice that of bilaterals).
Source: (OECD, 2018[2]), “International development statistics (database)”, http://www.oecd.org/dac/financing-sustainable-development/development-finance-data/idsonline.htm.
High volumes of funding are provided by a limited number of providers in most sectors
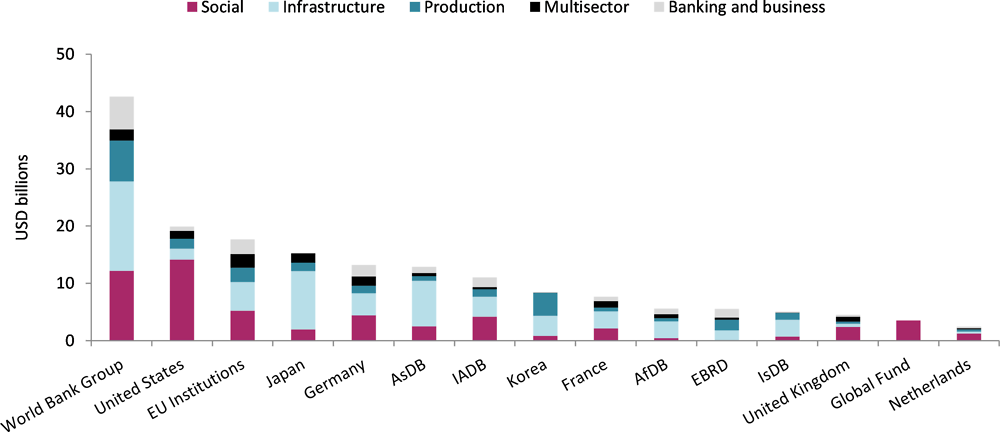
Looking at the main players in each sector grouping, the landscape of bilateral and multilateral providers reveals that major volumes of sector financing are concentrated among a very limited number of providers (Figure 3.7).
For infrastructure, the most salient aspect is the critical role played by a small group of bilateral providers: the United States, Japan, Germany, France and Korea, and six of the largest multilateral development banks (MDBs)10. The contributions of these donors together represent more than 84% of the total ODF to this sector – on average, USD 57.5 billion per year for the period 2012-16.
In the social sectors, the concentration also remains relatively high, with the United States and the World Bank being the most prominent players. Their contributions are almost equivalent to those of the other 13 providers in the list of the top 15 providers (around USD 26 billion, on average, during the period 2012-16). Together, the United States and the World Bank provide close to 40% of all funding to the social sectors. The top 10 providers11 contribute more than three-quarters (77%) of the total funding to these sectors.
In the banking and business sector, the World Bank Group is the biggest provider, representing 30% of all funding provided to this grouping. The six largest MDBs contribute 70% of all funding to this sector grouping.
Finally, the “production” sector grouping also reveals a high concentration of the number of partners. The top 10 providers12 account for 79.4% of the total funding to this sector grouping. Korea is the second largest provider to this sector with a contribution of close to USD 4 billion.
Note: AsDB includes ADB and the Asian Development Special Fund; IADB includes IADB, IADB Special funds and IDB Invest; and African Development Bank (AfDB) includes the AfDB and the African Development Fund.
Source: (OECD, 2018[2]), “International development statistics (database)”, http://www.oecd.org/dac/financing-sustainable-development/development-finance-data/idsonline.htm.
With sector information on major bilateral players beyond the DAC still missing, Arab providers position themselves as key sector actors
While information on the financial assistance provided by several key bilateral providers (e.g. China, India and Brazil) is still not disaggregated by sector, other providers have joined the OECD statistical system to report data by sector. By doing so, they make available their significant contributions across sectors.
For example, the United Arab Emirates is now one of the top ten bilateral providers in the production sectors and, together with Kuwait, is also among the top 10 providers for the infrastructure sector grouping. This trend of seeing Arab providers taking a stronger role in the bilateral sector landscape is likely to continue with new Arab providers gradually joining the OECD statistical system (see Table 3.2 and Box 3.3).
The DAC is looking for new approaches in the context of its renewed mandate. It could continue engaging in substantive policy discussions with the Arab community in, for example, the infrastructure or the productive sectors to compare approaches. This would build on the recent collaboration on sector-related issues, as it recently did on water and sanitation, and energy through the Arab-DAC Dialogue on Development.13
More broadly, all providers can take the opportunity to use sector analyses as a platform for strengthened policy dialogue. This would build on the recognition that providers often face the same types of challenges when looking at their sector focus and allocations (e.g. in which sector to invest and with which instruments).
Saudi Arabia is already reporting to the OECD on its development co-operation programme. It provides aggregate figures on development co-operation and humanitarian assistance by region, and multilateral aid and loan disbursements from, and repayments to the Saudi Fund for Development. Because Saudi Arabia reports at the aggregate level, its figures do not allow for a sector breakdown. Saudi Arabia started reporting at activity-level to the OECD in 2018 on 2016 and 2017 flows – the report was too late to include these data into the OECD annual publication of detailed data in December 2017. Saudi Arabia has, in the meantime, published its aid activities on the Saudi Aid Platform, a database which contains activity-level information on Saudi Arabia’s aid contributions (which cannot strictly be considered as ODA). Currently, the platform records developmental, humanitarian and charity projects for the period 1996-2018, amounting to over USD 85 billion, on average USD 3.7 billion per year. A majority of these projects target developing countries along DAC definitions. Saudi Arabia is also working to extend its platform back to the 1970s. The platform is based on the OECD CRS statistical criteria, which will ensure easy transfer to the OECD systems once these data are available. Saudi Arabia’s annual aid amounts, which are being reviewed by the OECD at the time of publishing this report, would position the country among the top 10 providers of the DAC membership on an ODF sector-allocable basis. Also, the country would feature in the top 10 in the broad sector grouping of “infrastructure” and “banking and business”. Contributions by the country could help provide a better picture on those individual sectors where Saudi Arabia is most active – transport, banking and financial services, agriculture, water and sanitation, and education.
Source: (Saudi Arabia, 2018[9]) “Saudi Aid Platform” https://data.ksrelief.org/en/home.aspx, accessed on 04 September 2018.
Official providers may also want to join forces with actors beyond the official sphere that have specific experience in a given sector. In the health sector, providers could, for example, ensure a systematic exchange of experiences with the Bill & Melinda Gates Foundation (BMGF) or its local implementation partners. With USD 2.246 billion of funding to this sector, on average, for the period 2012-16, the BMGF is now the third largest provider to the health and reproductive health sectors. It is a custodian of in-depth experience in this area that can potentially benefit many bilateral and multilateral actors involved in this field (See also Chapter 2).
3.2.2. A very different use of concessional and non-concessional financing to sectors by bilateral and multilateral agencies
Bilateral agencies still very much use ODA as a source of financing for almost all sectors, but this may be because of a lack of reporting on other official flows. This calls for improved reporting on these types of flows.
Patterns of funding for bilateral providers (Figure 3.8) indicate that these still rely very much on ODA as a primary source of financing for almost all sectors. Multilateral agencies, in contrast, mostly use non-concessional lending (about 22% more than ODA flows), usefully complementing funding by bilateral providers.
The differences in patterns between bilateral and multilateral providers may be a consequence of the data currently available on other official flows for bilateral providers, which are still unevenly reported by this group (Ahmad and Nichols, 2017[10])). Another possibility is that bilateral providers refrain from using non-concessional lending in countries that are in potential debt distress (See Chapter 4). Finally, this difference in pattern may represent an opportunity for bilateral providers to further investigate the possibilities of providing non-concessional financing in certain countries. This could be, for example, in social sectors, where current data shows that multilateral agencies provide significant amounts of non-concessional financing (Figure 3.9).
Source: (OECD, 2018[2]), “International development statistics (database)”, http://www.oecd.org/dac/financing-sustainable-development/development-finance-data/idsonline.htm.
Source: (OECD, 2018[2]), “International development statistics (database)”, http://www.oecd.org/dac/financing-sustainable-development/development-finance-data/idsonline.htm.
3.2.3. Integration of cross-cutting approaches is still limited despite their importance in the new agenda
The section below focuses on gender equality as an example to illustrate how providers face challenges in integrating cross-cutting issues in their development agendas. Similar examples could be used with other cross-cutting issues, such as environmental sustainability.
Providers need to do much more to make their sector operations gender focused in most sectors
Gender equality is at the heart of sustainable development. The centrality of gender-related issues has been recognised in the 2030 Agenda through SDG 5 (“Achieve gender equality and empower all women and girls”). As such, it is both a standalone goal and an integral part of achieving other goals. Gender equality is also highlighted as a key dimension in the 3rd International Conference on Financing for Development14. A specific Addis Ababa Action Plan for Transformative Financing for Gender Equality and Women’s Empowerment15 was launched in July 2015.
Promoting gender equality is not just a moral imperative, it is an economic one, as there is wide evidence of a correlation between gender equality and economic performance (McKinsey Global Institute, 2015[11]) (World Economic Forum, 2014[12]). Gender equality, therefore, needs to be implemented as a key dimension across all economic and social sectors, including with targeted action and financing.
The OECD DAC, as part of its statistical reporting, has established a “marker system” that tracks the extent to which a given developmental activity responds to specific key policy objectives. The marker system facilitates monitoring and a comparison of members’ activities in support of policy objectives related to environment, trade development, participatory development/good governance, reproductive health, as well as gender equality and women’s empowerment (See Chapter 2). An activity is considered to be gender focused if the gender equality objective is marked as “principal” or “significant” (See Box 3.4).
The OECD tracks aid in support of gender equality and women’s empowerment using the DAC gender equality policy marker. This is a qualitative statistical tool to record aid activities that target gender equality as a policy objective. The gender equality policy marker is used by DAC members as part of the annual reporting of their aid activities to the DAC. It indicates for each aid activity whether it targets gender equality as a policy objective. The gender equality policy marker is based on a three-point scoring system:
-
Principal (marked 2) means that gender equality is the main objective of the project/programme and is fundamental to its design and expected results. The project/programme would not have been undertaken without this objective.
-
Significant (marked 1) means that gender equality is an important and deliberate objective, but not the principal reason for undertaking the project/programme.
-
Not targeted (marked 0) means that the project/programme has been screened against the gender marker, but has not been found to target gender equality.
Data based on the marker provide a measure of aid that DAC members allocate in support of gender equality. In practice, the data allows derivation of key information related to gender equality financing. This includes a snapshot of:
-
individual gender equality focused projects/programmes
-
a global estimate of aid committed for gender equality
-
the proportion of DAC members’ aid focused on achieving gender equality and women’s empowerment
-
the sectors prioritised for gender equality focused aid
-
the investments within the individual sectors
-
the countries prioritised for gender equality focused aid.
Source: (DAC GENDERNET, December 2016[13]), "Handbook on the OECD DAC Gender Equality Policy Marker", www.oecd.org/dac/gender-development/Handbook-OECD-DAC-Gender-Equality-Policy-Marker.pdf and (OECD,(n.d.)[14]), "The DAC gender equality policy marker", http://www.oecd.org/dac/gender-development/dac-gender-equality-marker.htm (accessed on 5 September 2018).
While funding for programmes integrating gender equality as a significant objective has increased over time, aid with gender equality as a principal objective lags behind
During the period 2012-16, on average, USD 30.4 billion per year was targeted for gender equality as either a significant or principal objective. This represented 36% of bilateral allocable aid. However, only 4.9% of aid targeted gender equality as a principal objective. As such, while funding for programmes integrating gender equality as a significant objective has increased over time, aid with gender equality as a principal objective lags behind. The DAC Network on Gender Equality (GENDERNET) recommends that donors increase their support for dedicated programmes supporting gender equality and women’s empowerment as a principal objective. This would respond to their commitments in the Agenda 2030 for Sustainable Development (DAC GENDERNET, 2018[15]).
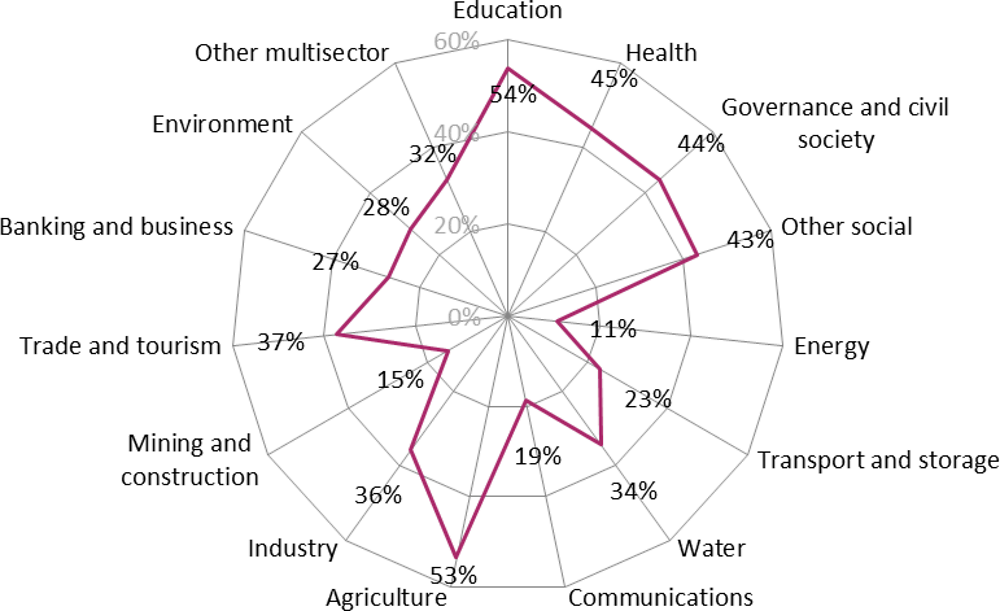
In terms of sector distribution (Figure 3.10), there is a wide disparity across sectors in terms of the gender focus of activities, but social sectors are those where the volumes of financing for gender activities are generally the highest. Gender-focused funding in social sectors, such as education, health and government, represented USD 16.8 billion of the USD 30.4 billion (55% of the total) per year in 2012-16. The shares of gender volumes also confirm that social sectors (education, health, government and civil society, and other social infrastructure and services) have generally more gender-equality focused aid than other sectors (Figure 3.11). On average, 46% of the aid is gender equality focused for those activities that are screened against the gender marker in the social sectors.
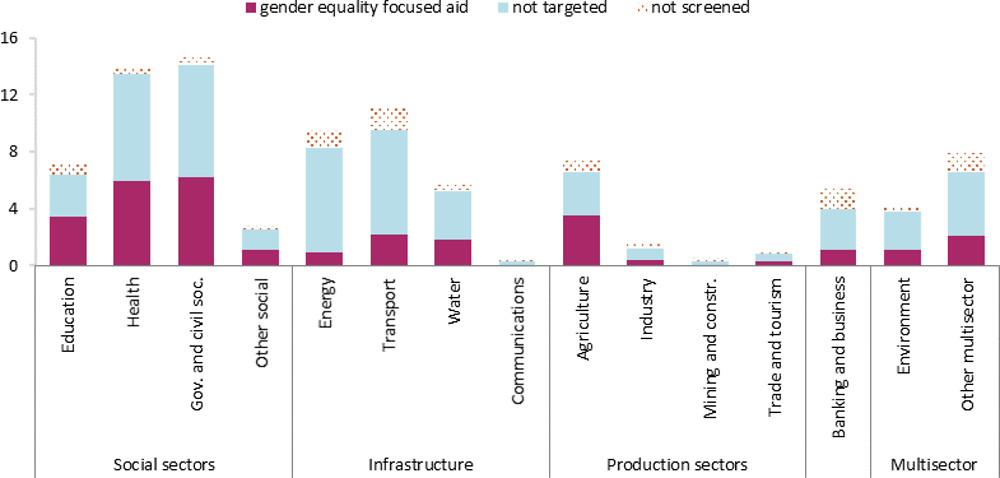
Note: Gender equality focused aid comprises projects marked as 1 or 2 by donors in the DAC statistical system.
Source: (OECD, 2018[2]), “International development statistics (database)”, http://www.oecd.org/dac/financing-sustainable-development/development-finance-data/idsonline.htm.
It is critical that women’s participation is supported in programmes in the productive sectors. While agriculture seems to largely consider gender inequality (with 53% of screened activities having a gender equality focus in 2012-16), other productive sectors do not have a strong focus on gender equality. This shows the important work that still needs to be done to allow women to fully participate in all sectors of the economy.
Several sectors do not take into account gender inequality well enough. Only 21 % of aid allocated to the infrastructure sector grouping and 27% of aid to the banking and business sector are gender equality focused. The banking and business sector seems a particular area for progress, where a large amount of aid (25%) is not even screened for gender equality.16
Source: (OECD, 2018[2]), “International development statistics (database)”, http://www.oecd.org/dac/financing-sustainable-development/development-finance-data/idsonline.htm.
3.3. The sector implications of an integrated and global development agenda
Following the presentation of the overall picture of ODF by sector in this chapter, the analysis in this section concentrates on the sector implications of the current development agenda. It provides some recommendations on strategic approaches for development co-operation providers to align sector strategies with the SDGs.
3.3.1. An integrated and global development agenda calls into question siloed sector approaches
The SDGs create an integrated and complex development framework that goes beyond sectors. SDG integration into providers’ development co-operation strategies requires increased attention from them to policy coherence across sectors. Moreover, with this new agenda, addressing systemic issues is becoming increasingly important, presenting both challenges and opportunities for development progress in many sectors, particularly in countries most in need.
The 2030 Agenda points to the importance of policy coherence across sectors and can be a powerful driver towards more sustainable production and consumption models
The SDGs provide a highly integrated and interconnected framework, integrating the three dimensions of economic, social and environmental development. The interconnection of social, environmental and economic dimensions is reflected in the list of SDG targets, which creates a dense web of ‘nexuses’ across goals (see Figure 3.12). Nexuses are “clusters of issues that are linked in such a way that interventions focusing on one issue are highly likely to have positive or negative impacts on other issues within the nexus” (Jungcurt, 2016[16]). Given the networked configuration of the SDGs, the achievement of one goal can be consistent, reinforced or constrained by the achievement of other goals (Nilsson, Griggs and Visbek, 2016[17]). For instance, increasing electricity access (SDG 7) reinforces irrigation for food production (SDG 2). However, energy options are constrained by the need to provide clean energy, which is embedded in SDG 7 itself. Also, it is a requirement for achieving SDG 12 on responsible production and consumption and SDG 13 on climate change. Despite some goals being more related to one of these three dimensions, they are often all embedded within each goal, making the framework deeply interconnected. For instance, while the main aim of SDG 8 may seem to pursue primarily an economic objective as it aims to promote employment and economic growth, social and environmental dimensions are embedded within this goal as several targets explicitly integrate social dimensions (e.g. gender equality and decent work) or sustainability (e.g. energy efficiency).
The analysis of the network of SDG targets reveals that cross-cutting and thematic SDGs with economic dimensions, such as sustainable production and consumption (SDG 12), inequality (SDG 10), poverty (SDG 1) and growth and employment (SDG 8), are those with more links with other SDGs (Le Blanc, 2015[18]). This finding is not surprising given the wide scope of these goals and the widely recognised impact of economic growth on enabling or constraining development. It shows the importance of looking at the linkages between sectors in order to reduce trade-offs and harness synergies.
Achieving policy coherence across sectors and goals with economic dimensions offers the opportunity to redesign economic, environmental and social systems in a way that is sustainable, inclusive and prosperous. In particular, advancements in science, technology and innovation (STI) can boost development progress across sectors if designed in a way that promotes sustainability and inclusion, especially in banking, production and infrastructure. For instance, technological progress can be a powerful driver for green transformation as it increases the viability of low-carbon infrastructure, energy efficiency, value chain optimisation and sustainable agriculture [ (Altenburg and Assmann, 2017[19]); (OECD, 2016[3]; OECD, 2016[3])]. Similarly, mobile technologies offer the opportunity to promote financial inclusion by offering poor people financial services previously inaccessible. This is shown by the development of mobile money transfer systems that are helping many poor people, including women, escape poverty and graduate from subsistence agriculture to small business (Suri and Jack, 2016[20]). These examples show that the development impact for various SDGs can be boosted by leveraging on development enablers (e.g. STI and finance) and by mainstreaming cross-cutting issues in specific sectors (e.g. gender and environment).
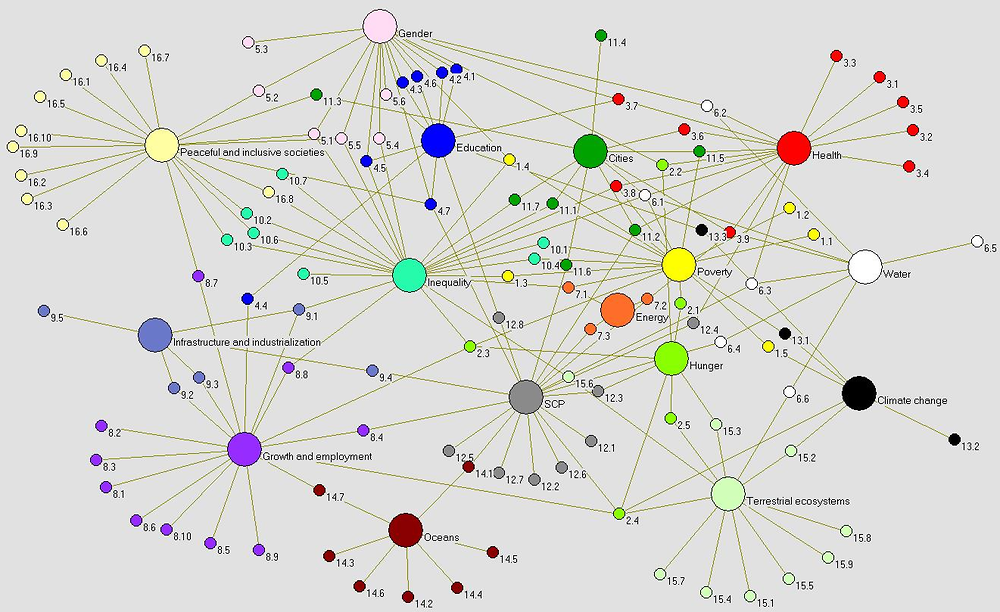
Source: (Le Blanc, 2015[18]), “Towards integration at last? The sustainable development goals as a network of targets”, http://www.un.org/esa/desa/papers/2015/wp141_2015.pdf.
A number of global trends and challenges affect all countries, particularly the least developed and most fragile contexts across many sectors
A number of major global trends are significantly affecting the capacity of developing countries to achieve the SDGs across sectors. Resource-intensive growth, waste and climate warming are affecting, for example, SDG 12 on responsible production and consumption, SDG 15 on preserving natural ecosystems. They are hindering efforts towards achieving SDG 2 on food security and SDG 6 on water security, or SDG 1 on poverty eradication and SDG 3 on health. Demographic growth and urbanisation are also making urban planning and migration flows more difficult to manage [ (United Nations, 2015[21]); (UN-Habitat, 2016[22])], thwarting, for example, efforts towards SDG 8 on full employment and decent work or SDG 11 on inclusive, safe and sustainable cities. Similarly, progress made in robotics and automation presents unprecedented opportunities, but also major social risks, such as job insecurity for low-skilled workers and labour polarisation [ (UNCTAD, 2016[23]); (World Bank, 2016[24])] This progress also affects SDG 8 on full employment and decent work and SDG 10 on reduced inequality.
While global trends can compromise development achievements everywhere, they are more compelling in developing countries, given their higher vulnerability to shocks, crises and disasters. Global challenges, such as conflicts, pandemics, environmental disasters and knock-on shocks from price changes, trade and monetary policies or financial crises occurring outside developing countries [ (UNHCR, 2017[25]); (ILO and UNDP, 2017[26]); (Kreft, Eckstein and Melchior, 2016[27])] tend to affect developing countries more than advanced economies.
Systemic adversity has a stronger effect in the most fragile contexts. It is becoming increasingly evident that in countries with weak institutions and higher exposure to risk, poverty is more entrenched – for both low- and middle-income countries – societies are more violent, and the effects of shocks and disasters of any kind are more severe (OECD, 2016[28]). For instance, environmental shocks and disasters more frequently and severely affect least developed countries (LDCs) and small island developing states (SIDS), which are more constrained in anticipating and responding to these events, putting 26 million people into poverty every year [ (IMF, 2017[29]); (Hallegatte et al., 2017[30])]. Another example is the volatility of global food prices, which increased after 2010 and put an additional 44 million people in extreme poverty – as poorer people spend a high proportion of their incomes on food (UNCTAD, 2017[31]). Vulnerability to systemic issues can partly explain why, despite the remarkable development progress overall in developing countries, development progress is stagnant in sub-Saharan Africa, where two-thirds of fragile contexts are located (OECD, 2018[32]). Two-thirds of the extreme poor live in fragile contexts and this share could increase to more than 80% by 2035 (see Figure 3.13). This will be a consequence of the high rate of demographic growth among poor people in sub-Saharan Africa, particularly Nigeria, Democratic Republic of the Congo, Tanzania and Madagascar (OECD, 2018[32]).
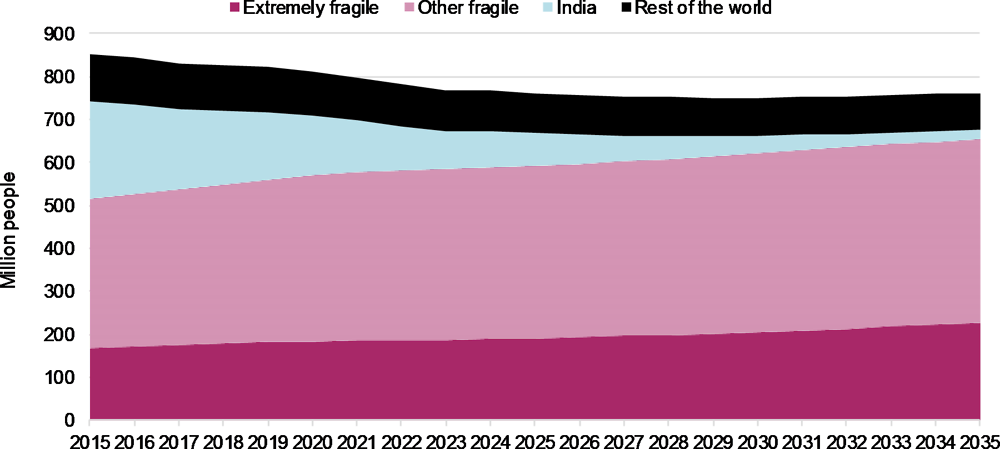
Note: Calculation by the authors using the list of fragile contexts from (OECD, 2018[32]). Fragile contexts include both low- and middle-income countries.
Source: (International Futures, n.d.[33]), Projections from the International Futures’ database, www.ifs.du.edu/ifs/frm_MainMenu.asp.
Other than monetary poverty, about 1.6 billion people in the world still experience multidimensional deprivations, including lack of access to energy, education, healthcare or safe drinking water. This is particularly so for women, children, rural inhabitants and farmers (ILO and UNDP, 2017[26]). Again, LDCs and fragile contexts, particularly in sub-Saharan Africa, are those with lower socio-economic conditions (see Figure 3.14). Given the above, ensuring that no countries are left behind will require not only supporting specific sectors, but also increasing resilience against adverse systemic issues in the most vulnerable contexts by reinforcing institutions and addressing the root causes of fragility.
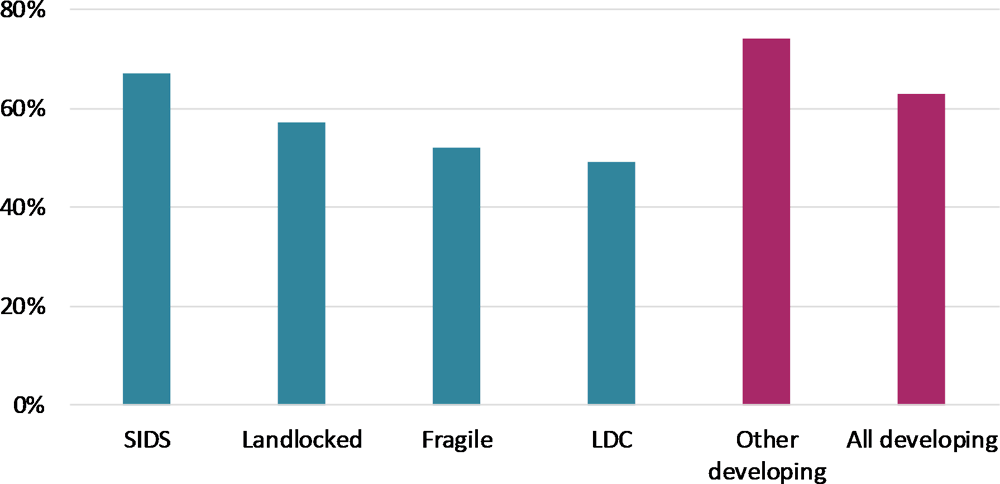
Note: 0% is the lowest score for human development and 100% the highest. Data analysis is based on 2015 data.
Source: Calculated by the authors using NDP’s Human Development Index data (2015), http://hdr.undp.org/sites/default/files/2015_human_development_report.pdf.
3.3.2. Holistic approaches are needed to achieve an integrated development agenda
The new multifaceted agenda of the SDGs, the increasing importance of policy coherence and the many systemic issues across sectors that developing countries are facing call for holistic approaches. However, designing such approaches may be challenging for development co-operation providers, which traditionally have looked at their interventions using sectors or specific policy areas as a way to structure their development interventions. Recognising that a perfect match between SDGs and sectors is difficult to achieve, the alignment of development partners’ interventions with the SDG agenda requires aligning the intended results of their strategies, programmes and interventions with the SDG targets, and then monitoring and evaluating their contribution to these.
There is no ‘one-size-fits-all’ policy configuration to match SDGs and sectors
As highlighted in Chapter 2, it is extremely challenging to find a perfect match between sectors and SDGs. The majority of SDGs are very broad and cross-cutting (e.g. SDG 1 on poverty and SDG 10 on reducing inequality) as well as densely interlinked (see Figure 3.12). Thus, it would be unrealistic to design a one-size-fits-all policy or sector configurations to achieve all goals. This absence of a straightforward correspondence between sectors and SDGs makes programme design more challenging for policy makers and development partners. This is especially so as they have traditionally designed their interventions around sectors or policy areas rather than results. In fact, a recent survey carried out by the DAC secretariat of DAC members and some multilateral agencies shows that the programmatic complexity of the SDGs is a major challenge to aligning development co-operation portfolios with the 2030 Agenda.
Aiming for a one-size-fits-all framework for designing sector financing strategies would also go somewhat against the spirit of the 2030 agenda. While the SDGs are rather prescriptive in terms of the necessity to pay special attention to prioritising some groups of countries (e.g. LDCs) or groups of people (e.g. women and children), large discretion is left to policy makers as to how to achieve the goals. For instance, a contribution to SDG 4 on education could be supported through direct investment in education (e.g. building schools and training teachers). Or it could be supported by increasing access to electricity in rural areas (SDG 7) to enable children to study during the evening.
Supporting traditional sectors is one among several approaches to achieving the SDGs
Support for traditional sectors is only one among several strategies and approaches for development partners to carry out development co-operation. In particular, development partners can contribute to the development agenda by supporting global public goods (GPGs). At the country level, development partners can complement their country sector approaches with other strategies using themes rather than sectors (e.g. private sector development) or by supporting cross-cutting approaches (e.g. gender equality) (Figure 3.15).
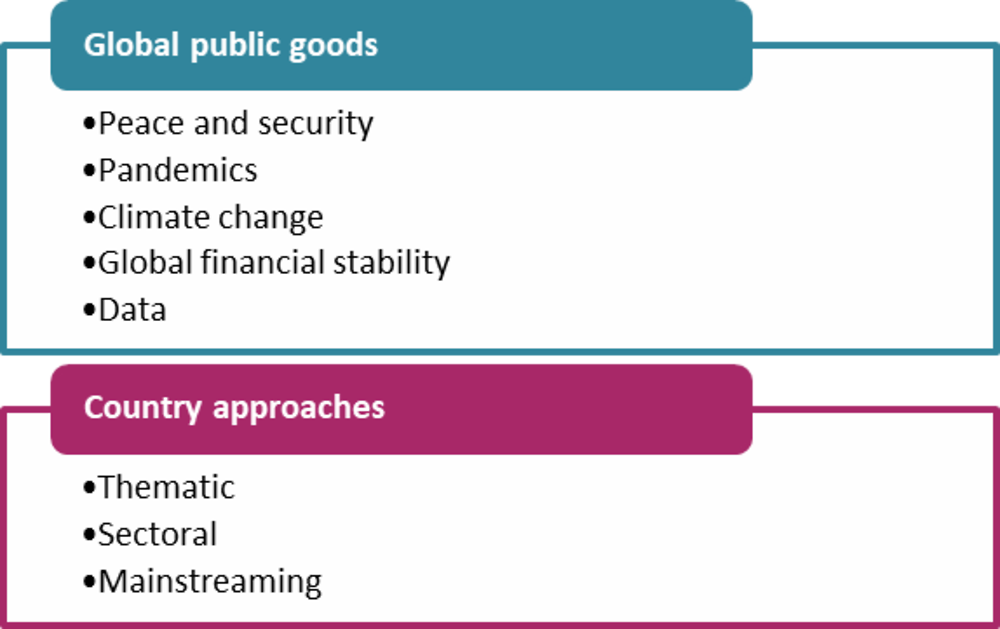
Source: Authors
GPGs are institutions, mechanisms and outcomes that provide quasi-universal benefits, covering more than one group of countries and several population groups (Kaul, Grunberg and Stern, 1999[34]). While bilateral providers contribute a lot to GPGs by setting up global programmes, initiatives and funds as part of their bilateral co-operation programmes, the provision of GPGs is more often associated with the work of multilateral organisations, civil society organisations (CSOs) and research institutes. Such institutions facilitate programme implementation, global standard-setting, monitoring of international agreements, data provision and research on areas such as peace and security, global financial stability, climate change and global pandemics.
Country programmes, in contrast, are designed to promote social, environmental and economic development in one country through sector, thematic or mainstreaming approaches:
-
Sector programmes are provided to enhance the availability and the quality of social services, infrastructure and production systems. Sector programmes include policy and institutional development, the development of hard infrastructure, the provision of financial resources, and technical assistance to people and companies in various sectors and policy areas. This support includes, for instance, providing a loan to build a power plant, supporting a policy reform in the health sector or building the capacity of small-holder farmers.
-
Thematic programmes use multiple sectors or policy areas to achieve economic and human development. For instance, private sector development (PSD) strategies and programmes, seek to improve the investment climate and productive capacity of developing countries in view of achieving economic growth and poverty reduction (Miyamoto and Chiofalo, 2017[35]). PSD strategies include supporting a variety of traditional sectors, including infrastructure, public governance, banking, and services and manufacturing. Similarly, broad thematic strategies, such as social protection and urban and rural development, also need interventions across a variety of sectors.
-
Mainstreaming involves integrating cross-cutting issues, such as environment, gender equality, food security, human rights and social protection, into traditional sector projects or other thematic projects thus achieving multiple objectives simultaneously. Such projects are illustrated by the PSD work of the Department of Foreign Affairs and Trade in Pakistan, the Department for International Development (DFID) in Nigeria and the EU in Liberia. Such PSD projects specifically target poor people, women or food security thus mainstreaming poverty, gender equality and food security into PSD programming. Another way of mainstreaming is by adopting social and environmental safeguards. These are measures and guidelines preventing the occurrence of environmental and social damage in donor-funded projects.
Aligning development finance with the SDGs requires harmonising the objectives of sector and thematic programmes with the SDG targets prioritised by partner countries
The flexible and cross-cutting nature of development goals, the variety of country contexts and the different capacities and comparative advantages of development partners, call for differentiated approaches in SDG implementation. This requires moving from portfolio-based programmes to result-based approaches where sector and thematic programmes are organically designed, monitored and evaluated with the objective to fill SDG gaps in developing countries. For this reason, ex-ante analysis is needed to design strategies and programmes that contribute to the achievement of SDG targets as prioritised by partner countries, and to develop monitoring and evaluation systems to track progress and learn from experience.
In practice, strategic and programmatic design and implementation requires:
-
prioritising areas that align with developing countries’ needs and priorities
-
developing sector and thematic country programmes that align the objectives and results expected with SDG targets
-
monitoring and evaluating results using frameworks that are aligned with the SDGs (see Figure 3.16).
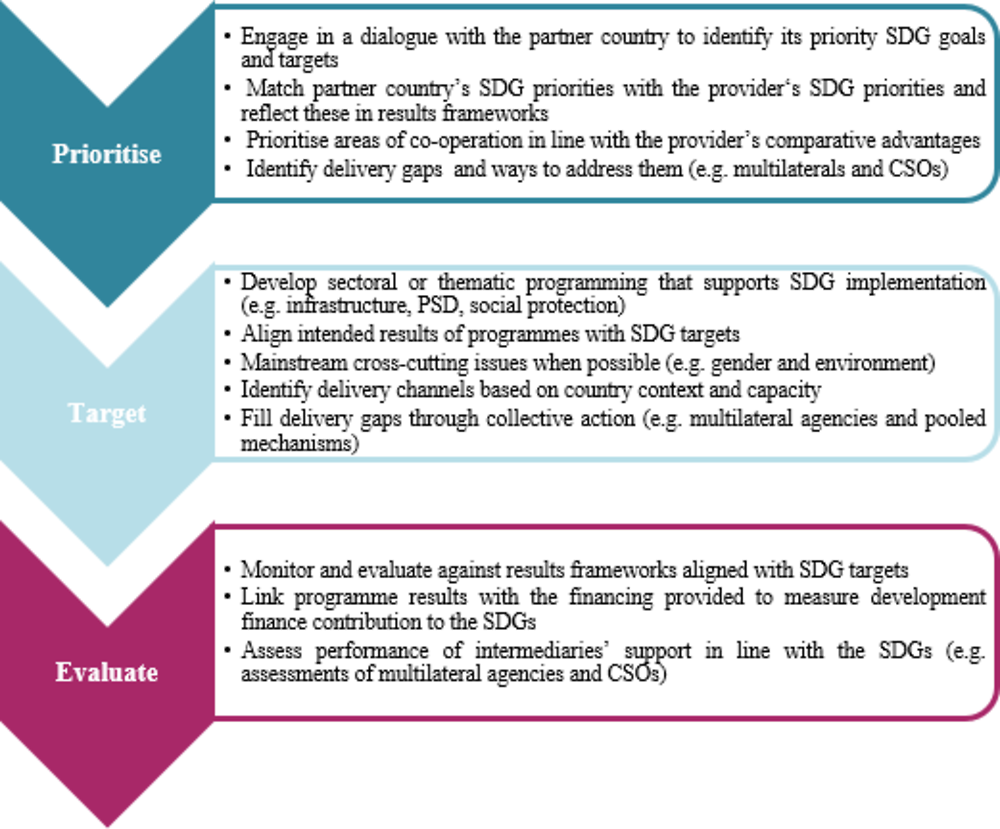
Source: Authors
OECD research shows that building on SDG-linked results frameworks to inform strategic and programmatic design and implementation can promote effective development co-operation in terms of: accountability, communication, strategic direction and learning for providers, recipients and the whole development co-operation community (Engberg-Pedersen and Zwart, 2018[36]).
While the need to promote results-based design and implementation of development co-operation is more important now than ever, efforts among development partners to align strategies, programmes and portfolios with the SDGs are still anecdotal and at an early stage. Overall, bilateral and multilateral development partners are trying to support the 2030 Agenda by:
-
aligning their policies and operational strategies with the SDGs
-
designing and implementing programmes and projects that mainstream cross-cutting development issues
-
creating indicators and monitoring tools to track their alignment with the SDGs
-
carrying out research and analysis to monitor the state of advancement on the 2030 Agenda.
In terms of strategies, multilateral organisations are in the lead. In particular, the United Nations Development System (UNDS) is carrying out a ‘whole-of-group’ repositioning reform to better deliver on the 2030 Agenda. The World Bank Group has aligned its institutional structure by creating ‘global practices’ that are closely linked with some SDGs. Moreover, both the UNDS and the World Bank are carrying out research on SDG-relevant issues and are increasing co-operation to build on their respective comparative advantages, especially in fragile contexts. For bilateral development partners, Canada has, for example, recently adopted a development co-operation policy that puts gender equality at the centre of all Canada’s efforts, although the implementation of the policy is still in the early stages of implementation.
In terms of mainstreaming cross-cutting issues in programmes and projects, both bilateral and multilateral development partners are contributing to these efforts – although much remains to be done. For example, while bilateral and multilateral development partners have increased resources for sector programmes/projects integrating gender or climate objectives, the volumes of financing represent, on average, small shares (10%-20%) of their total contributions [see e.g. (OECD, 2018[37]); (OECD, 2017[38])]. One explanation for this trend is that policy integration of cross-cutting issues in sector and thematic interventions/programmers is hard to design and implement. Evidence from peer reviews of DAC members shows that cross-cutting and integrated approaches need appropriate financing, policy commitment and technical capacity to be successful (OECD, 2014[39]). A review of the most recent DAC peer reviews shows that DAC members’ effectiveness in integrating cross-cutting issues into their strategy and programmes is mixed. Some donors lack the capacity and resources to translate cross-cutting strategies into programmes [ (OECD, 2015[40]); (OECD, 2015[41])] or do not provide appropriate funding or guidance to achieve these objectives [ (OECD, 2018[42]); (OECD, 2017[43]); (OECD, 2017[44]); (OECD, 2017[45])]. Other donors, generally of larger size, seem to address cross-cutting issues, thematically or across projects, more robustly [ (OECD, 2016[46]); (OECD, 2016[47]); (OECD, 2015[48]); (OECD, 2014[49])]. As an example, Denmark uses the human rights-based approach to mainstream poverty both at the strategic level and at the project level, through human rights assessments that put poverty at the centre of programming (OECD, 2016[50]).
Finally, in terms of results measurement, development partners are already using indicators that closely match the SDG indicators for those SDGs that relate to specific areas. More efforts are needed for SDGs that are broad and cross-cutting. For example, a comparative analysis by (Engberg-Pedersen and Zwart, 2018[36]) shows that there is already a strong link between the standard indicators used by eight major bilateral and multilateral development partners17 and the related SDG targets and indicators. This strong link however occurs in “traditional” human development areas (i.e. SDGs 2, 3 and 6) and energy (SDG 7) more than in the broad cross-cutting areas such as gender equality (SDG 5), decent work and economic growth (SDG 8), and inequality (SDG 10). Ensuring that SDG-aligned results are communicated properly through appropriate narratives will be essential for learning and for generating political support for development co-operation (Engberg-Pedersen and Zwart, 2018[36]).
3.3.3. A cross-cutting and mostly unfunded development agenda points to the importance of both quantity and quality of financing
A cross-cutting and mostly unfunded development agenda points to the importance of both the quantity and quality of financing. In particular, financing needs depend not only on the volumes required to achieve specific development objectives, but also on the individual capacity of a country to mobilise resources and the potential of each sector to attract additional resources. Moreover, sufficient resources need to be provided for both output-based and system-wide approaches across sectors.
Financing volumes required to achieve the SDGs are only one dimension to take into account if the international community wishes to leave no one behind across sectors
Getting financing strategies right will be indispensable to meeting the integrated SDG financing needs in developing countries. The amounts involved are between USD 3 and 4 trillion a year, and are mostly unfunded (UNCTAD, 2014[51]). This comprehensive, integrated and mostly unfunded development agenda points to the importance of both the quantity of financing and the appropriate targeting of this financing. This means:
-
mobilising sufficient financing volumes
-
ensuring a balanced targeting of resources (sector/thematic areas, country allocation, types of beneficiaries, types of instrument and concessionality levels, channel of implementation, etc.)
-
focusing on impact (short- and long-term results, public and private mobilisation effects, alignment with local needs, integration of cross-cutting issues, etc.).
Moreover, beyond filling gaps amounting to USD trillion, the SDGs call for leaving no one behind. This suggests that while the international community has a common development agenda, countries and people have different capacities to mobilise the necessary human and financial resources to this end. For example, compared to infrastructure and productive sectors, it is more difficult to mobilise private finance in social sectors. This requires rethinking the way financing needs and priorities are measured and communicated, going beyond business-as-usual support for economic growth as the main proxy.
In this respect, focusing too much on the financing needs shifts the attention towards sectors and countries that have more opportunities to be financed (such as infrastructure and production sectors in large and more advanced middle-income countries) given that the volume of financing needs is linked to the size of gross domestic product (GDP) and growth rates. However, large or more industrialised economies have more financing opportunities beyond the mobilisation of funds from development partners. They can more easily tap into capital markets for example. They also usually benefit from better investment climates, which increase opportunities for domestic and foreign investment in any sector [ (OECD, 2015[52]); (Inderst and Stewart, 2014[53]); (Sagasti and Prada, 2012[54])].
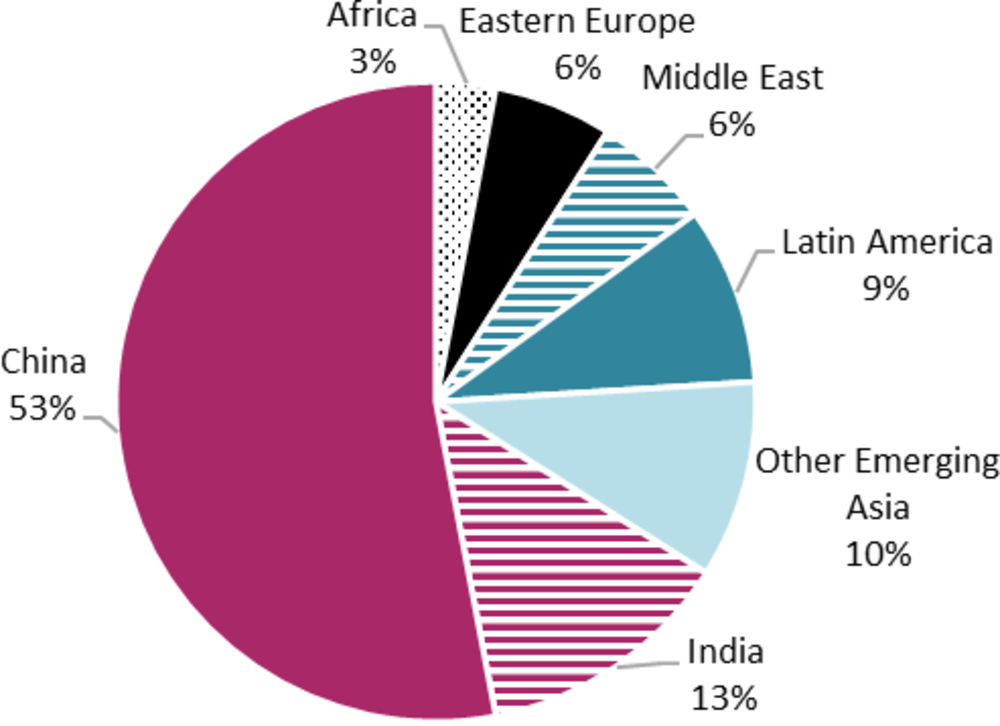
For example, high-levels of GDP (including because of a large population size), sustained economic growth and a high level of industrialisation can explain why China and India make up the biggest share of financing needs for infrastructure, in volume terms, in developing countries (see Figure 3.17). Conversely, African countries, especially sub-Saharan ones, which are generally smaller economies and are less industrialised, account for a very small share. However, China and India have by far the best quality of infrastructure among developing countries, whereas sub-Saharan countries have the lowest, which suggests that the latter need infrastructure more than the former (Donaubauer, Meyer and Nunnenkamp, 2014[55]). Moreover, China and India also have various alternatives through which to finance their infrastructure beyond development partners. This makes the case of supporting sub-Saharan countries more compelling.
Achieving an integrated development agenda will also require transformational development in the more advanced economies, particularly to foster positive spill-overs from the richest to the poorest countries. For instance, while, overall, large emerging countries have more opportunities to finance infrastructure and production sectors on their own, development finance will still be needed to promote the green transition in these countries, as more advanced developing economies are among the largest contributors to climate change, which affects significantly the poorest countries. Therefore, bilateral and multilateral development partners should continue supporting infrastructure in these economies. But they need to do so by promoting low-carbon and climate-resilient technologies. This requires a major shift in the structure of bilateral and multilateral development partners’ portfolios as green finance constitutes a small portion of their total support for infrastructure [see (OECD, 2017[56]); (Miyamoto and Chiofalo, 2015[57])].
Source: Estimates based on (McKinsey, 2017[58]), "Bridging Infrastructure Gaps: Has the World Made Progress?" https://www.mckinsey.com/industries/capital-projects-and-infrastructure/our-insights/bridging-infrastructure-gaps-has-the-world-made-progress.
Finally, recognising that opportunities to mobilise private resources for development vary greatly across sectors, development partners need to co-ordinate to ensure a balanced distribution of resources across sectors to achieve all the SDGs. As shown in Figure 3.18, sectors presenting clear business opportunities (e.g. information and communications technology, energy and agriculture) attract more private investment than those traditionally serviced by the public sector (e.g. health and education). This despite there being clear business opportunities also in these sectors where private provision of services is common. Moreover, while financing gaps in sectors with more reduced commercial opportunities are lower, in terms of volumes, the share of the financing gap is generally the highest. This shows that small amounts can be more difficult to mobilise in these areas than in those with the largest commercial opportunities. Beyond commercial opportunities, the decision of public and private service delivery across sectors is affected by national policy approaches. These are influenced by the cultural, economic and social characteristics of each country. This shows that bilateral and multilateral development partners need to ensure that sufficient resources are provided both for sectors that present business opportunities and those that support non-commercial initiatives, such as public sector and/or CSO projects, particularly in social sectors.
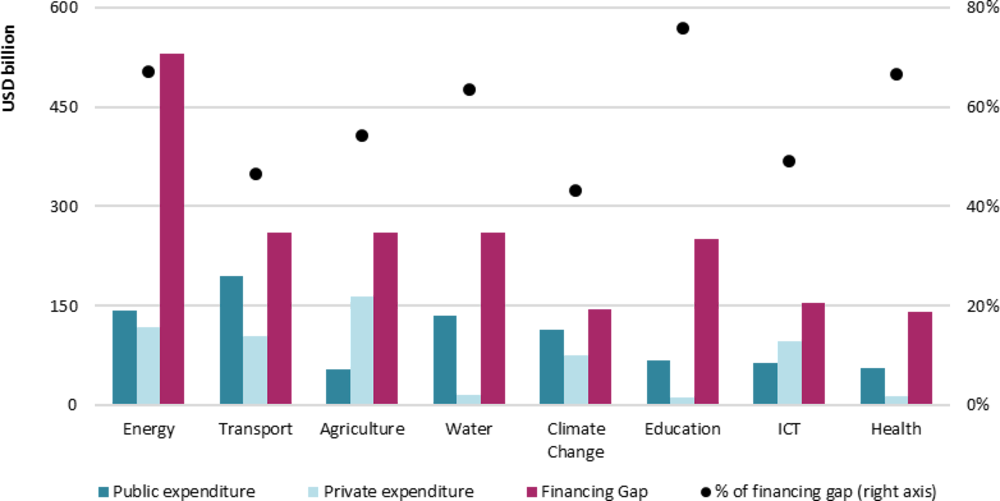
Note: Health and education needs include investment in infrastructure only. Climate change includes both mitigation and adaptation.
Source: Authors’ calculations based on (UNCTAD, 2014[51]), "World Investment Report 2014: Investing in the SDGs, an Action Plan", http://unctad.org/en/PublicationsLibrary/wir2014_en.pdf.
There is a need to balance support between institutional development and output-based projects
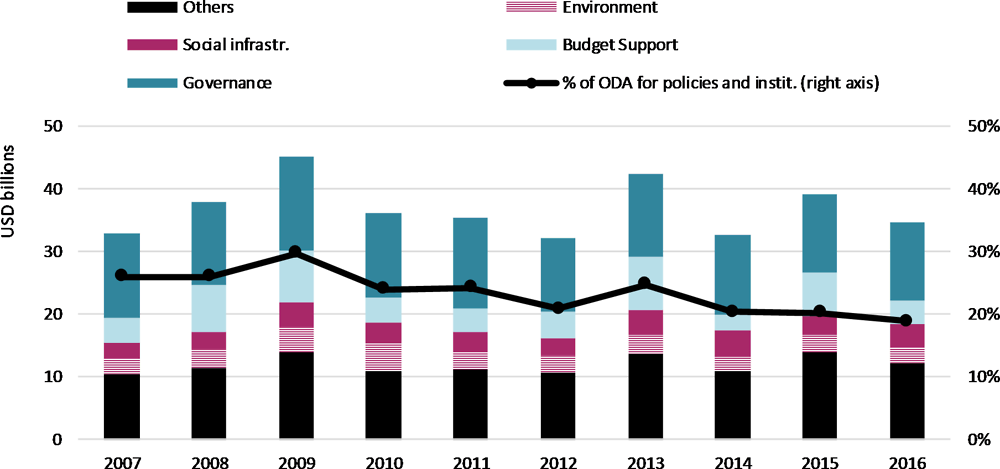
Despite the importance of addressing systemic issues and institutions, as explained above, development finance for policy and institutional development is declining. As shown in Figure 3.19, concessional support for these types of operations declined from almost a third of the total concessional finance from bilateral and multilateral development partners in 2009 to less than a quarter in 2016. Concessional support for these types of projects shows the increasing preference of donors for projects that deliver tangible outputs in specific sectors, e.g. power plants, vaccines and cash transfers, rather than long-term and system-wide approaches, such as policy and institutional development. This can be explained by the fact that as ODA providers are increasingly called to justify their ODA expenditures, there is an incentive to support programmes that:
-
deliver tangible results in the short term
-
ensure control of resources
-
have performance, outputs and immediate outcomes that can easily be measured.
Conversely, system-wide approaches are less attractive for development finance providers because of the:
-
mixed performance of public financial management in some partner countries
-
reduced control of resources
-
intrinsic difficulty of measuring the development results of capacity building and technical assistance.
Note: Only codes related to policy and institutional development have been selected. See Annex for a full list of codes selected.
Source: (OECD, 2018[2]), “International development statistics (database)”, http://www.oecd.org/dac/financing-sustainable-development/development-finance-data/idsonline.htm.
Nevertheless, achieving a systemic development agenda will require balancing the support between these two types of programmes. As noted, development challenges are becoming increasingly entrenched in countries with lower institutional capacity and high vulnerability to shocks, conflicts and disasters. Supporting country-led frameworks that promote long-lasting development pathways in both the creation of domestic economic growth and the provision of social services, such as health and education, will be essential (see Chapter 5). Given the reduced business case for policy and institutional support, concessional finance needs to be preserved for these types of interventions. In particular countries need help to build institutional resilience against the adverse effects of systemic issues through domestic revenue mobilisation, disaster risk reduction and debt management. In addition, they need to promote technological, institutional and policy innovation across sectors.
With expenditures for humanitarian purposes increasing significantly, using ODA to address the root causes of fragility in the most vulnerable countries represents a strategic investment
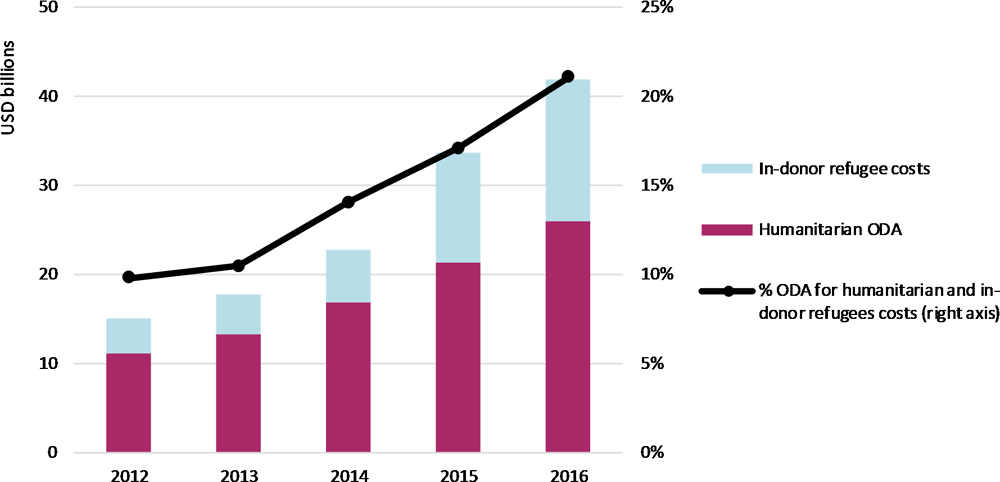
Addressing the root causes of fragility will be crucial for both developing countries and donors. Expenses for humanitarian crises are increasing significantly and are shifting resources that otherwise could be used for development purposes. Specifically, bilateral and multilateral support for humanitarian assistance, both in developing countries and in donor countries, doubled from USD 14 billion in 2012 to USD 35 billion in 2016 (see Figure 3.20). In 2016, a fifth of concessional resources from bilateral and multilateral partners reporting to the DAC were used for humanitarian purposes, up from a tenth in 2012. Comparatively, the share of ODA for sector-allocable projects decreased in the same period from 79% to 68%, showing that a growing portion of ODA is financing emergency crises rather than development projects. Geopolitical tensions and conflicts are rising and affecting the most vulnerable countries. There are also growing populations in sub-Saharan Africa, where most of the countries in fragile contexts are located. Therefore, there is a need to increase support in developing countries for promoting peaceful, inclusive and sustainable development, including by building the resilience of country governments and promoting local development that reduces the needs for humanitarian support.
Source: (OECD, 2018[2]), “International development statistics (database)”, http://www.oecd.org/dac/financing-sustainable-development/development-finance-data/idsonline.htm.
A cross-sector and transformative development agenda requires financial resources to be balanced between country programmes and GPGs
In an increasingly globalised and interconnected society, in-country development progress is more and more dependent on the existence of an enabling environment for development. This means ensuring the provision of GPGs, such as global financial stability or peace and security. Despite the lack of definition of what constitutes GPGs, estimates of concessional financing for these activities are between USD 12 billion and USD 14 billion per year. This is mainly for peacekeeping and peace-building operations; data and research; and selected normative functions [ (Birdsall and Diofasi, 2015[59]); (Development Initiatives, 2016[60])]. This figure does not include country financing for sectoral and thematic programmes with global spillovers, such as climate and health programmes. UN normative functions have been estimated at USD 5-6 billion a year, although the number is contested (Jenks and Topping, 2017[61]).
Funding to GPGs represents relatively small amounts compared to broader ODF (see Figure 3.1 in Section 3.1.1), probably because of a resistance to finance activities that have a universal benefit rather than a specific scope (Birdsall and Diofasi, 2015[59]). In a world comprising sovereign states, no single country can fully recover the benefit of its own spending for GPGs, which means low political returns on financing and incentives for inaction [ (Kaul, 2012[62]); (Birdsall and Diofasi, 2015[59])]. Moreover, since GPGs are mainly funded through the multilateral system and since multilateral finance is increasingly earmarked, funding of GPGs faces important issues of lack of continuity and high transaction costs (Morris and Atansah, 2017[63]).
The inherent tendency to underfund GPGs by single sovereign states calls for collective action through the multilateral system. Going forward, it is necessary to ensure a clear division of labour based on the respective expertise of multilateral organisations in providing GPGs. Moreover, it will be necessary to find mechanisms that pool resources from a variety of actors (public and private, national and international) to raise funding for these functions that is adequate in volumes, predictability and flexibility. The current reform of the UN system offers the opportunity to reinforce its normative functions. Another example is the proposal to harness the World Bank’s international development agency’ reflows by setting apart a USD 10 billion window for GPG-related support (Morris and Atansah, 2017[63]). This would include support for grant finance and subsidies for GPG-related loans. Finally, current efforts by the international community to develop the total official support for sustainable development (TOSSD) framework (See Chapter 2) will also shed light on and, hopefully, provide incentives for increased funding to GPGs in the coming years.
References
[7] Addis Tax Initiative (2017), "ATI Monitoring Report 2015", International Tac Compact, Bonn, Germany, http://www.addistaxinitiative.net/documents/Addis-Tax-Initiative_Monitoring-Report_2015_EN.pdf.
[10] Ahmad, Y. and A. Nichols (2017), "CRS reporting issues in 2016", OECD, Paris, http://www.oecd.org/officialdocuments/publicdisplaydocumentpdf/?cote=DCD/DAC/STAT(2017)15&docLanguage=En.
[74] AIIB et al. (2017), "Joint MDB Statement of Ambitions for Crowding in Private Finance", https://www.bundesfinanzministerium.de/Content/DE/Downloads/G20-Dokumente/Hamburg_Genannte_Berichte/Joint-MDB-Statement-of-Ambitions.pdf?__blob=publicationFile&v=1.
[19] Altenburg, T. and C. Assmann (2017), "Green Industrial Policy. Concept, Policies, Country Experiences", UN Environment; German Development Institute / Deutsches Institut für Entwicklungspolitk (DIE), http://wedocs.unep.org/bitstream/handle/20.500.11822/22277/Green_industrial_policy.pdf?sequence=1&isAllowed=y.
[59] Birdsall, N. and A. Diofasi (2015), "Global Public Goods for Development: How Much and What For", https://www.cgdev.org/sites/default/files/CGD-Note-Birdsall-Diofasi-Global-Public-Goods-How-Much.pdf.
[15] DAC GENDERNET (2018), "Aid to gender equality and women’s empowerment: An Overview", OECD, Paris, https://www.oecd.org/dac/gender-development/Aid-to-gender-overview-2018.pdf.
[84] DAC GENDERNET (2018), "How Does Aid Support Women’s Economic Empowerment?", OECD, Paris, http://www.oecd.org/dac/gender-development/How-Does-Aid-Support-Womens-Economic-Empowerment.pdf.
[13] DAC GENDERNET (December 2016), "Handbook on the OECD DAC Gender Equality Policy Marker", OECD, Paris, http://www.oecd.org/dac/gender-development/Handbook-OECD-DAC-Gender-Equality-Policy-Marker.pdf.
[66] Delalande, G. and V. Gaveau (2018), "Senegal's perspective on TOSSD", OECD Development Working Papers, No 43, OECD Publishing, Paris.
[60] Development Initiatives (2016), "Measuring Aid to Global Public Goods (GPGs): An approach to estimating funding for GPGs from providers of official development assistance", http://devinit.org/wp-content/uploads/2016/07/Measuring-aid-to-global-public-goods-GPGs-Discussion-paper-July-2016.pdf.
[55] Donaubauer, J., B. Meyer and P. Nunnenkamp (2014), "A New Global Index of Infrastructure: Construction, Rankings and Applications", https://www.ifw-members.ifw-kiel.de/publications/a-new-global-index-of-infrastructure-construction-rankings-and-applications/KWP_1929.pdf.
[75] EDFI (2016), "Investing to Create Jobs, Boost Growth and Fight Poverty", https://www.deginvest.de/DEG-Documents-in-English/Download-Center/EDFI-Flagship-Report-2016.pdf.
[36] Engberg-Pedersen, P. and R. Zwart (2018), “The 2030 Agenda and Development Co-operation Results”, OECD Development Policy Papers, No. 9, OECD Publishing, Paris, https://doi.org/10.1787/2f391534-en.
[76] G20 (2017), "Principles of MDBs’ strategy for crowding-in Private Sector Finance for growth and sustainable development", http://www.bundesfinanzministerium.de/Content/DE/Downloads/G20-Dokumente/principles-on-crowding-in-private-sector-finance-april-20.pdf?__blob=publicationFile&v=2.
[30] Hallegatte, S. et al. (2017), "Unbreakable : Building the Resilience of the Poor in the Face of Natural Disasters", World Bank, https://openknowledge.worldbank.org/handle/10986/25335.
[77] IADB (2017), "Comparative Study of Equity Investing in Development Finance Institutions", Inter-American Development Bank, https://publications.iadb.org/bitstream/handle/11319/8207/Comparative-Study-of-Equity-Investing-in-Development-Finance-Institutions.pdf?sequence=8.
[26] ILO and UNDP (2017), "2017 HLPF Thematic Review of SDG 1: End Poverty in All its Forms Everywhere", ILO, Geneva and UNDP, New York, NY., https://sustainabledevelopment.un.org/content/documents/14379SDG1format-final_OD.pdf.
[83] IMF (2018), "Macroeconomic Development and Prospects in Low-Income Developing Countries (2018)", International Monetary Fund, http://www.imf.org/en/Publications/Policy-Papers/Issues/2018/03/22/pp021518macroeconomic-developments-and-prospects-in-lidcs.
[29] IMF (2017), "World Economic Outlook: Seeking Sustainable Growth", IMF, Washington, DC, USA, http://www.imf.org/en/Publications/WEO/Issues/2017/09/19/world-economic-outlook-october-2017#Chapter%203.
[79] IMF/World Bank (2012), "Revisiting the Debt Sustainability Framework for Low-Income Countries", International Monetary Fund and World Bank, Washington, DC, USA, http://www.imf.org/external/np/pp/eng/2012/011212.pdf.
[53] Inderst, G. and F. Stewart (2014), "Institutional investment in infrastructure in emerging markets and developing countries", World, Bank, Washington, DC, USA., http://documents.worldbank.org/curated/en/238121468325297049/pdf/WPS6780.pdf.
[33] International Futures (n.d.), IFs Modelling System, Version 7.31, University of Denver, Denver, CO, USA, http://www.ifs.du.edu/ifs/frm_MainMenu.aspx (accessed on 11 September 2018).
[61] Jenks, B. and J. Topping (2017), Financing the UN Development System, Dag Hammarskjold Foundation, Upsala, Sweden, http://www.daghammarskjold.se/wp-content/uploads/2017/09/Financing-Report-2017_Interactive.pdf.
[82] Julks, A. and H. Kawamura (2017), "Global context for achieving the 2030 Agenda for Sustainable Development: International financial flows and external debt", United Nations Department of Economic and Social Affairs, https://www.un.org/development/desa/dpad/wp-content/uploads/sites/45/publication/dsp_policy_10.pdf.
[16] Jungcurt, S. (2016), "Towards Integrated Implementation: Tools for Understanding Linkages and Developing Strategies for Policy Coherence", International Institute for Sustainable Development, Winnipeg, Canada, http://sdg.iisd.org/commentary/policy-briefs/towards-integrated-implementation-tools-for-understanding-linkages-and-developing-strategies-for-policy-coherence/ (accessed on 26 April 2018).
[62] Kaul, I. (2012), “Global Public Goods: Explaining their Underprovision”, Journal of International Economic Law, Vol. 15/3, pp. 729–750, https://doi.org/10.1093/jiel/jgs034.
[34] Kaul, I., I. Grunberg and M. Stern (1999), "Global Public Goods", Oxford University Press, Oxford, UK.
[27] Kreft, S., D. Eckstein and L. Melchior (2016), "Global Climate Risk Index 2017: Who Suffers Most From Extreme Weather Events? Weather-related Loss Events in 2015 and 1996 to 2015", United Nations Office for the Coordination of Humanitarian Affairs, New York, NY, USA and Geneva, Switzerland, https://reliefweb.int/sites/reliefweb.int/files/resources/16411.pdf.
[18] Le Blanc, D. (2015), Towards integration at last? The sustainable development goals as a network of targets, United Nations Department of Social and Economic Affairs, New York, NY, USA, http://www.un.org/esa/desa/papers/2015/wp141_2015.pdf.
[58] McKinsey (2017), "Bridging Infrastructure Gaps: Has The World Made Progress?", McKinsey and Company, Washington, DC, USA, https://www.mckinsey.com/industries/capital-projects-and-infrastructure/our-insights/bridging-infrastructure-gaps-has-the-world-made-progres.
[11] McKinsey Global Institute (2015), "The Power of Parity: how advancing women's equality can add $12 trillion to global growth", https://www.mckinsey.com/featured-insights/employment-and-growth/how-advancing-womens-equality-can-add-12-trillion-to-global-growth.
[35] Miyamoto, K. and E. Chiofalo (2017), “Development Co-operation for Private Sector Development: Analytical Framework and Measuring Official Development Finance”, OECD Development Co-operation Working Papers, No. 32, OECD Publishing, Paris, https://doi.org/10.1787/ded2028f-en.
[57] Miyamoto, K. and E. Chiofalo (2015), “Official Development Finance for Infrastructure: Support by Multilateral and Bilateral Development Partners”, OECD Development Co-operation Working Papers, No. 25, OECD Publishing, Paris, https://doi.org/10.1787/5jrs3sbcrvzx-en.
[67] Mooney, H. and C. de Soyres (2017), Debt Sustainability Analyses for Low-Income Countries: An Assessment of Projection Performance, International Monetary Fund, Whashington, DC, USA, http://www.imf.org/~/media/Files/Publications/WP/2017/wp17220.ashx.
[63] Morris, S. and P. Atansah (2017), "Multilateral development banking for 21st century challenges: Addressing global public goods", Dag Hammarskjold Foundation, Upsala, Sweden, http://www.daghammarskjold.se/wp-content/uploads/2017/09/Financing-Report-2017_Interactive.pdf.
[17] Nilsson, M., D. Griggs and M. Visbek (2016), Policy: Map the interactions between Sustainable Development Goals, Vol. 534, Nature Publishing Group, London, pp.320-322, https://doi.org/10.1038/534320a.
[37] OECD (2018), "Aid to gender equality and women's empowerment", OECD, Paris, http://www.oecd.org/dac/gender-development/Aid-to-gender-overview-2018.pdf.
[5] OECD (2018), "Converged statistical reporting directives for the CRS and the annual DAC questionnaire - Addendum 1 - Annexes - modules A, B, and C", OECD, Paris, https://one.oecd.org/document/DCD/DAC/STAT(2018)9/ADD1/FINAL/en/pdf.
[2] OECD (2018), "International development statistics (database)", OECD, Paris, http://www.oecd.org/dac/financing-sustainable-development/development-finance-data/idsonline.htm.
[8] OECD (2018), “Creditor Reporting System”, OECD, Paris, https://stats.oecd.org/Index.aspx?DataSetCode=crs1.
[4] OECD (2018), Making Blended Finance Work for the Sustainable Development Goals, OECD Publishing, Paris, https://doi.org/10.1787/9789264288768-en.
[42] OECD (2018), OECD Development Co-operation Peer Reviews: Korea 2018, OECD Development Co-operation Peer Reviews, OECD Publishing, Paris, https://doi.org/10.1787/9789264288829-en.
[32] OECD (2018), States of Fragility 2018, OECD Publishing, Paris, https://doi.org/10.1787/9789264302075-en.
[81] OECD (2017), "2017 Report on the DAC Untying Recommendation", https://one.oecd.org/document/DCD/DAC(2017)6/FINAL/en/pdf.
[38] OECD (2017), "Climate-related development finance 2016", OECD, Paris, https://www.oecd.org/dac/financing-sustainable-development/development-finance-topics/Climate-related-development-finance-in-2016.pdf.
[68] OECD (2017), "Development Co-operation Report 2017: Data for Development", OECD Publishing, Paris, https://doi.org/10.1787/dcr-2017-en.
[64] OECD (2017), DAC High Level Communiqué: 31 October 2017, https://www.oecd.org/dac/DAC-HLM-2017-Communique.pdf.
[56] OECD (2017), Investing in Climate, Investing in Growth, OECD Publishing, Paris, https://doi.org/10.1787/9789264273528-en.
[43] OECD (2017), OECD Development Co-operation Peer Reviews: Finland 2017, OECD Development Co-operation Peer Reviews, OECD Publishing, Paris, https://doi.org/10.1787/9789264287235-en.
[45] OECD (2017), OECD Development Co-operation Peer Reviews: Luxembourg 2017, OECD Development Co-operation Peer Reviews, OECD Publishing, Paris, https://doi.org/10.1787/9789264284364-en.
[44] OECD (2017), OECD Development Co-operation Peer Reviews: The Netherlands 2017, OECD Development Co-operation Peer Reviews, OECD Publishing, Paris, https://doi.org/10.1787/9789264278363-en.
[3] OECD (2016), "OECD DAC survey on amounts mobilised from the private sector by official development finance interventions 2012-2015", http://www.oecd.org/development/stats/mobilisation.htm.
[50] OECD (2016), "OECD Development Co-operation Peer Reviews: Denmark 2016", OECD Development Co-operation Peer Reviews, OECD Publishing, Paris, https://doi.org/10.1787/9789264259362-en.
[70] OECD (2016), "OECD Development Co-operation Peer Reviews: Denmark 2016", OECD Development Co-operation Peer Reviews, OECD Publishing, Paris, https://doi.org/10.1787/9789264259362-en.
[69] OECD (2016), “Converged statistical reporting directives for the Creditor Reporting System (CRS) and the annual DAC questionnaire” - DCD/DAC(2016)3/FINAL, OECD, Paris, http://www.oecd.org/dac/financing-sustainable-development/development-finance-standards/DCDDAC(2016)3FINAL.pdf.
[65] OECD (2016), OECD Development Co-operation Peer Reviews: Denmark 2016, OECD Development Co-operation Peer Reviews, OECD Publishing, Paris, https://doi.org/10.1787/9789264259362-en.
[47] OECD (2016), OECD Development Co-operation Peer Reviews: Denmark 2016, OECD Development Co-operation Peer Reviews, OECD Publishing, Paris, https://doi.org/10.1787/9789264259362-en.
[46] OECD (2016), OECD Development Co-operation Peer Reviews: United States 2016, OECD Development Co-operation Peer Reviews, OECD Publishing, Paris, https://doi.org/10.1787/9789264266971-en.
[85] OECD (2016), Private Sector Engagement for Sustainable Development: Lessons from the DAC, OECD Publishing, Paris, https://doi.org/10.1787/9789264266889-en.
[28] OECD (2016), States of Fragility 2016: Understanding Violence, OECD Publishing, Paris, https://doi.org/10.1787/9789264267213-en.
[52] OECD (2015), Mapping Channels to Mobilise Institutional Investment in Sustainable Energy, Green Finance and Investment, OECD Publishing, Paris, https://doi.org/10.1787/9789264224582-en.
[86] OECD (2015), Multilateral Aid 2015: Better Partnerships for a Post-2015 World, OECD Publishing, Paris, https://doi.org/10.1787/9789264235212-en.
[41] OECD (2015), OECD Development Co-operation Peer Reviews: Belgium 2015, OECD Development Co-operation Peer Reviews, OECD Publishing, Paris, https://doi.org/10.1787/9789264239906-en.
[48] OECD (2015), OECD Development Co-operation Peer Reviews: Germany 2015, OECD Development Co-operation Peer Reviews, OECD Publishing, Paris, https://doi.org/10.1787/9789264246133-en.
[40] OECD (2015), OECD Development Co-operation Peer Reviews: Portugal 2016, OECD Development Co-operation Peer Reviews, OECD Publishing, Paris, https://doi.org/10.1787/9789264248571-en.
[39] OECD (2014), "Mainstreaming cross-cutting issues: 7 Lessons from DAC Peer Reviews", OECD, Paris, http://www.oecd.org/dac/peer-reviews/Final%20publication%20version%20of%20the%207%20Lessons%20mainstreaming%20cross%20cutting%20issues.pdf.
[49] OECD (2014), OECD Development Co-operation Peer Reviews: United Kingdom 2014, OECD Development Co-operation Peer Reviews, OECD Publishing, Paris, https://doi.org/10.1787/9789264226579-en.
[14] OECD((n.d.)), "The DAC gender equality policy marker", http://www.oecd.org/dac/gender-development/dac-gender-equality-marker.htm (accessed on 02 October 2018).
[80] Sachs, J. and G. Schmidt-Traub (2017), "Global Fund lessons for Sustainable Development Goals", Vol. 356/6333, American Academy for the Advancement of Science, Washington, DC, pp. 32-33, https://doi.org/10.1126/science.aai9380.
[54] Alonso, J. and J. Ocampo (eds.) (2012), The New Face of Development Co-operation: The Role of South-South Co-operation and Corporate Social Responsibility, Columbia University Press, New York, NY.
[9] Saudi Arabia (2018), "Saudi Aid Platform", Saudi Arabia, Riyadh, https://data.ksrelief.org/en/home.aspx.
[20] Suri, T. and W. Jack (2016), "The long-run poverty and gender impacts of mobile money", Vol. 354/6317, American Academy for the Advancement of Science, Washington, DC, https://doi.org/10.1126/science.aah5309.
[31] UNCTAD (2017), "Commodity dependence and the Sustainable Development Goals", United Nations Conference on Trade and Development, Geneva, http://unctad.org/meetings/en/SessionalDocuments/cimem2d37_en.pdf.
[23] UNCTAD (2016), "Robots and Industrialization in Developing Countries", United Nations Conference on Trade and Development, Geneva, http://unctad.org/en/PublicationsLibrary/presspb2016d6_en.pdf.
[71] UNCTAD (2016), "World Investment Report 2016 - Investor Nationality: Policy Challenges", United Nations Conference on Trade and Development, Geneva, http://unctad.org/en/PublicationsLibrary/wir2016_en.pdf.
[51] UNCTAD (2014), "World Investment Report 2014: Investing in the SDGs, an Action Plan", United Nations Conference on Trade and Development, Geneva, http://unctad.org/en/PublicationsLibrary/wir2014_en.pdf.
[22] UN-Habitat (2016), "Urbanization and Development: Emerging Futures", United Nations Human Settlements Programme, Nairobi, https://unhabitat.org/wp-content/uploads/2014/03/WCR-%20Full-Report-2016.pdf.
[25] UNHCR (2017), "Global Trends: Forced Displacement in 2016", United Nations Commissioner for Refugees, FilippoGrandi, http://www.unhcr.org/5943e8a34.pdf.
[1] United Nations (2015), "Addis Ababa Action Agenda of the Third International Conference on Financing for Development", UN, New York, NY, http://www.un.org/esa/ffd/wp-content/uploads/2015/08/AAAA_Outcome.pdf.
[72] United Nations (2015), "Transforming our world: the 2030 Agenda for Sustainable Development", UN, New York, NY, http://www.un.org/ga/search/view_doc.asp?symbol=A/RES/70/1&Lang=E.
[21] United Nations (2015), "World Population Prospects: The 2015 Revision, Key Findings and Advance Tables", UN, New York, NY, https://esa.un.org/unpd/wpp/publications/files/key_findings_wpp_2015.pdf.
[78] World Bank (2018), "Global Economic Prospects: Broad-Based Upturn, but for How Long?", http://www.worldbank.org/en/publication/global-economic-prospects.
[24] World Bank (2016), World Development Report 2016: Digital Dividends, World Bank, Washington, DC, http://documents.worldbank.org/curated/en/896971468194972881/pdf/102725-PUB-Replacement-PUBLIC.pdf.
[6] World Bank Group (2017), "Creating Markets in Ghana - Country Private Sector Diagnostic", World Bank, Washington, DC, https://www.ifc.org/wps/wcm/connect/ac42c20a-c82c-48b7-8432-221c0e066e2a/CPSD-Creating-Markets-in-Ghana-Nov-2017_v1.pdf?MOD=AJPERES.
[73] World Bank Group (2015), "Catalogue of the MDBs and the IMF Financing Solutions", http://www5.worldbank.org/mdgs/documents/MDBs-IMF-DevFin-Solutions-11-3-15.pdf.
[12] World Economic Forum (2014), "The Global Gender Gap Index 2014: the case for Gender Equality", http://reports.weforum.org/global-gender-gap-report-2014/part-1/the-case-for-gender-equality/.
Notes
← 1. The statistical data for Israel are supplied by and under the responsibility of the relevant Israeli authorities. The use of such data by the OECD is without prejudice to the status of the Golan Heights, East Jerusalem and Israeli settlements in the West Bank under the terms of international law.
← 2. For more information on becoming a DAC participant, please see: http://www.oecd.org/dac/dac-global-relations/Becoming_a_Participant_in_the_DAC.pdf.
← 3. In the context of this publication, officially supported flows include both official flows to developing countries and private finance mobilised through official development interventions. In the context of the development of the new framework of TOSSD, a specific definition of the term “officially supported” flows is being developed (see in that regard the work of the International TOSSD Task Force at http://www.oecd.org/dac/financing-sustainable-development/development-finance-standards/tossd-task-force.htm).
← 4. See the 2017 ODA press release at: http://www.oecd.org/dac/development-aid-rises-again-in-2016-but-flows-to-poorest-countries-dip.htm.
← 5. In-donor expenditures are not cross-border flows, but are taken into account in DAC statistics in certain circumstances. They include for example some administrative and refugee costs incurred in the donor country. For more information, see (OECD, 2016[69]).
← 6. Data in previous years were collected through ad hoc surveys, see more at http://www.oecd.org/dac/financing-sustainable-development/development-finance-standards/mobilisation.htm.
← 7. The country examples have been extracted from (Addis Tax Initiative, 2017[7]).
← 8. It is important here to note that the financing profiles of multilateral institutions vary greatly between lending institutions (multilateral development banks and regional development banks) and other multilateral institutions. The term multilateral here encompasses all UN agencies, funds and programmes – several of which fund social sectors exclusively.
← 9. While this is the case for DAC providers as a group, the few non-DAC providers reporting to the OECD CRS tend to focus on infrastructure, like the multilateral institutions, but with amounts that are far smaller than the DAC countries.
← 10. This group is comprised of the African Development Bank (AfDB), the Asian Development Bank (AsDB), the European Bank for Reconstruction and Development (EBRD), the European Investment Bank (EIB) as part of the EU Institutions, the Inter-American Development Bank (IDB), the World Bank (WB) and the International Finance Corporation (IFC, included in the WB Group).
← 11. Including the United States, World Bank Group, EU Institutions, Germany, IADB, Global Fund, United Kingdom, AsDB, France and Japan.
← 12. The World Bank Group, Korea, EU Institutions, EBRD, United States, Japan, IADB, Germany, IsDB, IFAD.
← 13. In the area of education in fragile contexts, see for example the Co-Chair’s summary of the Arab-DAC Dialogue that took place in Bern, Switzerland on 27 March 2017. For more information on the Arab-DAC dialogue, see also: http://www.oecd.org/dac/dac-global-relations/arab-dac-dialogue.htm
← 14. See for example paragraph 6 in (United Nations, 2015[1]).
← 15. This Action Plan, developed by the DAC GENDERNET, UN Women, and UN Member States, outlined the transformative policy and financing actions required to implement the Addis Ababa Action Agenda in support of achieving gender equality and empowering all women and girls. For more information see: http://www.oecd.org/dac/gender-development/Action%20Plan%20on%20Financing%20Gender%20Equality.pdf.
← 16. For further analysis of aid to gender equality in the economic and productive sectors, see (DAC GENDERNET, 2018[84]).
← 17. European Commission, Finland, Netherlands, New Zealand, Switzerland (Swiss Agency for Development and Cooperation), United Kingdom (DFID), the World Bank, and the Asian Development Bank.