Chapter 2. Discovering and selling medicines
This chapter describes the biopharmaceutical industry, beginning with an examination of its role and significance in the national economies of OECD countries in terms of employment, economic output, trade and research and development (R&D) expenditure. It then takes a closer look at the process of pharmaceutical R&D, outlining the main phases of the development of new medicines and their attendant risks; examining the contributions to R&D of the public and private sectors; comparing R&D intensity in the pharmaceutical industry with that of other industries; and considering R&D expenditure and activity in the context of health needs. Finally, the chapter describes trends in the industry, observing that while R&D productivity has declined over time and is increasingly focused on the development of medicines for small patient populations, the industry remains highly profitable.
The statistical data for Israel are supplied by and under the responsibility of the relevant Israeli authorities. The use of such data by the OECD is without prejudice to the status of the Golan Heights, East Jerusalem and Israeli settlements in the West Bank under the terms of international law.
Introduction
This chapter discusses the structure of the pharmaceutical and biotech industry, and addresses questions such as: What are the relative contributions of the public and private sectors to pharmaceutical R&D? How much is spent on R&D? What are the risks and uncertainties associated with the development of a new medicine? What are the returns for investors? The chapter also emphasises the significance of the pharmaceutical sector in OECD country economies. The main results can be summarised as follows:
-
The pharmaceutical industry plays a significant role in some OECD country economies, in terms of employment, gross value added, R&D activities and trade balance. The United States is home to by far the largest pharmaceutical industry in absolute terms, but relative to the size of their national economies the industry plays a greater role in Denmark, Ireland, Slovenia and Switzerland.
-
Both private investors and governments finance pharmaceutical R&D and both bear the risk of failed R&D projects. Public and private contributions to R&D are complementary, with governments mainly financing basic research and private firms focusing on translational research and product development.
-
Product development is risky and costly. The probability of gaining marketing approval for a drug entering in phase I clinical trials has been estimated at 14% on average, but ranges from 3% to 45%, depending on the therapeutic area, type of drug, the indication and the approval process. The clinical development of a new drug typically takes eight years.
-
The productivity of pharmaceutical R&D, measured as the amount spent per approved medicine, has declined over time – as it also has in other industries that rely on R&D for productivity gains, such as information technology and agricultural production.
-
Nevertheless, the pharmaceutical industry has made, on average, consistent economic profit in recent decades and has remained more profitable than many other R&D-intensive industries. Increasing drug prices and growing markets could be possible explanations of why profitability has remained stable even where the cost of R&D has increased.
-
Return on investment is concentrated in a small number of products.
-
The effective duration of market exclusivity1 for novel medicines (before entry of a competing generic or biosimilar product) has declined slightly since 1995 to 12-13 years in 2015. Competition from follow-on patented products can occur earlier in the product life-cycle.
-
Scientific progress has steered R&D efforts increasingly towards the development of medicines targeting small populations (“targeted” and orphan medicines).
The pharmaceutical industry plays a significant role in some OECD economies
The pharmaceutical industry represents a sizeable share of the economies of some OECD countries. While the pharmaceutical industry is present in all OECD countries, its economic activity (i.e. location of corporate headquarters, R&D or manufacturing) is concentrated in a small number of countries. The United States is home to by far the largest pharmaceutical industry in absolute terms, but relative to the size of their national economies the industry plays a greater role in Denmark, Ireland, Slovenia and Switzerland. For policy makers, retaining a strong presence of the pharmaceutical industry in a country can be an explicit goal of industrial and economic policy. This section provides a brief overview of the contribution of the pharmaceutical industry to the economies of OECD countries, in terms of employment, value added, R&D spending and trade.
The pharmaceutical industry employs more than 1.2 million people in OECD countries
Across 22 OECD countries for which data are available, the pharmaceutical manufacturing industry directly employed approximately 1.2 million people in 2015.2,3 This represents only a fraction of total employment related to medicines, and does not include persons whose activities may be related to pharmaceutical R&D or distribution classified in other general categories, such as “scientific research and development” or “wholesale and retail trade.” No internationally comparable data are available according to broader definitions of the industry similar to data published by the Pharmaceutical Research and Manufacturers of America (PhRMA) concerning the United States. In small countries with large pharmaceutical industries, such as Switzerland, Slovenia and Denmark, persons engaged in the pharmaceutical manufacturing industry represent approximately 0.8% to 0.9% of total employment. In the United States, with around 480 000 people in the sector,4 the pharmaceutical industry represents 0.3% of total employment (Figure 2.1).
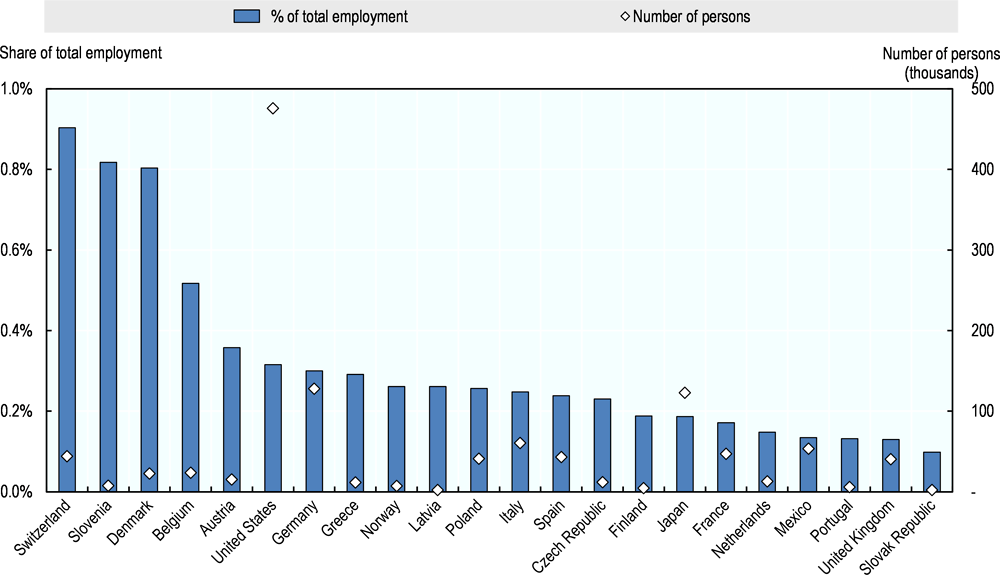
Source: OECD Structural Analysis (STAN) database (OECD, 2017g).
A significant proportion of jobs in the industry relate to R&D, which requires highly developed skills. Recent data on the share of R&D personnel in total employment in the pharmaceutical industry are only available for nine OECD countries.5 Among these countries, the share of full-time equivalents (FTEs) working in R&D is highest in Switzerland (26%), followed by the Netherlands (14%) and France (12%). With almost 10 000 FTEs in R&D, Switzerland also employs the highest absolute number of R&D personnel among these countries.
In some small countries with large pharmaceutical sectors, the pharmaceutical industry employs a large proportion of the total R&D workforce in the country (Figure 2.2). In Switzerland, more than 20% of all FTEs engaged in R&D work in the pharmaceutical industry, the highest proportion among OECD countries for which data are available. Denmark has the second highest share (17%), followed by Hungary and Slovenia (12% each). In absolute terms, the largest pharmaceutical R&D workforce is likely to be found in the United States. According to data from the Business R&D and Innovation Survey (BRDIS), 117 000 persons were employed in pharmaceutical R&D by businesses in 2013 in the United States, which represents 8% of all R&D-related employment by businesses. But these data are not directly comparable to data available from other OECD countries. Large R&D workforces are also found in Japan and Germany, where approximately 29 000 and 20 000 R&D FTEs are employed in the pharmaceutical industry respectively.
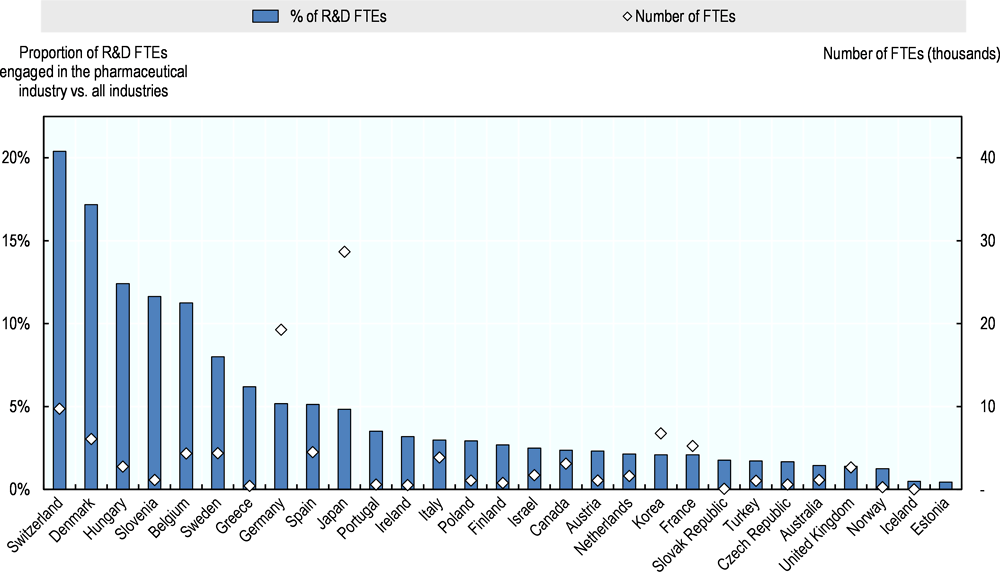
Note: 2011 data for Sweden, 2012 for Switzerland; all other countries 2015, 2014 or 2013.
Source: OECD Structural Analysis (STAN) database (OECD, 2017g).
The industry contributes to the economic output of OECD countries
The relative contribution of the pharmaceutical industry to each national economy is highest in a number of small OECD member countries that host production facilities or corporate headquarters (Figure 2.3). Gross value added (GVA) by the pharmaceutical industry as a percentage of total GVA in the economy is highest in Ireland (7.3%), followed by Switzerland (3.9%) and Denmark (3.7%). In Ireland, where 37% of total GVA in the economy is generated by the manufacturing sector,6 the pharmaceutical industry is comparable in size to the Finance and Insurance and Information and Communication sectors, which account for just under 7% and 9% of total GVA respectively. Denmark and Switzerland have smaller manufacturing sectors (18% and 15% respectively). In Denmark, the pharmaceutical industry contributes somewhat less than the finance and insurance and the information and communication sectors (6% and 5% respectively), while in Switzerland, its contribution is similar to that of the information and communication sector (4%) but lower than that of the finance and insurance sector (10%) (OECD, 2017i).
The pharmaceutical sector is a relatively small contributor to total GVA in the largest economies. For example, pharmaceuticals accounted for only 0.8% of total GVA in Germany, Japan and the United States. In all of these countries, this is significantly less than the finance and insurance or information and communication sectors, which account for 5% each of total GVA in Germany and Japan, and 6% in the United States. The entire manufacturing sectors in these four countries range from 12% of GVA in the United States economy to 23% in Germany (OECD, 2017i).
A small number of countries contribute a large share of the total GVA generated by the pharmaceutical industry across all OECD countries (Figure 2.4). The United States alone accounted for approximately 40% of total pharmaceutical GVA across all OECD countries for which data are available for 2015 (or a recent year since 2012). Japan contributed 10% and European OECD countries collectively accounted for 43% of GVA, with the highest shares contributed by Germany (8%), Switzerland, the United Kingdom (5% each) and Ireland (4%). The remaining 7% of GVA was generated in other non-European OECD countries.

Note: Based on data for 2015 or the nearest year available between 2012 and 2014.
Source: OECD System of National Accounts (SNA) and Structural Analysis (STAN) databases (OECD, 2017a, 2017g).

Note: Based on data for 2015 or the nearest year available between 2012 and 2014. Total does not include Australia, Chile, Israel, Luxembourg, New Zealand and Sweden.
Source: OECD System of National Accounts (SNA) and Structural Analysis (STAN) databases (OECD, 2017a, 2017g).
OECD countries host most of the world’s biomedical R&D activities
Most biomedical R&D activity, including pharmaceutical R&D, takes place in OECD countries (Chakma et al., 2014). The pharmaceutical industry spent approximately USD 100 billion on R&D in 2014 across OECD countries (OECD, 2017f). More than half the spending in OECD countries occurs in the United States, where the pharmaceutical industry spent more than USD 56 billion (0.3% of GDP). Industry spent USD 26 billion (0.1% of GDP) in Europe and USD 15 billion (0.3% of GDP) in Japan. As a share of GDP, industry spending is highest in Switzerland (0.6%), Belgium (0.6%) and Slovenia (0.4%). In some small countries with large pharmaceutical sectors, pharmaceutical industry expenditure on R&D7 also represents a large share of total business enterprise expenditure on R&D (BERD) (Figure 2.5). For example, the pharmaceutical industry accounts for 30% and 29% of total BERD in Switzerland and Belgium respectively, and for 24% and 23% of BERD in Slovenia and Denmark. However, the share of total BERD represented by the pharmaceutical industry is also significant in larger countries such as the United States (17%) and Japan (11%).
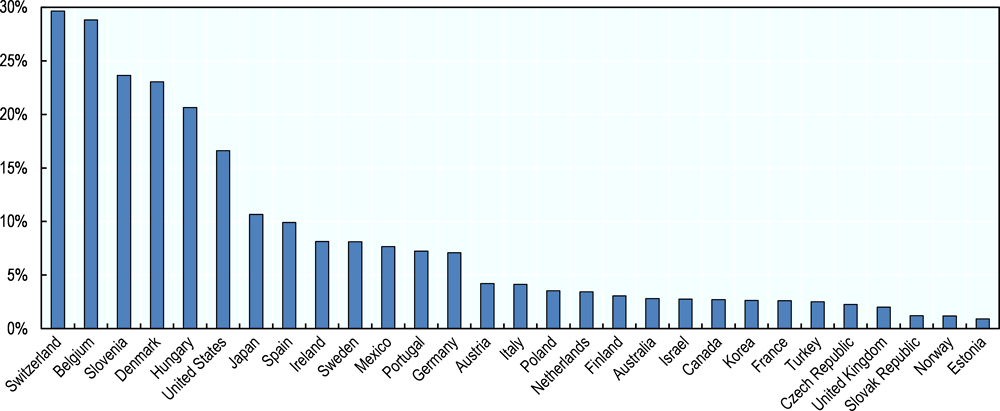
Source: OECD Research and Development Statistics database (OECD, 2017f).
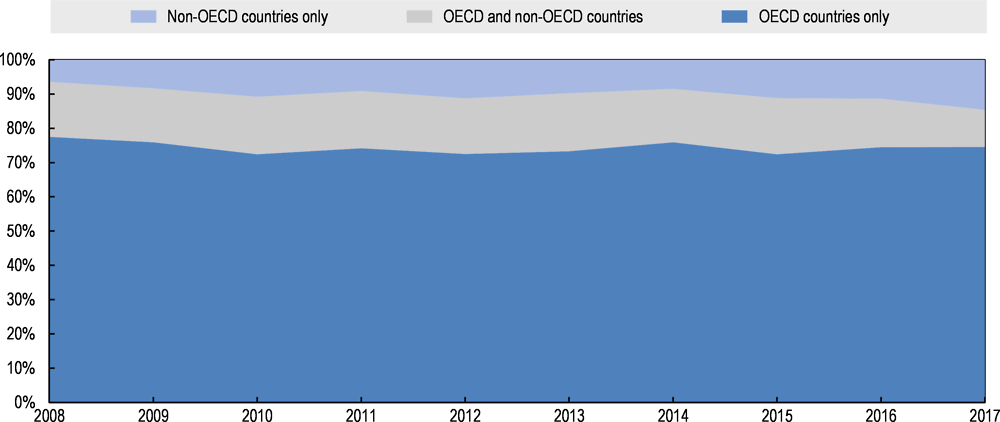
More than three-quarters of all registered clinical trials worldwide (not specific to medicines) take place in OECD countries. With increasing geographical scope of trials and varying regional or national registration requirements, it is not straightforward to obtain exhaustive information on clinical trial activity across all OECD countries. The WHO maintains the International Clinical Trials Registry Platform (ICTRP) that collates data from 17 regional or national registers, including those in the European Union, Japan and the United States. Of more than 500 000 studies registered in the ICTRP as at end of July 2017, 77% were undertaken in OECD countries. About 20% of all registered clinical trials were conducted in the United States, followed by Japan (6%), the United Kingdom and Germany (5% each). However, this includes a wide range of clinical studies, including RCTs, observational studies and trials of healthcare interventions other than medicines, such as procedures, devices, delivery system changes, and behavioural and lifestyle interventions. ICTRP does not provide a breakdown by healthcare intervention or study sponsor that would allow for isolation of industry-sponsored trials for drug development in the total. The vast majority (approximately 90%) of patients recruited for industry-sponsored trials registered with the US National Institutes of Health (NIH) come from OECD countries (see Figure 2.6 and Annex 2.A for further details).
Note: These figures likely overstate the importance of OECD countries because only registration of trials of drugs and biologics subject to FDA regulation is compulsory; 55% of trials registered with the NIH recruit patients in the United States and other countries, and 34% in the United States only, which is a significantly higher share than the 20% of the studies conducted in the United States according to the WHO International Clinical Trials Registry Platform (ICTRP).
Source: US NIH, 2017a.
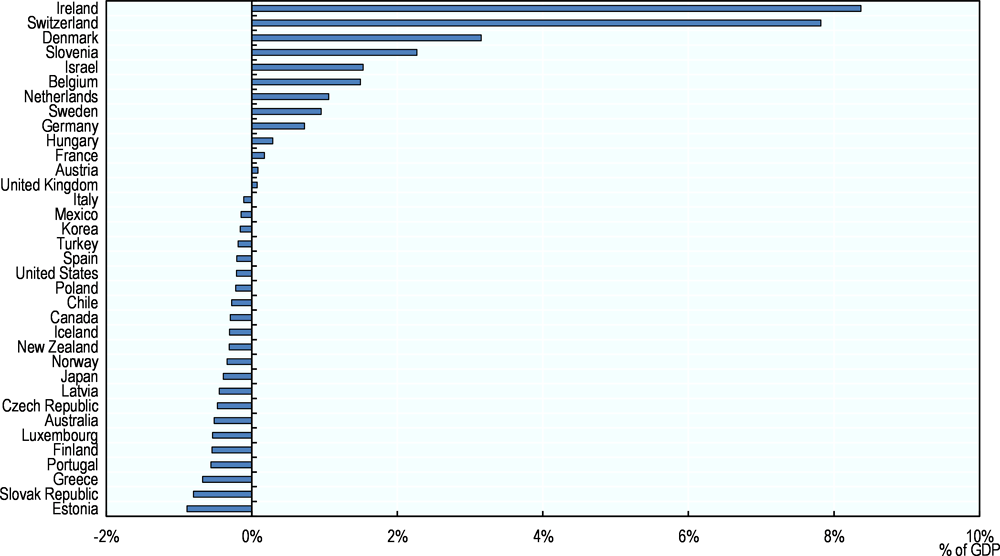
One-third of OECD countries are net exporters of pharmaceuticals
In 2015, Switzerland, Germany and Ireland were the biggest net exporters of pharmaceuticals, with trade surpluses of USD 41 billion, 28 billion and 27 billion respectively (OECD, 2017g). With net imports of USD 38 billion, the United States had by far the largest pharmaceutical trade deficit (ibid.). Japan and Australia had the next highest net imports, amounting to USD 20 billion and USD 6 billion respectively (ibid). Net pharmaceutical exports represented more than 8% of GDP in Ireland in 2015, approximately 8% in Switzerland and 3% in Denmark, but less than 1% in Germany (Figure 2.7). Net imports represented 0.5% of GDP in Australia, 0.4% in Japan and 0.2% in the United States (Figure 2.7).
Exports and imports of medicines most often take place between companies manufacturing medicines and their licensees, distributors or affiliates. However, price differentials between countries provide an incentive for arbitrage and can prompt trade by wholesalers or other entities in the supply chain. The resale of goods between countries and placement on the market outside the formal channels authorised by the product manufacturer is often referred to as parallel trade (OECD, 2008). In the United States, trade across national borders outside manufacturers’ channels is referred to as cross-border trade (ibid.), and is generally prohibited except for personal consumption. By contrast, parallel trade in medicines by intermediaries is legal in the European Union, where the single market aims to ensure there are no unnecessary barriers to the free trade of goods between member states. The proportion of parallel imports in outpatient pharmaceutical markets varies considerably across European Union countries. According to estimates reported by the European Federation of Pharmaceutical Industries and Associations in 2016, parallel imports accounted for nearly 25% of the retail market in Denmark and 12% in Sweden. In Germany and the United Kingdom, the two largest markets for which estimates are available, parallel imports accounted for 9% of the market. In contrast, in Austria, Belgium or Poland, the share of parallel imports was between 1% and 2% (EFPIA, 2016).
In the United States, cross-border imports of drugs for personal use by patients have generated a lot of debate (Fralick, Avorn and Kesselheim, 2017). While the US Food, Drug, and Cosmetic Act currently prohibits such imports, the Food and Drug Administration (FDA) has generally not enforced this prohibition when patients import products for their personal use (ibid.). A survey conducted in November 2016 found that 8% of United States households had bought prescription drugs from Canada or other countries outside the United States in order to obtain them at lower prices (KFF, 2016).
Source: OECD Structural Analysis (STAN) database (OECD, 2017g).
The process of pharmaceutical R&D is complex
Pharmaceutical R&D is a complex ecosystem of activities involving public and private stakeholders. While unpredictable advances in basic science are a key driver of progress, business opportunities for private investors are also important (Nicholson, 2012; Lo and Naraharisetti, 2014). R&D relies heavily on private investment and as alternative investment opportunities compete for capital, the returns expected by private investors increase with the anticipated risk. With low production costs, returns on investment in medicines depend in part on the costs of R&D, the associated probability of successful marketing approval (or risk of failure), and the value of expected sales (volume x price). In making choices about R&D projects, firms seek to maximise future revenues, considering both the potential volume of sales of a successfully approved new product, as well as the prices that the product can command in various markets. As in all other sectors that rely on private capital, pharmaceutical firms have an incentive to charge prices that maximise revenue. The challenge is therefore apparent: in harnessing the private sector for investment in R&D, policy seeks to strike a balance between prices that encourage that investment and the development of effective treatments that address unmet needs, as well as to allocate health care budgets as efficiently as possible. If the budget impact of novel treatments is too great, both public and private payers may be unable to afford them.
The following subsections discuss the process of R&D and its inherent risks, the contributions of the public sector and the industry to R&D, dynamics in the pharmaceutical market, and how these affect the business model of the industry.
Pharmaceutical R&D is a long and risk-prone process
Pharmaceutical R&D can be broken down into three stages: basic research, translational research, and clinical development (Milken Institute and Faster Cures, 2012; Chakravarthy et al., 2016). Clinical development generally comprises three phases of clinical trials. Phase 1 trials test the safety and tolerability (dosage) of drugs in small numbers of healthy volunteers (20 to 100) and last several months. Phase 2 trials observe efficacy and side effects in patients with the disease/condition targeted. They usually recruit up to a few hundred people with the disease and last from several months to two years. Phase 3 trials aim to assess efficacy and monitor adverse reactions to a drug vs a placebo or an existing treatment. They involve a larger sample of patients (from 300 to 3 000) and may last one to three years, depending on the disease/condition (Hobbs and McCarthy, 2009; FDA, 2017b).8 Some R&D continues post marketing approval, also referred to as phase 4, through trials to meet post-market regulatory requirements, test new dosage strengths, regimens or new formulations (Hobbs and McCarthy, 2009; Chakravarthy et al., 2016).
Effective R&D relies on a fundamental understanding of the disease, which is generated by basic research. This basic knowledge may often be relevant to a broad range of fields and therapeutic areas, and requires translational research for effective application in product development. Knowledge generated from basic research cannot in itself be easily appropriated in commercial products, making it unattractive to for-profit private investment. On the other hand, translational research and product development are both more amenable to intellectual property protection, and thus offer greater financial incentives for private investors. Translational research has been identified as the most risky stage or “valley of death” (Milken Institute and Faster Cures, 2012). However, knowledge generation is not a unidirectional process, and these stages are complementary: basic research can be guided by knowledge generated in translational research and product development.
Investments in pharmaceutical R&D are inherently risk prone. Progress is subject to significant uncertainty and often dependent on intrinsically unpredictable breakthrough discoveries, which can then trigger a wave of follow-on discoveries. Similar to other sectors, pharmaceutical innovation is therefore mainly incremental, and breakthroughs are rare. The experience thus far with treatments for Alzheimer’s disease, for example, shows that even significant investments do not guarantee progress towards effective treatments (Cummings, Morstorf and Zhong, 2014; Cummings et al., 2017).
The probability that a drug entering clinical trials is successful in gaining marketing authorisation is low. In a sample of 15 102 investigational drugs that entered phase 1 of industry-sponsored clinical trials between 2000 and 2015, 14% received market approval after a median time of eight years of clinical development (Wong, Siah and Lo, 2018). The probability of successful transition to the subsequent development phase was highest in phase 1 and lowest in phase 2 (see Table 2.1). Based on other and smaller samples of products and different methodologies, various prior studies have estimated success rates between phase 1 and marketing approval to lie between 7% and 26% (Mestre-Ferrandiz, Sussex and Towse, 2012). Success rates vary by disease, indication, patient stratification, and regulatory path (Hay et al., 2014; Wong, Siah and Lo, 2018). Prior studies agree that success rates are below average in oncology, for example, but higher for infectious diseases, including vaccines. Wong, Siah and Lo (2018) estimated that success rates range from 3% in oncology, with a median development time of 13 years, to 33% for infectious disease vaccines, with a median development time of 6 years. Success rates have been estimated to be higher than the average for lead indications9 than for other indications in most disease areas, though not for infectious disease vaccines (Hay et al., 2014; Wong, Siah and Lo, 2018). Wong, Siah and Lo (2018) estimated that the success rate for lead indications was 22% across all diseases and 11% in oncology. Conflicting results have been found for drugs with orphan designation. Hay et al. (2014) estimated significantly higher success rates for orphan drugs (33% for all orphans including oncology, 45% for non-oncology orphans) while Wong, Siah and Lo (2018) found lower success rates (6% and 1%). It is unclear what is driving the differences in results between studies. Reasons could include different estimation methods and the effects of missing data,10 or that the study by Hay et al. (2014) is based on data only from the United States, while Wong, Siah and Lo (2018) use an international dataset. Inaccuracies can also stem from the classification of trials as some drugs are not designated as orphan until late-stage development phases. Furthermore, Wong, Siah and Lo (2018) found that the use of biomarkers for patient selection is associated with higher success rates. Hay et al. (2014) also found that in the United States products that benefit from FDA special protocol assessment had higher success rates (ibid.).11
Estimates of success rates in clinical development do not take into account successes and failures that may occur throughout the R&D that precedes clinical testing. One study estimated the rate of successful transition from pre-clinical R&D into clinical development at 35% after more than five years on average (Mestre-Ferrandiz, Sussex and Towse, 2012). Overall, successful R&D of a new medicine therefore takes an average of 10 to 15 years (Mestre-Ferrandiz, Sussex and Towse, 2012; Chakravarthy et al., 2016) but can be significantly shorter or longer for individual compounds.
Given the low overall probability of marketing approval, there is a strong argument in favour of duplication in R&D, similar to other industries in which the success of any given project is uncertain. In this context, an analysis of the optimal number of “parallel paths” cautiously suggested that there was not enough duplication in R&D of large pharmaceutical companies in 2009 and 2010, even from the perspective of a single profit-maximising firm (Comanor and Scherer, 2013). Another study suggested, however, that there was redundancy in the R&D priorities of large pharmaceutical companies, with the majority of molecules in development for the treatment of cancer by these companies having “overlapping” mechanisms of action (Fojo, Mailankody and Lo, 2014).
The public and private sectors finance innovation
Global expenditure on health-related R&D amounted to USD 240 billion in 2009, which is the latest estimate available. In high-income countries, 60% of these investments came from the business sector, 30% from governments and 10% from other sources, including private not-for-profit organisations or universities (Røttingen et al., 2013). Some 90% of the global total expenditure was incurred in OECD countries. However, expenditure in some emerging economies, notably China, has been growing significantly since 2000 (Chakma et al., 2014).
OECD governments spend 0.1% of their GDP on average in health-related R&D
Government funding focuses on basic research, through direct research grants, subsidies and publicly-funded universities. In 2014, governments of OECD countries budgeted about USD 51 billion on health-related R&D, representing about 0.1% of their collective GDP (OECD, 2017f).12 Health-related R&D budgets refer to funding aimed at protecting, promoting and restoring human health, including all aspects of medical and social care, not necessarily pharmaceutical R&D. Isolating pharmaceutical-related R&D expenditure can be difficult, especially in basic research that seeks to improve health-related knowledge, and cannot be associated with the development of specific products. However, this figure also understates total government support, since it excludes funding for higher education or publicly-owned corporations and tax incentive schemes. General university funding allocated to health accounted for another 0.05 to 0.2% of GDP in countries for which such data are available.13
The United States government budgeted approximately USD 33 billion or 0.2% of its GDP on health-related research in 2014, which is the highest spending among OECD member countries, both in absolute terms and relative to GDP (OECD, 2017f). Government R&D budgets in the United States include the National Institutes of Health (NIH), with a budget of approximately USD 29 billion in 2014, of which some 54% were allocated to basic research (down from 59% in 2000) and 46% to applied research (NSF, 2017a). Meanwhile, the higher education sector in the United States allocated USD 37 billion to research and development in life sciences and related fields, of which 56% were allocated to medical sciences (NSF, 2017b). Expenditure by higher education includes funding by the institutions themselves, as well as funding from government, businesses and non-profit organisations.
Business enterprises spend 0.2% of GDP on pharmaceutical R&D on average across OECD countries
Expenditure by the business enterprise sector on pharmaceutical R&D amounted to USD 100 billion across OECD countries in 2014, representing roughly 0.2% of GDP (OECD, 2017f).14 R&D conducted in the business enterprise sector in the United States contributed nearly USD 57 billion to this total, which represents 0.3% of its GDP (ibid.). This includes all R&D performed by businesses in the United States regardless of the source of funding.15 According to a survey by the National Science Foundation (NSF), in 2013 approximately 12% of pharmaceutical R&D expenditure by businesses was not funded by the businesses themselves (NSF, 2016b). Relative to GDP, business expenditure in pharmaceutical R&D is highest in Switzerland and Belgium (0.6%), Slovenia (0.5%) and Denmark (0.4%). In these countries, pharmaceutical R&D represents between 23% and 34% of total business enterprise expenditure on R&D.
The pharmaceutical industry is among the sectors with the highest R&D-intensity in OECD countries. On average across OECD countries, R&D expenditure by the pharmaceutical sector represents approximately 14% of gross value added (GVA), compared to 18% in the air and spacecraft industry and 17% in electronic and optical products (Figure 2.8).

Note: Industries are based on the United Nations International Standard Industrial Classification of All Economic Activities (ISIC). The air and spacecraft, electronic and optical products and pharmaceutical industries are sub-categories of total manufacturing. All other industries are totals at the same level as total manufacturing.
Source: OECD Health at a Glance 2017 (OECD, 2017b).
Within the business sector, different types of firms engage in pharmaceutical R&D, and technologies are often licensed between different businesses and institutions, or acquired during the R&D process. Originators of new technologies are found across the spectrum of private and public institutions, and among different size firms. Scientists or institutions that first discover compounds and may initially rely on public or private funding, often patent their inventions or create business spin-offs from research institutions, and intellectual property rights are then licensed or acquired. Among all new chemical entities (NCEs) launched in the United States between 1996 and 2015, 74% were launched by a company other than the patentee (QuintilesIMS Institute, 2017). Among a sample of 94 marketing authorisation applications for new actives substances (NAS) that received a positive opinion from the European Medicines Agency (EMA) between 2010 and 2012, 55 products (58%) were transferred between different categories of originator entities (Lincker et al., 2014). R&D also relies on small and mid-cap firms, backed by venture and private equity capital, which play a particularly important role in the translational research stage (Milken Institute and Faster Cures, 2012; Nicholson, 2012). Venture capitalists may target high investment returns on their portfolios but also accept a high degree of risk (Nicholson, 2012; Garber et al., 2014).
Large and publicly traded firms are able to diversify risk, can reinvest cash flow from existing products into R&D, and have lower capital costs (Nicholson, 2012), allowing them to raise funds for large-scale clinical trials more easily. However, they are also sensitive to stock price fluctuations and shorter-term performance targets, which can make them more risk averse than firms backed by venture or other forms of private capital (Milken Institute and Faster Cures, 2012; Fagnan et al., 2013; Lo and Naraharisetti, 2014). While large pharmaceutical firms are active in all stages of R&D, they play a larger role in acquiring technology in the translational or clinical stages of R&D (Mayhew, 2010), funding clinical trials required for marketing approval, and commercialising approved technologies. In the sample of 94 marketing authorisation applications with EMA between 2010 and 2012, the largest number of transfers (41 products, 44% of all transfers) were from small and medium-sized enterprises (SMEs) or academic/public institutions to large or intermediate-sized companies (Lincker et al., 2014). Large companies held marketing authorisation for 63% of the products in the sample while they were the originators of 30% (ibid.).
Some 65% of R&D expenditure by firms operating in the United States is related to product development. The share of R&D expenditure spent on product development increased from 45% in 1992 to 69% in 2004 before decreasing slightly by 2013, while the share of basic research declined from 17% in 1992 to 8% in 2004 and then increased again to 12% in 2013 (NSF, 1998, 2009, 2016b). The share of applied research continued to decrease from and 39% in 1992 to 23% in 2004 and 22% in 2013 (ibid.).
R&D efforts are correlated with health needs with some notable exceptions
Some studies have shown that the intensity of health-related and pharmaceutical R&D activity and R&D output by disease area is correlated with health need, but this correlation is not perfect and there may be disproportionate concentrations of private or public R&D in some areas, while unmet need remains in others (Catalá-López et al., 2010; Atal et al., 2015; Barrenho, Miraldo and Smith, 2017). Other studies have found that medical research is mainly driven by the market size for treatments, defined as a combination of local health need in a country and its income, but not the global burden of disease, because less research is conducted in diseases with a high burden in low-income countries (Evans, Shim and Ioannidis, 2014).
Mismatches between disease burden and private R&D are inevitable and result from both financial incentives and scientific opportunities (Barrenho, Miraldo and Smith, 2017). Private investors have no economic incentives to allocate R&D resources to areas where market prospects are poor or expected return on investment is low.16 On the other hand, some areas might provide attractive market prospects but innovation may be particularly challenging given the state of scientific knowledge. An example of the latter is dementia and Alzheimer’s disease; while the ageing population of OECD countries and limited therapeutic value of currently available medicines leave need unmet and large market potential untapped, the struggle to understand the underlying pathological processes and predisposing factors has led to a number of late-stage failures.
A perfect alignment between pharmaceutical R&D and unmet health need should not necessarily be the target for policy, as some diseases may be more amenable to non-pharmacological treatments or interventions (Barrenho, Miraldo and Smith, 2017). Furthermore, in some areas, high disease burden does not only result from a lack of availability of pharmaceutical treatments, but also from lifestyle choices, low treatment rates, environmental and social determinants, and issues of health system performance and access.
Nevertheless, some prior studies have investigated the alignment between health need and R&D, with need defined in terms of disease burden (measured in disability-adjusted life years – DALYs) and R&D in terms of activity or output measures, such as the number of clinical trials or new drug approvals. These studies did not consider products in pre-clinical development. An analysis of 115 000 RCTs found that globally, a disproportionately high number of trials investigate malignant neoplasms or mental and behavioural diseases, while common infectious diseases and neonatal disorders are under-researched relative to their disease burden (Atal et al., 2018). However, this analysis did not disaggregate R&D effort between medicines and other interventions. It also showed that R&D is more aligned with disease burden in high-income countries, while the R&D shortfall in common infectious diseases and neonatal disorders is driven by low RCT activity and high disease burdens in countries in South Asia and Sub-Saharan Africa (ibid.). An earlier study of the correspondence between the number of new drug approvals in the European Union between 1995 and 2009 and burden of disease found that, despite a clear positive correlation overall, innovation was over-represented in infectious and parasitic diseases, blood and endocrine disorders, diabetes and genitourinary diseases (Catalá-López et al., 2010). Another study of global new drug approvals and burden of disease in 1990 and 2010 found that these were relatively well-aligned with global disease burden, but that there was some disproportionate concentration in diseases with high burdens and large markets, such as cardiovascular, circulatory and musculoskeletal diseases or neoplasms (Barrenho, Miraldo and Smith, 2017). Examples of where R&D activity and output are currently poor relative to disease burden or public health need include, but are not limited to:
-
Antibiotics: Poor market prospects have hindered private investments in the development of new antibiotics to fight anti-microbial resistance (AMR), which is now a global threat. International efforts aim to provide alternative incentives to reward companies for new treatments (OECD, 2016a).
-
Mental and behavioural disorders: a study found relatively few new approvals in some diseases with a high, such as dysthymia, anxiety or unipolar depressive disorders (Barrenho, Miraldo and Smith, 2017).
-
Neonatal disorders: a study found relatively few new approvals in neonatal encephalopathy (Barrenho, Miraldo and Smith, 2017).
-
A group of heterogeneous diseases defined according to the lack of R&D activity, referred to as neglected diseases. In a broad group of 35 neglected diseases,17 affecting large populations with limited ability to pay and accounting for more than 8% of disability-adjusted life years (DALYs) lost and 6% of all deaths globally (IHME, 2015), only USD 3.4 billion were invested in public and private R&D in 2014, of which 68% was for HIV/AIDS, malaria and tuberculosis (Policy Cures, 2015). Among a more narrow group of 18 neglected tropical diseases (NTDs),18 a study found disproportionately low levels of R&D in the highest burden NTDs that predominantly affect developing countries, and that R&D was biased towards diseases with low burden and low market sizes, such as dengue and Chagas disease, relative to diseases with high burden (Barrenho, Miraldo and Smith, 2017).
Governments and other stakeholders have been exploring new innovation models, regulatory and reimbursement reforms, and strengthened stakeholder collaboration for areas such as dementia and diseases that have been recognised as neglected (OECD, 2017c). Specific legislation to increase financial incentives, through mechanisms such as extended market exclusivity, reduced regulatory fees or tax credits, and subsidies for clinical trial costs, are in place in the European Union and the United States (Hall and Carlson, 2014). Alternative models have often taken the form of partnerships between industry and the public sector or NGOs (Moran, 2005), particularly for diseases where the lack of R&D has been attributed to limited market potential. Of the USD 3.4 billion invested in R&D in neglected diseases in 2014, the public sector contributed 64%, the philanthropic sector 20%, and industry the remaining 16% (Policy Cures, 2015). Development of 67% of 151 high-priority, low-incentive products in 2015 was undertaken through partnership between industry and non-industry entities (Access to Medicine Foundation, 2016). Six manufacturers accounted for development of around three quarters of these products. Chapter 3 further discusses models of public and private partnerships to address unmet needs.
Business models in the pharmaceutical industry are changing
R&D costs have been increasing and R&D productivity – as measured by new drug approvals per amount of R&D spending - has been declining, as in other sectors. Return on investment stems from a small number of products achieving commercial success. Scientific progress is increasingly steering R&D efforts toward the development of medicines targeting small populations and likely to command high unit prices. On average, the pharmaceutical industry has provided stable economic profits to investors in the past decade, suggesting that profits were higher than needed to compensate investors for risk.
As in other sectors, the productivity of R&D has declined
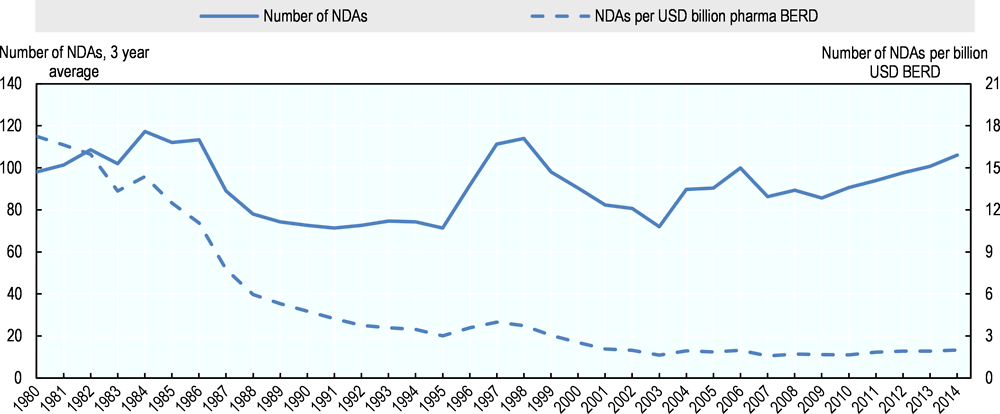
By several measures, the productivity of R&D in the pharmaceutical industry has declined in recent decades. Measures of productivity comprise measures of input, such as financial or human resources, and measures of output, which would ideally be expressed in terms of health gains delivered by new treatments. With the latter being difficult to capture, however, proxy measures such as the number of new drug approvals or patents are often used. In the United States, for example, the number of new drug approvals (NDAs)19 for every billion USD of inflation-adjusted R&D expenditure by the industry has declined from more than 17 in 1980 to 2 in 2002 and has been largely flat through 2014 (Figure 2.9). However this is a rather simplistic measure because it compares approvals in a given year to R&D expenditure in the same year, despite (as described above) more than ten years of R&D being required on average for successful approval of a given new drug, and thus approvals in a given period are dependent on expenditure made earlier.
SSR Health (2016) analysed the R&D productivity by R&D spending of the 22 largest publicly listed pharmaceutical firms in the United States, in terms of innovative output and returns to investors. The analysis of innovative output uses as its output measures the number of patents granted in a given year, adjusted for the accumulation of citations of these patents in subsequent patents as an indicator of the “quality” of the initial patent, and inflation-adjusted R&D expenditure in the same year, for the years 1990 through 2014. The analysis of economic returns accounts for the lag between R&D expenditure and revenue by computing, for the years 1969 through 2014, net income returns after cost of capital in a given year on R&D expenditure incurred ten years earlier. Both analyses also found a consistent trend of declining productivity of R&D expenditure in the period from 1990 to 2014 (SSR Health, 2016).
Source: OECD, 2017b.
Declining R&D productivity may be related to several interrelated factors. The phenomenon is not specific to pharmaceuticals or healthcare technology but is also found in other sectors, such as computer science and agricultural production (Bloom et al., 2017). The decline has, for example, been attributed to the opportunistic nature of R&D. This implies that ideas that are “easy” to find are exploited first and, as the stock of knowledge increases, new ideas become harder to find and output can only be sustained or increased by large increases in research effort that offset declining productivity (ibid.). In pharmaceuticals, this is apparent in an ever-increasing back catalogue of effective drugs and a shift towards more complex conditions that has increased the complexity of clinical trials and failure rates (Scannell et al., 2012; Deloitte Centre for Health Solutions, 2016; SSR Health, 2016). More stringent requirements to gain marketing authorisation have also been hypothesised to have increased the costs of clinical trials (Scannell et al., 2012; SSR Health, 2016).
On the other hand, declines in productivity are also driven by rising R&D costs, which can be both a cause and an effect of increasing drug prices. Profit-maximising firms make investment decisions based on expected future revenue so that expectations of higher prices can make increasingly expensive R&D projects financially viable. High levels of investment in R&D can in turn justify high prices. The increasing licensing and acquisition activity that has been observed in pharmaceutical R&D in the past (Mayhew, 2010; Comanor and Scherer, 2013) can also contribute to this dynamic. Firms that acquire technology in the R&D process pay premiums over R&D costs, which are also based on anticipated future revenue. Acquisition costs have to be recouped through subsequent revenue.
The pharmaceutical industry remains profitable
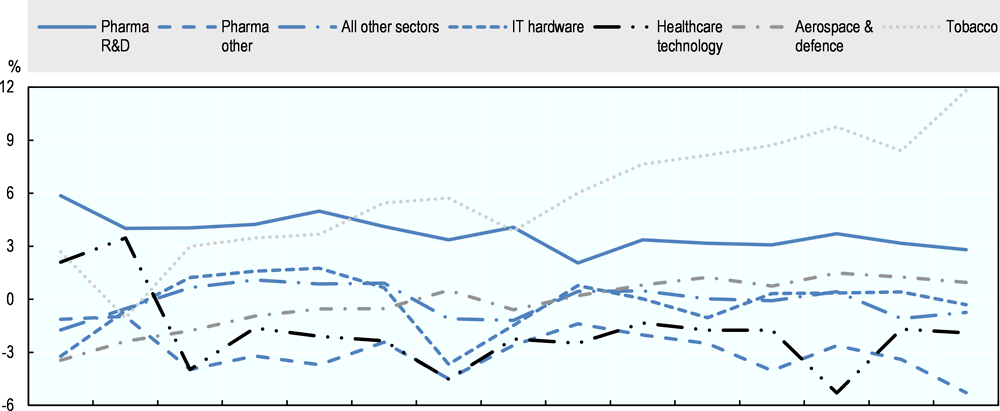
On average, and by comparison with other industries, the pharmaceutical industry has provided high and stable returns in the past decade. Increasing drug prices or growing markets are possible explanations of why profitability remains stable even as the cost of R&D increases and R&D productivity declines or remains flat. Figure 2.10 provides estimates of the difference between the rate of return and the cost of capital in the R&D-based pharmaceutical industry, based on a sample of 87 publicly-traded pharmaceutical firms, and of 6 996 firms across all other sectors of the economy. Since 2007, the R&D-based pharmaceutical industry has consistently made economic profits and has been more profitable than some other R&D-intensive industries, such as aerospace and defence, information technology (IT) hardware, or other healthcare technology. Estimates in Figure 2.10 are averages across all firms in each sector, weighted for the capital invested in each firm. The methodology is discussed in further detail in Box 2.1. Firms generate economic profit when their return on assets (RoA) exceeds their cost of capital (CoK), or the return investors demand for the risk of investing in the firm. Because the analysis is at the firm level, the market’s assessment of the risk of investing in these firms is taken into account. This analysis of the profitability of the pharmaceutical industry is confirmed using a different method of estimating the cost of capital used by Koijen, Philipson and Uhlig (2016). This showed that the returns on firms engaged in medical equipment and pharmaceutical products were substantially higher –respectively 6.4% and 5.4% per annum- than the estimated returns required based on risk, as predicted by standard empirical asset pricing models, such as the capital asset pricing model and the Fama-French model. Economic profits can be a result of a number of market imperfections. They can be an indication of a lack of competition and market power of producers as a result of entry barriers or of unusual risks to investors that are not appropriately captured in CoK estimates; further analysis would be required to identify the reasons for economic profits in the R&D-based pharmaceutical industry.
The difference between the rate of return in the sector and its cost of capital (CoK) is used as an indicator to compare the profitability of the pharmaceutical sector with other sectors of private investment. In an efficient capital market, CoK increases with the risk of an investment because investors demand higher compensation for investing in firms with more uncertain returns. Therefore, subtracting CoK from the rate of return accounts for differences in the risk profiles of sectors.
Rates of return can be expressed in terms of return on assets (RoA) or return on equity (RoE). RoA is a measure of the overall economic profit (or loss) of firms beyond what is necessary to compensate all types of investors that finance their operations, including shareholders and creditors. RoE is a measure of profitability relevant for shareholders because it represents the return on owning equity in the firm after the cost of debt. In fully efficient product and financial markets, the difference between RoA and CoK would be equal to zero in the long run because economic profits would lead to new entrants to the sector and downward pressures on profit margins while losses would lead to firm exits from the sector. For various reasons, this may not be the case in reality. For example, economic losses can be the result of prior overinvestment and excess capacity while government interventions, such as subsidies, can prevent firms exit. Conversely, economic profits can be a result of barriers to entry and an indication of excess margins.
The cost of capital (CoK) is determined by the cost of equity and the cost of debt. Cost of equity is usually higher than the cost of debt because shareholders are compensated after payment of interest to creditors and therefore bear more risk. Firms can increase RoE by increasing the proportion of debt financing, referred to as leverage. This also increases the level of risk to shareholders. Debt requires stable sources of cash flow for interest payments. As a result of the uncertainty inherent in drug development, pharmaceutical firms rely more heavily on equity than on debt financing so that CoK is close to CoE.
For analysis in this report, these measures are calculated based on the following definitions:
-
Return on assets (RoA) is calculated as the ratio of net income to total assets, including assets financed from equity and debt.
-
Cost of capital (CoK) is the average cost of equity and cost of debt weighted by the respective share of equity and debt in total assets.
-
Cost of equity (CoE) is calculated as the sum of dividend yield, buyback yield and underlying trend in earnings per share growth.
In corporate finance and financial markets, CoE is often estimated using the single-factor capital asset pricing model (CAPM) or the multi-factor Fama-French model. The CAPM adds to the risk-free rate of return an incremental rate of return investors expect from investing in the equity market multiplied by an investment-specific factor that represents risk that cannot be eliminated through diversification. The Fama-French model is also based on risk but also accounts for firm size and book-to-market ratio. The method described above is an approximation of the CAPM.
Rates of return are ratios of income to assets. In the pharmaceutical industry, there is a long delay between R&D expenses and revenue. Current revenue is generated with products whose R&D was conducted in the past while current R&D cost is related to products that may generate revenue in the future. However, R&D costs are usually recognised as current expenditure and not capitalised. These accounting conventions can lead to divergence between financial statements and the true economic costs and returns of R&D for new products. This may lead to overstatement of current operating expenditure, and therefore understatement of income, and understatement of capital expenditure, and therefore understatement of assets.
Source: DiMasi, Grabowski and Hansen, 2016; Damodaran, 2017; OECD, 2017d, 2017e.
Note: Classification based on the Global Industry Classification Standard (GICS), except the pharma sectors. Both pharma sectors in the figure are part of GICS industry sector Pharmaceuticals and biotechnology. Pharma R&D includes 87 pharmaceutical firms identified by the OECD as R&D-based; Pharma other includes all other firms in the GICS industry sector Pharmaceuticals and biotechnology.
Source: OECD analysis based on Bloomberg World Equity Index (BWEI).
A small number of new medicines account for a large share of industry revenue
Some studies suggest that, among all drugs that receive marketing authorisation, only a small subset achieve significant sales and that average sales per compound have declined in the recent past. In a sample of 466 novel active substances launched in the United States between 1991 and 2009, for example, 50% achieved life-time sales of less than USD 1.5 billion and approximately 10% had sales exceeding USD 10 billion (Berndt et al., 2015). Average life-time sales were lower for compounds launched between 2005 and 2009 than in the period 1991 through 2004 (ibid.). In a cohort of the top 12 - publicly-listed pharmaceutical manufacturers by R&D expenditure in 2008 and 2009,20 the projected and risk-adjusted sales of all compounds in phase 3 trials have declined from USD 800 to USD 400 million between 2010 and 2016 (Deloitte Centre for Health Solutions, 2016). These studies also attempt to estimate the average profitability of the same compounds and also find a declining trend because, while sales are declining, R&D and other costs are not. However, costs in these lifetime net-present-value (NPV) calculations are based on broad assumptions and averages that are not product-specific, so that estimates of profitability are not reliable.21 It is also unclear whether samples are representative of the industry and if the trends identified will continue in the longer run.22
The effective duration of market exclusivity23 has declined slightly
New medicines are shielded from generic competition for a limited period through a combination of patent protection and other forms of exclusivity conferred by regulators. During this period, competition can only arise from the marketing of medicines developed for the same indication by other manufacturers.
The standard term of patent protection in OECD countries is 20 years from the date of filing, but because the time required to develop new products and conduct clinical trials creates a lag of several years between filing of patent applications and product launch, the effective duration of patent protection is often significantly shorter. In most OECD countries, including the United States and countries that are members of the European Union, regulatory frameworks also provide for other forms of protection from competition, usually for a period of time beginning at the point of marketing authorisation. During this period, generics or biosimilars may not rely on the efficacy and safety data submitted in support of the approval of the originator (data exclusivity), or may not be granted marketing approval by the regulator. Market exclusivity differs across products and geographic areas. For example, in EU member countries, new active substances are given market exclusivity for 10 to 11 years (European Commission, 2015). In the United States, new chemical entities are granted 5 years (Kesselheim, Sinha and Avorn, 2017), new indications 3 years, new biologics 12 years, and orphan drugs 7 years. Different periods of exclusivity are also conferred on antibiotics and products for which paediatric trials have been undertaken at the direction of the FDA.
The effective duration of market exclusivity, i.e. the time from marketing authorisation of an originator to entry of the first competing generic or biosimilar product, has slightly declined over time. An analysis of effective market exclusivity of 288 new molecular entities (NMEs) that experienced initial generic entry between 1995 and 2014 in the United States found a slight decline from 13.5 to 12.9 years over that period (Grabowski, Long and Mortimer, 2014; Grabowski et al., 2016). The time from marketing authorisation of new active substances to legal “loss of exclusivity”24 also declined somewhat in the United States, from approximately 14 years for products launched in 1996 to 12 years for products launched in 2015 (QuintilesIMS Institute, 2017). Future loss of exclusivity of the more recently launched products in this sample, however, is subject to some uncertainty since products can obtain extensions of market exclusivity for various reasons.25
The duration of market exclusivity can vary quite significantly between individual products. For instance, oncology drugs, products with annual sales of more than USD 1 billion, and first-in-class drugs had longer duration of effective market exclusivity (QuintilesIMS Institute, 2017), which can reflect a combination of different patenting strategies, expedited regulatory approvals, or differences in development lead times (Kesselheim, Sinha and Avorn, 2017; QuintilesIMS Institute, 2017).
During the period of market exclusivity, medicines may nonetheless face competition from other products approved for the same indication(s). The lag between launches of first-in-class and me-too products appears to have decreased.26 The introduction of me-too drugs can deliver improvements over first-in-class products, expand the range of available therapies and lead to price competition. Recent empirical evidence of the impact of competition in on-patent markets is not available. An analysis of 94 drug classes in which a first-in-class compound and at least one follow-on product developed by another manufacturer were approved in the United States between 1960 and 2003, showed that the average time between approval of the first-in-class and the first follower declined from 3.5 years in the 1980s to 2.7 years in the 1990s. The average time between entry of the first and second follower declined from 2.8 to 2.2 years (DiMasi and Faden, 2011). A further decline was found for the period between 2000 and 2003, albeit based on a small sample (ibid.). However, the effects of oligopolistic competition on prices and volumes seem to vary across therapeutic classes and across countries (see Chapter 1).
New medicines often target small “niche” populations
Scientific opportunities and the development of precision medicine have pushed firms to focus increasingly on new medicines for small populations. Targeted medicines now account for one quarter of FDA approvals and for the majority of approvals in oncology (OECD, 2017c). About 31% of all new active substances launched in the United States between 1996 and 2015 had an orphan indication (QuintilesIMS Institute, 2017). Between 2000 and 2015 the number of new orphan designations in the United States and the European Union has increased steadily (OECD, 2017c). Worldwide, the share of orphan drugs in total sales of branded prescription drugs has increased from 6% in 2000 to over 16% in 2016, and has been projected to reach 21% by 2022 .
References
Access to Medicine Foundation (2016), Access to medicine index, Haarlem, Netherlands, http://accesstomedicineindex.org/report-cards/glaxosmithkline-plc/.
Atal, I. et al. (2018), “A mapping of 115,000 randomized trials revealed a mismatch between research effort and health needs in non–high-income regions”, Journal of Clinical Epidemiology, 98, pp. 123–132, https://doi.org/10.1016/j.jclinepi.2018.01.006.
Atal, I. et al. (2015), “Differential Globalization of Industry- and Non-Industry–Sponsored Clinical Trials”, PLOS ONE, 10(12), p. e0145122, https://doi.org/10.1371/journal.pone.0145122.
Barrenho, E., Miraldo, M. and Smith, P. C. (2017), Does global drug innovation correspond to burden of disease? The neglected diseases in developed and developing countries, London, https://spiral.imperial.ac.uk:8443/bitstream/10044/1/51581/2/Barrenho 2017-07.pdf.
Berndt, E. R. et al. (2015), “Decline In Economic Returns From New Drugs Raises Questions About Sustaining Innovations”, Health Affairs, 34(2), pp. 245–252, https://doi.org/10.1377/hlthaff.2014.1029.
Bloom, N. et al. (2017), Are Ideas Getting Harder to Find?, Stanford, Palo Alto, CA, United States, https://web.stanford.edu/~chadj/IdeaPF.pdf.
Catalá-López, F. et al. (2010), “Does the development of new medicinal products in the European Union address global and regional health concerns?”, Population Health Metrics, 8, pp. 1–10, https://pophealthmetrics.biomedcentral.com/articles/10.1186/1478-7954-8-34.
Chakma, J. et al. (2014), “Asia’s Ascent — Global Trends in Biomedical R&D Expenditures”, New England Journal of Medicine, 370(1), pp. 3–6, https://doi.org/10.1056/NEJMp1311068.
Chakravarthy, R. et al. (2016), “Public- and Private-Sector Contributions to the Research and Development of the Most Transformational Drugs in the Past 25 Years”, Therapeutic Innovation & Regulatory Science, 50(6), pp. 759–768, https://doi.org/10.1177/2168479016648730.
Comanor, W. S. and Scherer, F. M. (2013), “Mergers and innovation in the pharmaceutical industry”, Journal of Health Economics, Elsevier B.V., 32(1), pp. 106–113, https://doi.org/10.1016/j.jhealeco.2012.09.006.
Cummings, J. et al. (2017), “Alzheimer’s disease drug development pipeline: 2017”, Alzheimer’s & Dementia: Translational Research & Clinical Interventions, Elsevier Inc., 3(3), pp. 367–384, https://doi.org/10.1016/j.trci.2017.05.002.
Cummings, J. L., Morstorf, T. and Zhong, K. (2014), “Alzheimer’s disease drug-development pipeline: few candidates, frequent failures”, Alzheimer’s Research & Therapy, 6(4), p. 37, https://doi.org/10.1186/alzrt269.
Damodaran, A. (2017), Financial Ratios and Measures, http://people.stern.nyu.edu/adamodar/New_Home_Page/definitions.html (accessed 5 October 2017).
Deloitte Centre for Health Solutions (2016), Balancing the R&D equation - Measuring the return from pharmaceutical innovation 2016, London, https://www2.deloitte.com/content/dam/Deloitte/uk/Documents/life-sciences-health-care/deloitte-uk-measuring-the-return-pharma-report-2016.pdf.
DiMasi, J. and Faden, L. B. (2011), “Competitiveness in follow-on drug R&D: a race or imitation?”, Nature reviews. Drug discovery, Nature Publishing Group, 10(1), pp. 23–27, https://doi.org/10.1038/nrd3296.
DiMasi, J. A. J., Grabowski, H. H. G. and Hansen, R. W. R. (2016), “Innovation in the pharmaceutical industry: New estimates of R&D costs”, Journal of Health Economics, 47, pp. 20–33, https://doi.org/10.1016/j.jhealeco.2016.01.012.
EFPIA (2016), “The Pharmaceutical Industry in Figures”, European Federation of Pharmaceutical Industries and Associations, Brussels, https://www.efpia.eu/media/219735/efpia-pharmafigures2017_statisticbroch_v04-final.pdf.
EMA (2017a), EU Clinical Trials Register version 2.2, https://www.clinicaltrialsregister.eu/about.html (accessed 13 September 2017).
EMA (2017b), “No of CTs by comm vs non-comm by year and phase”, London.
European Commission (2015), “Marketing authorisation”, in EC Health and Good safety Directorate-General (ed.) Procedures for marketing authorisation - Notice to applicants - Volume 2A, Revision 5, Brussels, https://ec.europa.eu/health/sites/health/files/files/eudralex/vol-2/a/vol2a_chap1_201507.pdf (accessed 29 June 2018).
Evaluate (2017), Orphan Drug Report, 4th Edition – February 2017, London, http://info.evaluategroup.com/rs/607-YGS-364/images/EPOD17.pdf.
Evans, J. A., Shim, J.-M. and Ioannidis, J. P. A. (2014), “Attention to Local Health Burden and the Global Disparity of Health Research”, PLoS ONE, edited by M. Shamji, 9(4), p. e90147, https://doi.org/10.1371/journal.pone.0090147.
Fagnan, D. E. et al. (2013), “Can Financial Engineering Cure Cancer?”, American Economic Review, 103(3), pp. 406–411, https://doi.org/10.1257/aer.103.3.406.
FDA (2017a), 2016 Novel Drugs Summary, https://www.fda.gov/downloads/Drugs/DevelopmentApprovalProcess/DrugInnovation/UCM536693.pdf.
FDA (2017b), Step 3: Clinical Research, https://www.fda.gov/ForPatients/Approvals/Drugs/ucm405622.htm (accessed 5 October 2017).
Fojo, T., Mailankody, S. and Lo, A. (2014), “Unintended Consequences of Expensive Cancer Therapeutics - The Pursuit of Marginal Indications and a Me-Too Mentality That Stifles Innovation and Creativity: The John Conley Lecture”, JAMA Otolaryngology, 140(12), pp. 1225–1236, https://doi.org/10.1001/jamaoto.2014.1570.
Fralick, M., Avorn, J. and Kesselheim, A. S. (2017), “The Price of Crossing the Border for Medications”, New England Journal of Medicine, 377(4), pp. 311–313, https://doi.org/10.1056/NEJMp1704489.
Garber, S. et al. (2014), Redirecting Innovation in U.S. Health Care. Options to Decrease Spending and Increase Value, Santa Monica, CA, https://doi.org/10.1214/07-EJS057.
Grabowski, H. et al. (2016), “Updated trends in US brand-name and generic drug competition”, Journal of Medical Economics, 19(9), pp. 836–844, https://doi.org/10.1080/13696998.2016.1176578.
Grabowski, H., Long, G. and Mortimer, R. (2014), “Recent trends in brand-name and generic drug competition”, Journal of Medical Economics, 17(3), pp. 207–214, https://doi.org/10.3111/13696998.2013.873723.
Hall, A. K. and Carlson, M. R. (2014), “The current status of orphan drug development in Europe and the US”, Intractable & Rare Diseases Research, 3(1), pp. 1–7, https://doi.org/10.5582/irdr.3.1.
Hay, M. et al. (2014), “Clinical development success rates for investigational drugs”, Nature Biotechnology, 32(1), pp. 40–51, https://doi.org/10.1038/nbt.2786.
Hobbs, M. and McCarthy, M. W. (2009), “Clinical trials”, in McCarthy, M. and Kockler, D. R. (eds.), Oxford American Handbook of Clinical Pharmacy, Oxford University Press, Oxford, UK.
IHME (2015), Global Burden of Disease Study 2015, http://ghdx.healthdata.org/gbd-results-tool.
Kesselheim, A. S., Sinha, M. S. and Avorn, J. (2017), “Determinants of Market Exclusivity for Prescription Drugs in the United States”, JAMA Internal Medicine, https://doi.org/10.1001/jamainternmed.2017.4329.
KFF (2016), “Kaiser Health Tracking Poll: November 2016”, Kaiser Family Foundation, Menlo Park, CA, http://files.kff.org/attachment/Kaiser-Health-Tracking-Poll-November-2016-Topline.
Koijen, R. S. J. J., Philipson, T. J. and Uhlig, H. (2016), “Financial Health Economics”, Econometrica, 84(1), pp. 195–242, https://doi.org/10.3386/w20075.
Lincker, H. et al. (2014), “Regulatory watch: Where do new medicines originate from in the EU?”, Nature reviews. Drug discovery, Nature Publishing Group, 13(2), pp. 92–93, https://doi.org/10.1038/nrd4232.
Lo, A. W. and Naraharisetti, S. V (2014), “New Financing Methods in the Biopharma Industry: A Case Study of Royalty Pharma Inc.”, Journal of Investment Management, 12(1), pp. 4–19.
Mayhew, S. (2010), “Deal watch: Trends in discovery externalization”, Nature Reviews Drug Discovery, 9(3), pp. 183–183, https://doi.org/10.1038/nrd3128.
Mestre-Ferrandiz, J., Sussex, J. and Towse, A. (2012), The R&D Cost of a New Medicine, London.
Milken Institute and Faster Cures (2012), Fixes in Financing: Financial Innovations for Translational Research, New York City, NY.
Moran, M. (2005), “A Breakthrough in R&D for Neglected Diseases: New Ways to Get the Drugs We Need”, PLoS Medicine, 2(9), p. e302, https://doi.org/10.1371/journal.pmed.0020302.
Nicholson, S. (2012), “Financing Research and Development”, in The Oxford Handbook of the Economics of the Biopharmaceutical Industry, Oxford University Press, Oxford, UK, pp. 1–33, https://doi.org/10.1093/oxfordhb/9780199742998.013.0003.
NSF (2017a), Survey of Federal Funds for Research and Development, https://ncsesdata.nsf.gov/webcaspar (accessed 11 August 2017).
NSF (2017b), Survey of Research and Development Expenditures at Universities and Colleges/Higher Education Research and Development Survey, https://ncsesdata.nsf.gov/webcaspar (accessed 11 August 2017).
NSF (2016a), A Snapshot of Business R&D Employment in the United States, Nsf 17-302. Arlington, VA, https://www.nsf.gov/statistics/2017/nsf17302/#.
NSF (2016b), Business Research and Development and Innovation Survey (BRDIS), Detailed Statistical Tables NSF 16-313, https://www.nsf.gov/statistics/srvyindustry/#tabs-2 (accessed 11 August 2017).
NSF (2009), Research and Development in Industry: 2004, Detailed Statistical Tables. Arlington, VA, https://wayback.archive-it.org/5902/20160210163454/http://www.nsf.gov/statistics/nsf09301/content.cfm?pub_id=3638&id=3.
NSF (1998), Research and Development in Industry: 1994, Section A. Detailed Statistical Tables, Arlington, VA, https://wayback.archive-it.org/5902/20160211032340/http://www.nsf.gov/statistics/nsf97331/sect_a.pdf.
OECD (2017a), “Annual National Accounts”, OECD, Paris, http://stats.oecd.org.
OECD (2017b), Health at a Glance 2017: OECD Indicators, OECD Publishing, Paris, https://doi.org/10.1787/health_glance-2017-en.
OECD (2017c), New Health Technologies: Managing Access, Value and Sustainability, OECD Publishing, Paris, https://doi.org/10.1787/9789264266438-en.
OECD (2017d), OECD Business and Finance Outlook 2017, OECD Publishing, Paris, https://doi.org/10.1787/9789264274891-en.
OECD (2017e), OECD Business and Finance Scoreboard 2017, OECD Publishing, Paris, http://www.oecd.org/finance/oecd-business-and-finance-scoreboard.htm.
OECD (2017f), “Research and Development Statistics (RDS)”, OECD, Paris, http://www.oecd.org/sti/rds.
OECD (2017g), “STAN STructural ANalysis Database”, OECD, Paris, http://oe.cd/stan.
OECD (2017h), Tackling Wasteful Spending on Health, OECD Publishing, Paris, https://doi.org/10.1787/9789264266414-en.
OECD (2017i), “Value added by activity” (indicator), https://doi.org/10.1787/a8b2bd2b-en.
OECD (2016a), “Antimicrobial Resistance - Policy Insights”, OECD, Paris, https://www.oecd.org/health/health-systems/AMR-Policy-Insights-November2016.pdf.
OECD (2016b), OECD Business and Finance Outlook 2016, OECD Publishing, Paris, https://doi.org/10.1787/9789264257573-en.
OECD (2008), Pharmaceutical Pricing Policies in a Global Market, OECD Health Policy Studies, OECD Publishing, Paris, https://doi.org/10.1787/9789264044159-en.
PhRMA and TEConomy Partners (2016), The Economic Impact of the U.S. Biopharmaceutical Industry: National and State Estimates, Washington, DC, http://phrma-docs.phrma.org/sites/default/files/pdf/biopharmaceuticaul-industry-economic-impact.pdf.
Policy Cures (2015), Neglected Disease Research and Development: The Ebola Effect, Sydney, http://www.policycures.org/downloads/Y8 GFINDER full report web.pdf.
QuintilesIMS Institute (2017), Lifetime Trends in Biopharmaceutical Innovation: Recent Evidence and Implications, Parsippany, NJ, https://www.statnews.com/wp-content/uploads/2017/01/Lifetime_Trends_in_Biopharmaceutical_Innovation.pdf.
Røttingen, J. A. et al. (2013), “Mapping of available health research and development data: what’s there, what’s missing, and what role is there for a global observatory?”, Lancet, 382(9900), pp. 1286–1307, https://doi.org/10.1016/S0140-6736(13)61046-6.
Scannell, J. W. et al. (2012), “Diagnosing the decline in pharmaceutical R&D efficiency”, Nature Reviews Drug Discovery, Nature Publishing Group, 11(3), pp. 191–200, https://doi.org/10.1038/nrd3681.
SSR Health (2016), Biopharmaceutical R & D Productivity, Stamford, CT, United States.
US Department of Health and Human Services (2002), “Guidance for Industry: Special Protocol Assessment”, US Food and Drug Administration, Washington, DC, https://www.fda.gov/downloads/drugs/guidances/ucm080571.pdf.
US NIH (2017a), ClinicalTrials.gov - All Public Data, https://clinicaltrials.gov/AllPublicXML.zip (accessed 18 August 2017).
US NIH (2017b), FDAAA 801 Requirements, https://clinicaltrials.gov/ct2/manage-recs/fdaaa#WhichTrialsMustBeRegistered (accessed 12 September 2017).
WHO (2017), International Clinical Trials Registry Platform (ICTRP) - List By Countries, http://apps.who.int/trialsearch/ListBy.aspx?TypeListing=1 (accessed 18 August 2017).
Wong, C. H., Siah, K. W. and Lo, A. W. (2018), “Estimation of clinical trial success rates and related parameters”, Biostatistics, (February), pp. 1–14, https://doi.org/10.1093/biostatistics/kxx069.
To illustrate the contributions of various sectors to clinical research, this annex presents breakdowns and trends in the number of clinical drug development trials conducted in Europe and the United States by type of sponsoring entity.27
In the United States, 93 018 clinical trials involving a pharmaceutical product were registered with the US NIH between January 2008 and July 2017. The pharmaceutical industry was the lead sponsor of 43% of these trials, the remaining being sponsored by other types of organisations such as hospitals, universities and NGOs (OECD analysis based on US NIH, 2017a). Following a decline in the annual number of trials registered between 2008 and 2013 from approximately 8 700 to 7 700, the number had increased again to 8 800 in 2016 driven by an increase in trials with hospitals, universities, NGOs and others as lead sponsors. The share of trials with industry as lead sponsor has decreased from 57% in 2008 to 40% in 2016 (see Annex Figure 2.A.1).
Among the 79 143 drug and biologics trials that were registered with the NIH and for which information on the development phase was available,28 industry was the lead sponsor of more than 60% of trials in phases 1 and 3. In phases 2 and 4, hospitals, universities, NGO and other organisations were lead sponsors of 54% and 76% of trials respectively, while the industry was lead sponsor of 42% and 23% of trials (Annex Figure 2.A.3). The highest number of trials (28%) was associated with phase 2, followed by phase 1 (26%), phase 3 (19%) and phase 4 (18%) (US NIH, 2017a). Seven percent of trials, spanned both, phases 1 and 2, and 3% phases 2 and 3 (ibid.).
In Europe, 48 867 clinical trials involving patients from the European Economic Area (EEA) were registered in the EudraCT database of the European Medicine Agency between 2004 and 2016, of which 61% had a commercial sponsor (see Annex Figure 2.A.2). The share of industry-sponsored and commercial trails has declined slightly in the past ten years, in both the United States and the EEA (Annex Figure 2.A.1 and Annex Figure 2.A.2). A brief discussion of data on clinical trials is provided in Annex Box 2.A.1.
Since 2007, all trials of drugs and biologics subject to Food and Drug Administration (FDA) regulation, except phase 1 investigations, have to be registered in the clinical trials register of the United States National Institutes of Health (US NIH, 2017b). In September 2016, the United States NIH issued a policy requiring the registration of all trials of FDA-regulated products that receive NIH funding. The register also includes a large number of studies that are not subject to registration requirements and for easy identification of drug-related trials and of the type of primary sponsors.
Between January 2008 and July 2017, 93 018 clinical trials involving a pharmaceutical product were registered with the US NIH and for 79 143 of them, information on the phase (1 to 4) is available). In 37 629 of these trials (48%) industry was the lead sponsor while in 39 304 (50%) a wide range of organisations, including hospitals, universities and NGOs, were the lead sponsor and in 2 210 (3%) the United States government was the lead sponsor. Following a decline in the annual number of trials registered between 2008 and 2013 from approximately 8 700 to 7 700, the number had increased again to 8 800 in 2016 driven by an increase in trials with hospitals, universities, NGOs and others as lead sponsors. The share of trials with industry as lead sponsor has decreased from 57% in 2008 to 40% in 2016 (Annex Figure 2.A.1).
Among the 37,629 industry-sponsored drug and biologics trials that were registered with the NIH between 2008 and July 2017, information on the countries in which patients were recruited were available for 32 973. Of these, 74% recruited patients in OECD countries only and 16% recruited patients in at least one OECD country but also in non-OECD countries. The share of trials recruiting patients in OECD countries only declined from 78% in 2008 to 75% in 2017 while the share of trials recruiting patients in OECD and non-OECD countries declined from 16% to 11%, so that the share of trials recruiting patients in non-OECD countries only increased from 6% in 2008 to 15% in 2017 (Figure 2.6).
The European Medicines Agency (EMA) provides information on all interventional clinical trials on medicines with recruitment sites located in countries of the European Economic Area (EEA) through the EudraCT database. The database categorises trials according to whether the sponsor is a commercial or a non-commercial entity. Between 2004 and 2016, a total of 48 867 trials were registered, of which 29 600 (61%) were commercial and 19 267 (39%) non-commercial. Following an increase in the annual number of trials registered between 2005 and 2007, driven by an increasing number of non-commercial trials, there has been a trend of declining registrations since 2007, with the share of commercial trials remaining at close to 60% (Annex Figure 2.A.2).
Source: EMA, 2017a, 2017b; US NIH, 2017a, 2017b.

Source: OECD analysis based on (US NIH, 2017a).

Source: OECD analysis based on (EMA, 2017b).

Note: Registration of phase 1 trials is not mandatory in many cases, but in September 2016 the NIH issued a policy requiring the registration of all trials of FDA-regulated products that receive NIH funding.
Source: OECD analysis based on US NIH, 2017a.
Source: OECD analysis based on EMA, 2017b.
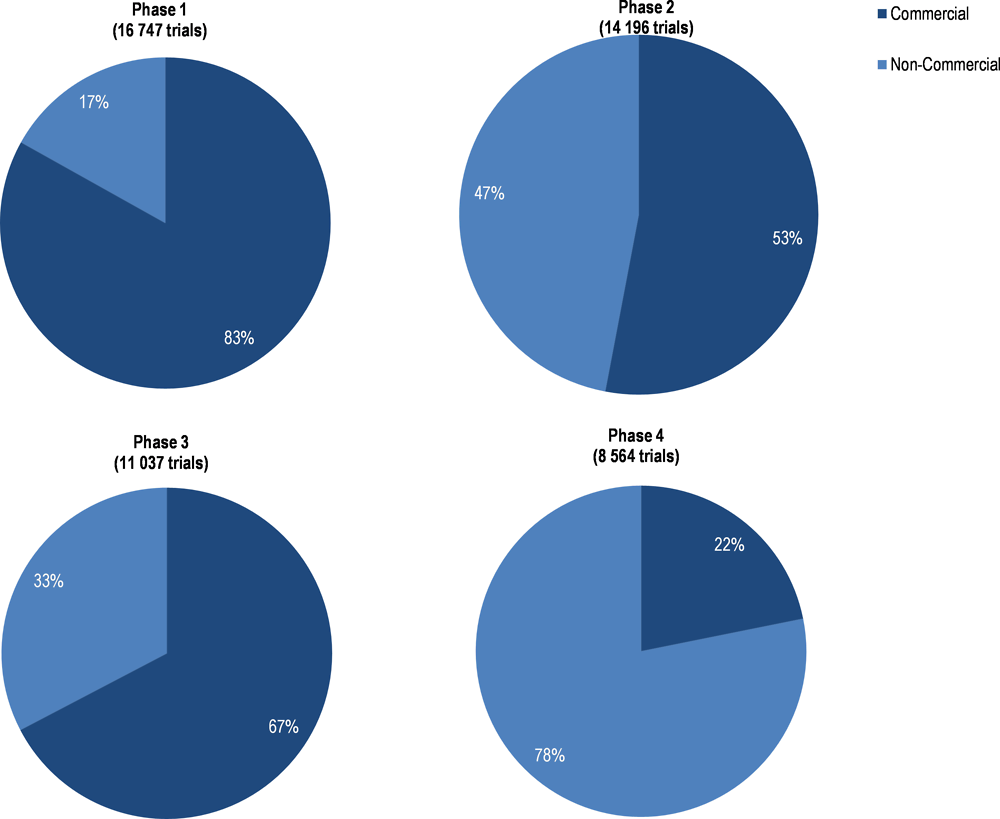
A similar pattern in sponsorship as in the United States is apparent among trials of medicines with recruitment sites located in countries of the EEA. In phases 1 and 3, 83% and 67% of trials were commercial while the split was more balanced in phase 2, where 53% of trials were commercial. In phase 4, 78% of trials were non-commercial (Annex Figure 2.A.4). Among the 48,867 trials between 2005 and 2016, 33% were associated with phase 1, 28% with phase 2, 22% with phase 3 and 17% with phase 4 (EMA, 2017b). This suggests that R&D funded by industry plays a larger role in development phases where success rates are high (refer to Table 2.1).
Notes
← 1. In this report, “market exclusivity” is an umbrella term used to refer to all forms of legal protection from competition by generic or biosimilar products. The nature of the protection arrangements and terminology differ across countries and regions.
← 2. Subject to data availability, using data for 2015 or 2014. No recent data were available for Australia, Canada, Chile, Estonia, Estonia, Hungary, Iceland, Ireland, Israel, Korea, Luxembourg, New Zealand, Sweden and Turkey.
← 3. OECD Structural Analysis (STAN) database, based on Annual National Accounts statistics submitted by national statistics institutes in reply to official OECD surveys. Reflects the number of persons engaged in activity “manufacture of basic pharmaceutical products and pharmaceutical preparations” per the United Nations International Standard Industrial Classification of All Economic Activities (ISIC Rev.4).
← 4. Estimates for the United States are based on the number of persons engaged in the broader activity “manufacture of chemical and pharmaceutical products” per Annual National Accounts statistics and the proportion of persons engaged in its sub-activity “manufacture of basic pharmaceutical products and pharmaceutical preparations”, classified to North American Industry Classification System (NAICS) activity “pharmaceutical and medicine manufacturing” in the United States Census Annual Survey of Manufacturing (ASM). Pharmaceutical Research and Manufacturers of America (PhRMA) estimated that approximately 850,000 persons were directly employed in the pharmaceutical industry in 2014 when also accounting for persons whose activities may be related to pharmaceuticals but are classified in other general categories of NAICS, such as “scientific research and development” or “wholesale and retail trade” (PhRMA and TEConomy Partners, 2016).
← 5. Austria, Czech Republic, France, Italy, Netherlands, Norway, Portugal, Spain and Switzerland using data from between 2012 and 2014.
← 6. The total manufacturing sector includes the pharmaceutical sector.
← 7. The industry classification by the “main activity” of firms results in a number of firms being classified into the ISIC industry category “scientific R&D”, which contains, for example, firms that provide R&D services to pharmaceutical firms but don’t sell pharmaceutical products. Therefore, BERD by main activity may result in underestimating the total amount of R&D spending by industry in a given country. While the problem exists in all countries, it affects countries to different extends. BERD in Belgium, France and the United Kingdom might be significantly underestimated.
← 8. These are general definitions of the three phases of clinical trials that may not fully apply in all cases, for example when research ethics do not allow for testing drugs in healthy humans. Cancer drugs, for example, may have high toxicity and significant side effects that can preclude testing in healthy subjects or in placebo-controlled trials (Hobbs and McCarthy, 2009).
← 9. The lead indication is the one that is advanced the farthest in the clinical development phase, among all indications for which a drug is in clinical trials, i.e. the indication for which the drug is developed first.
← 10. Earlier studies, including Hay et al. 2014, estimated an overall probability of success by first computing, in a separate sample for each phase, a probability of transition to the next phase as the proportion of observed phase transitions, and then multiplying successive transition probabilities. The study by Wong, Siah and Lo, 2018, on the other hand, modelled each individual drug development path (combination of drug and indication) to compute the proportion that make it through from phase 1 to approval. The latter is shown to be more accurate because it considers any path that ends in approval as a success, even if data on success or failure in a prior phase are missing.
← 11. Special protocol assessment (SPA) allows the FDA to review study protocols prior to the initiation of studies required for marketing authorisation and to provide input into the design of these studies to agree with study sponsors on scientific and regulatory requirements to be met (US Department of Health and Human Services, 2002).
← 12. Excluding Latvia, for which no data is available. Using data for 2014 or the nearest year available; 2011 data for Mexico; all other countries 2014 or 2013.
← 13. Data are available from Austria, France, Germany, the Netherlands, Spain or Sweden.
← 14. Excluding Luxembourg, for which no data is available. Using data for 2014 or the nearest year available; 2012 data for Switzerland; all other countries 2014 or 2013.
← 15. Business enterprise expenditure on R&D (BERD) covers R&D carried out by corporations, regardless of the origin of funding. BERD is recorded in the country where the R&D activity took place, not the country providing funding. National statistical agencies collect data primarily through surveys and according to the OECD Frascati Manual but there is some variation in national practices. “Pharmaceutical R&D” refers to BERD by businesses classified in the pharmaceutical industry. Firms can finance R&D from their own resources or receive external funding for R&D. External funding can include, for example, research grants or subsidies.
← 16. See (OECD, 2017h) for a detailed description of challenges and current policies to address this lack of private investments.
← 17. See (Policy Cures, 2015, p. 9)
← 18. African sleeping sickness, buruli ulcer, chagas disease, cysticercosis, dengue fever, dracunculiasis, echinococcosis, fascioliasis, leishmaniasis, lymphatic filariasis, leprosy, malaria, onchocerciasis, rabies, schistosomiasis, soil-transmitted helminths, trachoma, yaws.
← 19. This includes approval of new chemical entities (NCEs) and biologics as well as approval of new formulations or indications, to take into account all types of innovation. It does not include generics.
← 20. Amgen, AstraZeneca, Bristol-Myers Squibb, Eli Lilly, GSK, J&J, Merck, Novartis, Pfizer, Roche, Sanofi and Takeda.
← 21. Assumptions on R&D, production (costs of goods sold – COGS) and sales, general and administrative (SG&A) costs are based on published studies that estimate industry averages, using other samples of compounds and non-disclosed surveys of a subset of manufacturers. The study by (Berndt et al., 2015) assumes an unrealistically high effective tax rate of 30%, based on an estimate from the 1990s, to calculate after-tax costs.
← 22. The same study that followed the cohort of 12 manufacturers also found that, in an extension cohort of 4 other manufacturers (AbbVie, Biogen, Celgene and Gilead), projected and risk-adjusted sales increased from USD 800 million in 2013 to USD 1.1 billion in 2015, before declining again in 2016 to USD 800 billion (Deloitte Centre for Health Solutions, 2016).
← 23. See Note 1.
← 24. In this QuintilesIMS study, loss of exclusivity is defined as, “the latter of either patent expiry or other forms of exclusivity. These forms can include cases where a molecule holds extended exclusivity such as for paediatric indications, or when those molecules are for orphan diseases, or are a new chemical entity.” (QuintilesIMS Institute, 2017, p. 27)
← 25. Medicines which are still protected from generic/biosimilar competition, may be approved for new indications (including paediatric, orphan) and further extend their legal period of exclusivity so that the actual date of loss of exclusivity may differ from the date estimated at the time of the analysis.
← 26. First-in-class drugs use a new and unique mechanism for treating a medical condition (FDA, 2017a), while followers that use the same mechanism are often referred to as me-too drugs.
← 27. Sponsors of clinical trials initiate and take responsibility of the trial. They may receive funding from other entities so and analysis of trials by sponsoring entity does not necessarily reflect the sources of funding.
← 28. No information on the development phase was available for 13 875 of the 93 018 drug and biologics trials registered.