Chapter 1. The continued importance of the “Beyond GDP” Agenda
This chapter looks at what has changed since the 2009 Commission on the Measurement of Economic Performance and Social Progress (Stiglitz-Sen-Fitoussi Commission). It describes the contribution of the High-Level Expert Group on the Measurement of Economic Performance and Social Progress (HLEG) to moving “Beyond GDP” when assessing a country’s health, towards a broader dashboard of indicators that would reflect concerns such as the distribution of well-being and sustainability in all of its dimensions. The challenge is to make the dashboard small enough to be easily comprehensible, but large enough to include a summary of what we care about the most. The chapter argues that what governments measure strongly influences what they do. If they do not regularly include income inequality or economic insecurity in their dashboard of indicators, for example, they may not notice that these are getting worse. The chapter also argues that distorted metrics can lead to misleading assessments, for example when gauging success solely through the lens of GDP while failing to measure the potential environmental damages caused by economic activities
1.1. Introduction
In January 2008, before the Global Financial Crisis, President Sarkozy of France established a Commission to examine the adequacy of our metrics for assessing economic performance and social progress. He, like many others before him, was worried that too much attention was placed on GDP as an over-arching measure of performance. GDP, as we all know, is a measure of the volume of goods and services produced within a country over a given period of time. It is not – as it is often used – a measure of a country’s success.
This is not a new complaint. Just over 50 years ago, Robert Kennedy gave expression to similar concerns:1
Gross National Product counts air pollution and cigarette advertising, and ambulances to clear our highways of carnage. It counts special locks for our doors and the jails for the people who break them. It counts the destruction of the redwood and the loss of our natural wonder in chaotic sprawl. It counts napalm and … nuclear warheads and armored cars for the police to fight the riots in our cities. It counts Whitman’s rifle and Speck’s knife, and the television programs which glorify violence in order to sell toys to our children. Yet the gross national product does not allow for the health of our children, the quality of their education or the joy of their play. It does not include the beauty of our poetry or the strength of our marriages, the intelligence of our public debate or the integrity of our public officials. It measures neither our wit nor our courage, neither our wisdom nor our learning, neither our compassion nor our devotion to our country, it measures everything in short, except that which makes life worthwhile. (Kennedy, 1968)
In spite of its shortcoming as a measure of a country’s success, GDP has remained its key proxy. We take measures like GDP for granted – until they fail us. Much of this book is about the discovery of how this metric has failed us when used for purposes that it was not designed to address, and about what can and is being done to create measures that better reflect changes in economic performance and social progress.
It was not until after the Great Depression that governments started to collect the data necessary to measure GDP. Keynesian economics – which explained the level of economic output in terms of the demand from different sectors of the economy and argued that government action could maintain the economy at full employment – made it imperative to have better indicators in order to assess the state of the economy.2 Two economists, Simon Kuznets, of the University of Pennsylvania, and Richard Stone, of Cambridge University, received Nobel Prizes, in part for their contribution in setting up the System of National Accounts (often abbreviated as SNA) which includes GDP, a concept developed by Kuznets.
For a while, economics students had to learn the ins and outs of these metrics, the assumptions that went into them (and why those assumptions were made) and the limitations of these measures and their uses. GDP and other national accounts indicators became part of the tool kit of economists. Careers were built trying to explain the movements of GDP and to show how these movements could help explain that of other indicators. This trend was reinforced by economists’ growing ability to analyse data statistically, as a result of better computers.
But, as time went by, and as the sophistication of analysing the inter-relationship among different data series increased, the attention paid to the data series themselves, and in particular, to the limitations of GDP as a welfare metric declined. The result was that the reliability and relevance of results of analysis in areas such as macro-economics that were heavily reliant on GDP measures may have declined too. The paradox is that those who built the system knew of its shortcomings and were cautious when using it.3 But as the general understanding of these indicators and their construction diminished, their use became more widespread and their limits were forgotten by most users. While GDP had been designed and used to measure market activity, increasingly it became a thermometer used for assessing the general health of societies.
Simon Kuznets warned against this risk more than 50 years ago:
As a general formula, the desirability of as high and sustained a growth rate as is compatible with the costs that society is willing to bear is valid; but when using it to judge economic problems and policies, distinctions must be kept in mind between quantity and quality of growth, between its costs and returns, and between the short and long run…Given the variety of qualitative content in the overall quantitative rate of economic growth, objectives should be explicit: goals for more “growth” should specify more growth of what and for what. (Kuznets, 1962)4
The issues discussed in this book may, at first sight, appear as technical, and addressed to a narrow field of specialists. But they are not only technical: they go to the root of how our democratic systems function. In the words of President Sarkozy, the goal of the Commission was to address:
A gulf of incomprehension between the expert certain in his knowledge and the citizen whose experience of life is completely out of synch with the story told by the data… nothing is more destructive of democracy… people believe that they are being lied to… that they are being manipulated”. (Stiglitz, Sen and Fitoussi, 2009)5
This gap between the “experts” and the citizen they are supposed to be serving has played an important role in the bitter divisions within society that have been so vividly demonstrated in a number of recent elections. President Sarkozy was thus prescient in drawing attention to the consequences in a democracy of a growing gulf between the statements, assertions and beliefs of the experts and elites, on one side, and the lived experiences of significant numbers of citizens, on the other.
The Commission had as one of its central missions ensuring that our metrics drew our attention to those things that made a difference to people’s lives. One thrust of this book is that, had the recommendations of the Commission been more fully implemented – and some of the issues developed in this volume more fully explored – different policies might have been chosen. There were early warning signs not only of the discontent, but also of the underlying changes in our economy and society that might have been expected to give rise to such discontent. Whether that is so or not, one thing is clear: metrics matter, and in both the financial crisis of 2008 and what some have called the political crisis of 2016, our system of national accounts, centring on GDP, did not give us adequate warning of what was around the corner. Some may say that was not the purpose, that was not what national accounts were designed to do. But surely it would have been good for society to have some well-established and widely used indicators of the major traumas that were about to befall.
1.2. GDP statistics and the Great Recession
Even when focusing on market income, national accounts statistics may sometimes fail to provide the full picture. In September 2008, the United States – and then the world – fell into what has been called the Great Recession, the worst global downturn since the Great Depression 80 years earlier. As the economy was about to slip into recession, leading economists pronounced the economy to be in good health.6 A few years earlier, the long-time head of the US Federal Reserve, Alan Greenspan, dismissed worries about the possibility of a bubble in asset prices by saying that there was just a little “froth”.7 These leading economists had taken the vital signs of the economy and pronounced it fit and healthy.
In retrospect, there were a number of failures. Those in positions of power, who have to decide whether, for instance, to tighten or loosen credit if they judge the economy to be, or about to be, over- or under-heated, rely on a variety of indicators – just like medical doctors take a patient’s pulse, monitor blood pressure, take a blood cell count, look at whether the patient is gaining or losing weight, etc. Indicators that could have provided a warning signal to policy-makers of what was about to happen were, in many cases, available but were not part of a well-established reporting system and were mostly ignored by those who should have noticed. In other cases, these indicators were simply not available – e.g. sectoral accounts and balance sheets, which led (post-crisis) to several initiatives aimed at improving the kind of information available to decision makers.8 In other cases yet, early estimates of GDP failed to provide a sense of the true scale of the recession, and were heavily revised in later periods.9
Most fundamentally, policy-makers ignored these warning signals due to the ideological blinders that prevented them (and their economic advisors) seeing the dangers ahead. They were also reassured by conventional macro-economic models that said that a crisis of such proportions could not happen. They took comfort from past movements in GDP, in the hope that the “Great Moderation” (combining good GDP performance with lack of inflationary pressures) that prevailed before the crisis could extend into the future.
A year later, as GDP began to increase in 2009, President Obama announced that the economy was on the mend, that recovery in the United States had begun. Yet, to the overwhelming majority of Americans, this did not seem to be the case. Again, aggregate economic indicators, such as GDP, seemed out of synch with “the facts on the ground”. What was going on, what was being experienced by most Americans and by most people in the developed world, was not conveyed by the figure that is usually relied upon, GDP.
There were, of course, some simple explanations of this conundrum. One factor was that GDP growth often disproportionally benefitted those at the top of the income scale: in the United States, 91% of all the gains in income in the first three years of recovery (2009-12) is estimated to have gone to the top 1% (Saez, 2016). Thus, in the United States, most households were not experiencing a recovery. There was a similar phenomenon in Europe, more visible in countries most affected by the crisis. In those same three years of supposed recovery, growth in average household income in Europe, as measured in the national accounts, lagged GDP growth;10 while growth in median household income – where 50% of the population is above that level and 50% below – as measured in surveys, lagged average income growth (which was boosted by gains going to a relatively small number of people). No wonder, then, that most people felt that there was no real recovery.
A second factor was that many households lost their home and jobs, and often their hope in the future, in addition to their income. And those who didn’t were fearful of doing so. Income itself does not provide a full summary of the economic anxieties facing individuals.
One clear lesson from the crisis is the need for a broader range of statistics, including more granular data that capture the diverse situations of different groups of the population. GDP, for example, is not constructed to measure the economic situation of individual households. Indeed, if GDP goes up by say 5%, it doesn’t mean that everyone sees their income go up by 5%, nor even that the typical household or person sees his or her income go up by that amount. GDP describes what is happening to total economic production and to the average income generated from this production – whether this income accrues to a few people or many, to residents or foreigners, to households or to firms. Even if the income is going to residents, GDP doesn’t say how this income is distributed among households.
But the US President should have been aware (or been made aware by his economic advisors) that GDP could go up even though the vast majority of people saw no increase in their incomes – if inequality increases enough. And that was precisely what happened in the US “recovery”. The single number, GDP, didn’t adequately summarize what most people were experiencing. So too, when Ireland’s GDP went up 26% in 2015, it wasn’t that the Irish citizens, who had been suffering so much from the euro crisis, suddenly found their worries at an end. Indeed, Irish household disposable income per capita rose by only 2.7% in that year. In this case, the surge in GDP reflected, to a large extent, the transfer of the intellectual property assets of a few multinationals to independent entities in Ireland, which much of the profits generated by these entities transferred abroad rather than benefitting Irish households.11
That GDP didn’t do all that was hoped of it shouldn’t be a surprise: no single number can summarise anything as complex as the economy. Further, an average is just an abstract number for the individuals who are averaged. But there are real consequences of relying on an incomplete set of measures. If the economy is perceived to be well on the road to recovery, based on GDP, one might not take the strong policy measures needed to resuscitate the economy that one would take with metrics that inform on whether most of the population still feels in recession. Nor would one take measures to bolster the safety net and social protection in the absence of metrics on the extent of people’s economic insecurity.
If the measures we rely on are out of synch with how citizens experience their lives, a lack of trust in government will develop. Some would argue this is what happened in the United States and in most other industrialised countries in recent years, when the GDP statistics said the economy was in recovery and yet most people felt otherwise. While other factors might have been at work (Pew Research Center, 2017), the disparity between what was happening on the ground and the announced “recovery” almost surely contributed to the growing lack of trust in governments by so many citizens over this period. Most OECD countries are today facing a “trust crisis”, a crisis that in some cases goes back in time. To give one example, fewer than 20% of Americans trusted their federal government to do what is right most of the time in 2017, as compared to close to 80% in 1964 (Figure 1.1). Data for a broader range of countries show that confidence in national governments, which hovers today around 40% on average across OECD countries, fell by 10 points or more in many of the countries most significantly hit by the crisis (e.g. Greece, Spain and Portugal) while strongly improving in countries that were less affected, such as Germany (OECD, 2017b).12

Note: Before 1985, data were not collected on an annual basis.
Source: Pew Research Center (2015), Historic trends of public trust, www.people-press.org/2015/11/23/1-trust-in-government-1958-2015/.
It was concerns like these that motivated President Sarkozy to establish the Commission. As an elected official, he worried that making claims about how well the economy was doing that did not correspond to what voters were feeling would undermine trust in the government. He worried too about the conflicting signals he was receiving as a public official. He knew that his performance would be graded partly on how well the economy did. But he also knew that voters cared about many other things than GDP – they cared about the quality of their jobs, their housing conditions, the lower opportunities of their children, they cared about pollution, noise and other things that ought to be incorporated in our measures of economic performance and social progress but were not.13
1.3. The Commission and its central recommendations
The Commission, headed by Joseph E. Stiglitz, Amartya Sen and Jean-Paul Fitoussi, consisted of leading economists and other social scientists.14 Their central question was to assess GDP as a measure of performance, to identify its limitations, and to consider how better metrics of well-being and social progress might be constructed. Its recommendations were aimed particularly at statistical agencies and governments, focusing on the need for more data and research. The Commission provided a number of technical suggestions for improvements in our metrics. But at the core of its recommendations was the belief that our measures matter, and that we should move away from over-reliance on GDP when assessing a country’s health, towards a broader dashboard of indicators that would reflect concerns such as the distribution of well-being and sustainability in all of its dimensions.
How large could a dashboard be? As citizens and officials, there are limits to the amount of information that we can absorb and process. The Commission recommended that there should be a relatively small number of indicators (what it called a dashboard), with some of them reflecting how well ordinary citizens were doing (for example, measures of households median income may be a better indicator of the economic well-being of the “typical” person than average income, which can be pulled up by a few people having enormously high incomes) and some measuring sustainability. Economic sustainability is typically captured best by some monetary measure of wealth, but environmental sustainability might be better assessed by using some physical metrics. So too, it made sense to reflect how well society was doing on health by considering physical metrics of longevity and morbidity – not even trying to convert them into some dollar equivalent.
The challenge was to make the dashboard small enough to be easily comprehensible, but large enough to include a summary of what we care about the most.
1.3.1. Measurement matters
We live in a world of metrics, where we are constantly quantifying our progress, our success. What we measure affects what we do. If we measure the wrong thing, we will do the wrong thing. If we don’t measure something, it becomes neglected, as if the problem didn’t exist. If we don’t measure inequality or environmental degradation, we are less likely to attend to these concerns.
Of course, measures will always be imperfect. That’s not the issue. The real question is, are they misleading us? And of course, even if measures are imperfect, we can’t do without them. One can’t imagine flying a plane without a dashboard of instruments, so too we can’t imagine steering an economy without a dashboard of indicators. In a sense, the simple message from the Commission was that we needed a dashboard, that we must understand better each of the dials on the dashboard, and that we need to develop new dials for important problems that are still inadequately measured. To achieve all of this, we need to re-activate a dialogue in society about the final destination of our plane and the greatest risks it faces while heading there.
1.4. An array of problems
As important as metrics are, all metrics are beset by problems. The choice of metrics is part of the debate in many other areas of public and private life. For example, one of the responses to concerns that our schools are not doing what they should be doing is that we need better student assessments. We can then know when we are failing our children. But, putting aside the question of how those assessments are used, the question is what is to be assessed. Standard tests often focus on basic skills, such as reading, writing and arithmetic. However, schooling is about more than that. It teaches social skills – how to get along with others; it teaches basic life skills – to show up on time every morning, to obey orders, to work as a member of a team. And it teaches higher order cognitive skills that may foster creativity. If student testing focuses only on basic skills, teachers will focus on those at the expense of other skills. Overall, schools will perform less well – though they will perform better in the basic skills. Such considerations led to the changes introduced in the well-known OECD Programme for International Student Assessment (PISA) tests. While PISA started in the late 1990s measuring 15 years-old students’ basic skills in reading, science and numeracy, it now also assesses “soft” skills and students’ well-being in school.
1.4.1. A monetary metric
If there were a simple way of converting every aspect of well-being into money we could simply estimate the total money value of well-being. Together with an indication of how this value is distributed, this would provide a clear guide for increasing societal well-being: wherever possible, substitute a higher money metric activity for a lower one. If we had the right information, we might even have a way of incentivising people to do the right thing. In this grand conception, our money metric would reflect not just the market prices of the goods or services produced, but also the intrinsic (social) value of the activity. For example, making shoes that strengthened muscle power (the value of which was not reflected in the market price) would be valued more than one that led to muscle deterioration.
The market economy does something that is almost as spectacular. So long as all firms are small and numerous, and so too are households, and so long as there is no market failure (the exact meaning of which will be elaborated on below) and no externalities, the economy is efficient and maximizes the market value of goods and services produced.15 Thus, if the market value of the goods and services produced increases, aggregate social well-being increases, or so it would seem.
But things are not so simple. One reason is that an economy at different dates has different relative prices and different money prices. The problem of higher money prices (in, say, dollars or euros) is easy to fix. That’s called inflation. When we want to assess changes in the real output, we want to take out the effect of inflation. If, on average, the prices of all goods and services have increased by 3%, we simply reduce the change of nominal GDP by 3%, to get a measure of the change in real GDP. If real GDP has gone up, so has aggregate economic welfare. We have thus created a money-metric of aggregate economic welfare.
Matters are more difficult when there is a change in relative prices, i.e. the price of one good relative to that of another. Economists and statisticians have devised ways of making approximate, but fairly good, estimates of what has happened to real GDP when relative prices change. Typically, prices don’t change very quickly, and so if we assess GDP at annual intervals, the differences in most relative prices will be quite small. We can calculate the value of GDP at time t+1 by using prices at time t. If that value has gone up by, say, 3%, we can say economic welfare has gone up (in our money metric) by a corresponding amount. We compare GDP in 2018 with that in 2007 by performing this exercise every year. The result is called the chain-weighted GDP index.
1.4.2. Beyond mere technical problems
More fundamental problems arise as soon as we depart from the simple model.
For a start, much activity occurs outside the marketplace. Individuals may be given education and health care by the government, and economic production also occurs at home. Market production, on its side, does not always increase people’s economic well-being, as firms may deceive their clients about the value of the goods and services that they sell.
More fundamentally, individuals’ well-being is affected by other factors than economic production and the income generated by it. It is shaped by their sense of security, and their relationship with others, including their employer. The simple economic model also assumes that individuals can “sell” as much labour as they want at the going wage, so that the wage measures the marginal value of leisure (or of time). This, in turn, implies that there is no unemployment, or at least that all unemployment is voluntary – i.e. individuals are indifferent (at the margin) to more leisure or to more work at the going wage – an obviously false assumption.
Further, at any point in time, there are many market failures (failures of markets to produce the fully efficient outcomes associated with the “ideal” textbook competitive market economy with full information) and all lead to market prices that differ from those corresponding to the “intrinsic marginal value” (the value of adding an extra unit) of goods, services and assets that are exchanged. Market failures, externalities and public goods all imply that an economy that maximises the market value of goods and services would not necessarily maximise aggregate social welfare, and that market prices do not adequately reflect either social costs or benefits. These market failures arise from imperfect information, market power, environmental externalities, absence of markets for important risks, public goods, deficiencies in corporate governance and bankruptcy frameworks and a host of other problems. These market failures are pervasive; they represent not a small glitch in economic design but an inherent consequence of, say, the fact that information and knowledge are costly to produce and transmit, or that markets are costly to create and to transact on, or that it is efficient to have certain goods publicly provided or publicly produced. While in some cases, the consequences may be small, in many cases they are of first order importance, not only for ascertaining the efficiency of the economy but also for assessing the adequacy of our standard statistical measures in providing an assessment of the performance of the economy.
When we assess the conditions of the economy as a whole, there are other considerations still: most importantly, the sustainability of the economy. The present generation can be living off inherited riches, leaving nothing to the future. More broadly, societal well-being is about economic, social, and environmental sustainability, none of which is well reflected in GDP.
Finally, as a society, we care about the distribution of well-being. People may prefer patterns of economic growth whose benefits are widely shared to those where benefits are limited to a few or are concentrated among the better off.
There are thus multiple reasons why GDP is not a good measure of societal welfare.
As Kuznets warned, GDP was constructed with a much more modest ambition – measuring the level of market activity. It grew out of the Great Depression to answer a very important question: how could we quantify the loss in economic output that was evidently occurring? Over time, it has expanded into a measure of welfare: of economic welfare first, and of general welfare second. This expansion of the use of GDP is where the problem lies.16
The Commission on the Measurement of Economic Performance and Social Progress, and its successor, the High-Level Expert Group on the Measurement of Economic Performance and Social Progress had as their mission the development of better metrics of economic performance and social progress, improved understanding of the limitations of commonly used metrics like GDP, and enhanced understanding of how these better metrics can lead to better policies.
The Commission looked at long-standing problems, such as the measurement of public services (where individual choices do not reveal information about individual valuations), as well as three areas: the assessment of economic inequalities, sustainability, and quality of life. The latter included the new field of subjective well-being, i.e. metrics derived from surveys administered to individuals in which respondents reflect on their life as a whole or report on their daily experiences. Such surveys have been shown to provide relevant and reliable information about individual’s well-being that is not contained in other metrics, calling attention to aspects of well-being that might otherwise be neglected: the importance of social connections, political voice or quality jobs. For example, we know today that the loss of a job is important for more than just the loss of income that is associated with it, so that even making up for the lost income won’t really restore the individual’s well-being.
Later chapters of this book will look more closely at inequality and sustainability. Here, we simply reiterate their importance: what matters is not just the size of the pie, but how it is divided, the set of ingredients used when preparing it, and whether these ingredients will continue to be available in the future. An economy whose benefits are not widely shared, and where whole industries, occupations and regions are left to suffer, carries within it the germs of its rejection by those who are called to adjust to conditions that are not of their making (Kuznets, 1962). Similarly, an economy whose growth is not sustainable in all its dimensions (economic, social environmental) is stealing from future generations. It is clear, in retrospect, that GDP growth in much of the developed world prior to 2008 was not sustainable. Similarly, it should be clear today that our economic growth is not environmentally sustainable: climate change represents an existential threat. Some elements of our dashboard should have called this to our attention.
1.5. A national dialogue
The Commission report argued that a national dialogue determining what should be included in the dashboard of indicators, and whether existing metrics well reflected what society cares about, is an important part of democratic engagement. Since then, many civil society groups have come forward, urging changes in our measurement system, and many governments have responded through measurement initiatives (see Annex) and by taking steps to anchor well-being indicators in the policy process (see Chapter 4). The response has, in many ways, exceeded what the Commission had anticipated, reflecting growing concerns around the world over issues like income inequality and the environment. The growing participation in the OECD World Fora on “Statistics, Knowledge and Policy”17 which started in 2004 – before the Great Recession and the establishment of the Commission – and continue to be organised periodically by the OECD to promote the “Beyond GDP” agenda, are a testimony to this success.
There is some tension, though, between the desire to have metrics that reflect the particular situation within a country and the need to have metrics that enable cross-country comparisons, i.e. to give a picture of how a country is doing relative to others. Both perspectives are important: we all want to know how well we are doing (in one dimension or another) relative to our past or relative to what is occurring elsewhere. The OECD Better Life Initiative – launched in 201118 in response to the Commission’s recommendations – and its biennial report How’s Life? Measuring Well-being (OECD, 2017a, see Annex), provide a dashboard of well-being indicators that can be compared across OECD member countries. Individual countries have developed their own dashboards, adapting the framework to reflect their specific circumstances.
At the end of the Commission’s term, one of its main recommendations was that more needed to be done at the international level. This message was taken up by the OECD, who took the lead in hosting the follow-on HLEG. But, rather than follow through on the full gamut of issues raised in the Commission report, this Group decided to focus on selected issues that had not been dealt with adequately or fully in the initial report.
Thus, this book and its companion volume (For Good Measure: Advancing Research on Well-being Metrics Beyond GDP), focus on a selected number of topics, many of which are related to each other: the relevance of the “Beyond GDP” agenda for less developed countries; the distribution of household income, consumption and wealth; horizontal inequalities among people sharing common characteristics; inequality of opportunity; subjective well-being; economic insecurity; sustainability; and trust. Some of these issues were not discussed in the Commission’s earlier report, but have since received increasing attention. This is the case, for example, of vulnerability, the risk that an economy (or an individual) could fall into a non-sustainable state, and resilience, the ability of an economy (or an individual) to recover from an adverse shock. Some issues are old but have become an increasing source of concern: GDP growth cannot continue as it is within our planetary boundaries. Global warming and climate change are real and already upon us, with significant well-being impacts from both weather variability and higher average temperatures, and further effects, such as those associated with sea level rise and changing levels of ocean acidity, not far away. Our indicators must account of these realities.
These subjects were chosen in view both of their importance and of the possibility to develop metrics to measure them. Just listing them conveys their richness and importance for the life of people. The fact that standard metrics have not even attempted to capture changes in these variables helps explain our difficulties in understanding our society and its behaviour, and in devising policies that would enhance individual and societal well-being. Several of the topics discussed in this book and the accompanying collection of authored chapters are at the limit of what we can assess with any reasonable degree of confidence. Measurement problems are complex but that is not an excuse: what we measure is a choice, which reflects implicitly our value system. Not measuring something, even if the measurement is imperfect, has consequences, as we have already noted.
One of the objectives of the report of the Commission on the Measurement of Economic Performance and Social Progress was to highlight the role of metrics in policy, and to instigate a more active dialogue between economic theory, statistical practice and economic policy, bringing out more clearly the often implicit assumptions in our statistical practices and their real-world consequences. The same objectives remain central for this book.
1.6. Key changes in the world
The Commission report explained how changes in the economy and society affect both what we want to measure and the adequacy of our metrics. Before the problem of climate change was recognised, there was no reason to measure an economy’s carbon emissions. The report also noted that the changing structure of the economy had led to an increasing reliance on imputations – numbers not directly collected by official statisticians but estimated by them in some indirect way.
Since the publication of the Commission report, there have been several changes that heightened the need for (and shaped thinking concerning) a new report. While the Commission was formed before the Great Recession of 2008, this long and deep recession naturally focused attention on the adequacy of our metric system for assessing the consequences of deep downturns – in some ways, the original mission of the system of national accounts. It also highlighted the importance of metrics of economic sustainability, indicators showing how an economy might be vulnerable to a major shock.
1.6.1. Higher economic insecurity and lower trust
The Great Recession had two follow-on effects: a growth of economic insecurity and an undermining of people’s trust, especially in public institutions (which we have already noted). While the Commission had recognised the importance of insecurity and trust, it hadn’t done much to propose metrics, or even to explore the conceptual underpinnings of such metrics. It was clear, however, that not taking into account economic insecurity left out one of the main adverse effects of the deep downturn. It was also clear that the weakening of people’s trust in public institutions was having social, political and even economic effects that needed attention, even if no commonly accepted measures of trust had yet been developed.
1.6.2. Rising inequalities, global warming and sustainability
Meanwhile, growing concern about rising inequalities and global warming put an even greater emphasis on sustainability, in all of its dimensions. This, in turn, led to the global agreement reached in September 2015 in New York on the Sustainable Development Goals (SDGs), whose overarching objectives are ensuring sustainability and leaving no one behind; and, in December 2015 in Paris, to a common goal of reducing global emissions of greenhouse gases so as to limit the increase in global temperatures to between 1.5 and 2 degrees centigrade.
The SDGs, approved unanimously by the UN General Assembly, were testimony to the power of commonly agreed goals. Fifteen years earlier, the countries of the world had agreed on the Millennium Development Goals (MDGs), a set of goals for reducing extreme poverty by half and raising other aspects of standards of living in developing countries. The attention that the MDGs focused on these commonly agreed goals arguably played a role in the success the international community had in achieving a number of them – though even as they were achieved their limitations were clear: while extreme poverty globally was halved, poverty in Africa remained high. The new SDGs played the role of setting global norms, and not just for developing countries but for developed countries as well.
There were intense fights over what to include and not to include in the SDGs. Every NGO wanted the issues for which they were fighting to be included, possibly in the belief that if only more attention were focused on their objectives, more progress would be made. Thus, attempts were made to include some measure of rule of law or even, more narrowly, land titling. The resulting Agenda 2030 was a mix of “ends” and “means to ends”, since the ends themselves often proved elusive.
One area in which there was a broad consensus was to set a goal on income inequality.19 The MDGs had, as we noted, turned the spotlight on extreme poverty, based on the same income threshold across all countries. But, as the SDGs negotiations unfolded, broader concerns came to the fore, not just about those at the very bottom of the income scale. Some worried about the seeming decrease in equality of opportunity, others about the squeezing of the middle-class, while others argued that the large gap between those at the top and everyone else presented a societal problem. These were all different aspects of the distribution of income. Though no single measure of inequality could capture them all, there was a strong case for including some measure of income inequality.
As Kanbur, Patel, and Stiglitz emphasise in their chapter in the accompanying volume, the demand for comprehensiveness of the SDGs had an adverse effect: some 17 goals, with 169 targets and 232 indicators were eventually listed – too many to be meaningfully comprehended or to be a focus of policy. This was not the narrow dashboard that the Commission had recommended. What this implied, the authors suggest, is that countries needed to select which of the goals to focus on, to make them the object of their efforts over the coming years. For most developing countries, that narrow list would almost surely include some measure of employment, of the environment, and of how well the standard of living of the typical individual was doing – not just GDP. More developed economies are also confronted with the same issue of prioritisation. To help them identify where efforts are most needed, and thus establish a limited set of priorities for policy action, the OECD undertook to develop a tool to assess the distance that countries need to travel to achieve each of the SDG targets.20
Even when the set of goals broadly defined is decided, the choice of metrics can make a difference – another of the messages of the Commission. Within any metric are buried assumptions, often quite subtle, about what is important and what is not. We will discuss the measurement of income inequality more extensively below. Here, we simply note that, over time, the shape of the income distribution can change in many complicated ways. Looking at the number of poor people focuses simply on the fraction of the population below a given monetary threshold. The danger of such a measure is that countries can improve it simply by concentrating attention on those just below the poverty line, pushing them across it. In contrast, the poverty gap measures the depth of poverty, i.e. how much income would have to be increased to move everyone out of poverty. Today, however, there is much concern about the squeezed middle-class, the reduction of median income and the fraction of the population that is near the middle of the distribution, say plus or minus ½ of median income. To capture these concerns, the share of income that is appropriated by those in the central deciles of the income distribution (or the income ratio between those at the 10th or 1st percentile relative to the 50th, showing the gap between the rich and the rest) seems a more appropriate metric. The SDGs rely on a variety of other indicators, e.g. focusing on the share of income going to the bottom 40%. Others, based on the observation that the income share received by the middle-class was quite similar across a large number of countries, argued in favour of the Palma ratio – i.e. the ratio between the income share of the top 10% of the population and that of the bottom 40%.21
While the SDGs are mainly aspirational, they can also be seen as part of an explicit global norm setting. All of us want to be part of a “good” society. No one is sure what that means, but when world leaders collectively decide what it means, as they did through the SDGs, it matters – and it provides a point of entry for concerned citizens to press policy-makers to respect their commitments.
In practice, several countries are today organising their policy agenda around the SDGs,22 especially those goals that are salient to them, such as those concerning poverty, inequality and sustainability. Once national goals have been set, countries will want to know how well they are doing, and whether more resources should be devoted to specific areas such as reducing inequality or promoting sustainability. Part of the answer to the question “how are we doing?” is provided by our metrics. That is why the 232 indicators that were agreed upon as part of the SDGs agenda are so important. Of course, as noted above, this does not mean that each country should use a dashboard of 232 indicators, but rather that it should select a limited subset once it has decided on its policy priorities. Ideally, selecting these goals and targets through an open process to assess what society values would deepen a country’s democracy and enhance solidarity, trust, and social cohesion.
1.6.3. Changes in economic structure
The need for better metrics, particularly on the economic side, is partly related to changes in the structure of our economies. There have been many changes since the system of national accounts was created that affect both its ability to perform its original function – monitoring the state of the market economy – and its usefulness as a measure of economic welfare.
As we observed earlier, the Commission report noted several of these changes. There were, for instance, shifts in many economic activities from the household to the market. As women left the home to work in the labour market, childcare services that previously took place within the home now occurred more frequently within the market. The increase in market activity then exaggerated the growth of production, as it ignored the simultaneous reduction in the production of household services for own use. The benefits of home appliances to welfare may also have been underestimated, because they may have allowed households to enjoy more leisure, whose value is not reflected in GDP. In the United States, the rapid growth of mass incarceration required higher expenditures in prisons that boosted GDP growth but almost surely did not reflect an increase in societal well-being. So too, the weakening of the welfare state and the shift in some advanced countries’ pension systems from defined benefit systems to defined contribution systems has not only made economies less resilient and more vulnerable to shocks, but also increased individuals’ economic insecurity, as risks were transferred from firms and governments to the people themselves. This has increased the importance of incorporating insecurity into our metrics of well-being, as we have done in this book and, more extensively, in the companion volume.
The Commission report noted two further factors. First, housing has become an increasingly important part of GDP, but the value of housing services is largely based on imputations. It is not just that, with owner-occupied housing, housing services are not a market transaction; but that the system of national accounts imputes what the value of those rents would be if owners had rented their house, based on observation of rents for similar dwellings. As imputations take on a more important role in GDP estimates, the extent to which GDP accurately reflects changes in market activity may be reduced.
Second, as goods and services produced by the government are not, for the most part, sold in markets, the value of their output cannot be derived based on market prices but is measured based on the costs of inputs, which in practice are typically limited to labour. Depending on the methodology used for price and volume measurement, this approach risks underestimating GDP growth when the government becomes more efficient in providing these services. When a labour input measure is used to estimate price and volume changes, efficiency gains will lead to a lower volume of output and value added, and to an underestimation of GDP growth. Although several countries are now using output indicators to measure the volume of government non-market production (e.g. for health and education services provided by the government)23, most still rely on labour inputs when measuring the volume of government production. As the size of the government sector increases, this may result in a downward bias in GDP measures.
1.6.4. Digitalisation of the economy
One change in the structure of our economy, particularly notable in the last decade, which was not discussed in the Commission report, is the emergence of the digital economy. Google, Facebook, and other digital firms seem among the most innovative in the world, and they have garnered for themselves a large share of the increase in global stock market value. Other companies report large efficiency gains permitted by digital technologies and algorithms. The success of these firms has led many to conclude that we are in an “innovative era”. Yet, aggregate data covering this “innovative era” suggests no reversal in the longer- term slowdown in productivity growth over the last two to three decades in many advanced economies (Figure 1.2). How do we reconcile being in what some call an unprecedented era of innovation with the slow pace of productivity growth? Gordon (2016) suggests that we are not today in a particularly innovative era: the invention of electricity had far more profound effects on our economy and society than the internet did. Indeed, one could argue that much of the profits of these internet giants, based in large part on advertising revenues, merely reflects a displacing effect (away from traditional forms of media) that has arguably only a minimal net impact on societal well-being. Others have argued that the pace of technological progress has not slowed down, but that adoption requires changes in organisational structures and business models and that productivity growth naturally lags innovations (Brynjolfsson and Mac Afee, 2011; Baily, Manyika and Gupta, 2013).
Some argue that our GDP metrics underestimate the value of the new technologies, because some of their key services are provided for free to users. Google’s search engine, for example, has enormous societal value and yet, because access is free, the value of these services does not directly enter GDP (although their advertising revenues do). There are of course good reasons why the value of these services are not directly included in measures of GDP (Ahmad and Schreyer, 2016). As the search is provided for free, its marginal value is zero, and our system of national accounts values goods at their marginal value (the value of the last unit provided), not incorporating “consumer surplus” (the value of all units consumed up to the last). There are other aspects of new technologies that may be of high value, such as the sense of connectedness provided by social media, which are similarly missed by GDP.
On the other hand, critics point out some of the less positive social impacts of digitalisation, such as societal polarisation and a reduction in people’s attention span. Moreover, at the same time that the new technologies provide services of value, there is a reduction in other services of value, such as those that were previously supplied jointly with print media. Consumers have long been accustomed to free newspapers, investigative reporting and television programmes for example, funded by advertising revenues. That being said, current estimates suggest that the impact of this “exclusion”, at least at present, is not significant and cannot explain the slowdown in productivity growth seen during this “innovative era” (Ahmad, Ribarsky and Reinsdorf, 2017), accounting, at best, for 0.1% per annum of US GDP growth.24 Where potential mismeasurement related to digitalisation may be more important is in the area of prices, particularly in relation to services and new technologies where quality changes rapidly. Even here, however, the impact on real GDP growth and on measures of consumer inflation is estimated at most around 0.2% percentage points per annum (Schreyer and Reinsdorf, 2018).
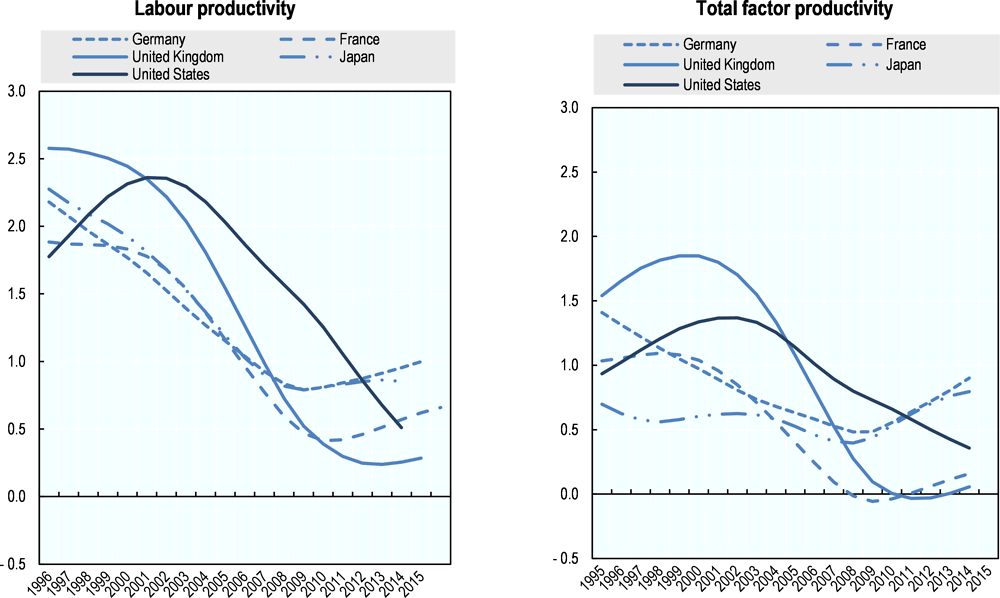
Note: Labour productivity is measured as GDP per hour worked. Trends are estimates using the Hodrick-Prescott filter (OECD, 2018e, OECD Compendium of Productivity Indicators 2018, OECD Publishing, Paris, https://doi.org/10.1787/pdtvy-2018-en).
Source: OECD (2018f), OECD Productivity Statistics (database), https://doi.org/10.1787/pdtvy-data-en.
1.7. Advances in data availability
We have discussed many of the changes in the economy that call for changes in metrics. An important enabler to the development of these new metrics is the availability of new data sets and advances in technology that allow users to rapidly process and analyse large bodies of data and to integrate different data sets. This is a theme that will be repeatedly noted in this book and even more so in its accompanying volume. For instance, indicators of the income of the very rich could be derived from administrative tax returns, and a better picture of the entire income distribution could be achieved by merging numerous administrative data sets (e.g. tax and social security) and survey results. One of the themes explored by the HLEG was the integration of national accounts with distributional data (Distribution National Accounts, or DINA; see Chapter 6 in the companion volume). One of the topics not explored by the HLEG, however, was harnessing the potential of big data, such as scraping data from the internet or exploiting geo-spatial information to form indicators, sometimes in real time. This subject is likely to become of increasing importance in the future – although care is needed to ensure that such data comply to well-established quality criteria such as ensuring that they are representative of the entire population.
1.8. Policy implications of “Beyond GDP” metrics
As we noted earlier, a major impetus for work going “Beyond GDP” was to improve policy: what you measure affects what you do. If you don’t measure important phenomena, you may not act on them. But distorted metrics can be even worse. When economic metrics don’t include the effects of environmental degradation, we have no way of knowing whether a country’s welfare is increasing when it expands coal-generated energy, for example. The owners of coal mines might argue that GDP is being sacrificed in the name of the environment if the coal mine is shut down, when in reality, correctly measured, total welfare would increase when the value of the lost GDP is more than offset by the environmental benefits of cleaner air and reduced risks of climate change. Similarly, a developing country might allow a foreign company to develop a gold mine within its territory, believing that doing so will increase GDP, while a correct account of the impact of the mine on the well-being of the residents in the country might suggest otherwise. In some (but far from all) countries, better metrics than GDP are produced within the system of national accounts – such as measures of national product and national income, sometimes net of the depreciation of capital goods used in production – that would allow better decisions. But these indicators are not routinely used by those making decisions.
Similarly, some may suggest that privatising social security will increase GDP as a result of the increased efficiencies and associated savings by households, while a correct accounting of the value of social security could show that the private sector may in fact be less efficient than the government in providing these services even when the private sector generates profits, and that privatisation may increase individuals’ economic insecurity.
One of the key examples we develop later is that, because GDP metrics do not fully capture all of the adverse effects of economic downturns on people’s well-being, less may have been done by policy-makers to combat the recession than would have been the case had we had relevant additional or better metrics.
1.9. Conclusions
The Commission report, published in English with the title Mismeasuring Our Lives: Why GDP Doesn’t Add Up (Stiglitz et al., 2009),25 not only spurred important work by National Statistical Agencies and academics, but also helped to found a global movement, which has taken the form of Parliamentary Commissions, statistical initiatives involving civil society, and central and local government initiatives to use “Beyond GDP” metrics in their policy determinations. At the international level, one key set of moments of this global movement is represented by the periodic World Fora on “Statistics, Knowledge and Policy” organised by the OECD, bringing together civil society, academics, national statisticians and government officials to move forward the “Beyond GDP” agenda. There have been conferences in Palermo in 2004, in Istanbul in 2007, in Busan in 2009, in New Delhi in 2012, in Guadalajara in 2015, and in Incheon in 2018 (where we are launching this book), with each meeting gathering more people than the previous one.
A key change that has occurred since the Commission report is the broader acceptance of the need to develop measures of societal welfare, and a stronger appreciation that policies based narrowly on increasing GDP may be misguided.
There were multiple reasons for this increased interest. Environmentalists worried that a focus on GDP resulted in inadequate attention to the environment. And for good reason: current GDP measures pay no attention to resource depletion or environmental degradation. Stiglitz’s experience as a member of the US Council of Economic Advisers under President Clinton is telling. Working with the Under-Secretary of Commerce, he pushed to expand conventional GDP towards a metric of “green GDP”, including resource depletion and environmental degradation. Increased coal production might add to conventionally measured GDP, but that does not take account of the adverse effects on health from the increased air pollution, or on climate change or on the local environment. Perhaps not surprisingly, the coal lobby struck back, and Congress threatened to cut off financing to the federal agencies undertaking this work if they continued to develop these metrics. These responses made it clear that the coal industry itself believed that what a country measures affects what it does. If a country measures environmental degradation, it is more likely it will do something about it. And that is precisely what the politicians from the coal states did not want to happen.
The same applies in other fields. Those who worried about climate change expressed concerns about the absence of measures on sustainability and resilience – and argued that, without such measures, we would pay insufficient attention to these key attributes of a good economic system.
Those who wanted more active government policies – sometimes involving higher public expenditures – also wanted a change in metrics. As the next Chapter will make clear, the costs of recession are not fully captured by GDP. By understating these costs, one is less likely to take strong counter-measures. So too, a focus on government liabilities, without looking at assets, induces excessive conservatism in government borrowing in a recession.
Those who were concerned about social justice, about inequality of outcomes and of opportunity, worried that the focus on GDP had resulted in insufficient attention to “how the pie was sliced”. Countries where GDP was increasing but where most people were not doing well were rated as performing as well as those where the benefits of GDP growth were more equally shared. They should not have been.
All these reasons have translated into large number of measurement initiatives, at both the domestic and international levels. When presenting the Commission report in 2009, President Sarkozy asked INSEE, the French National Statistical Office, to ensure the implementation of the Commission’s recommendations at the national level, and the OECD to do the same at the international one, as well as committing his government to bring the Commission’s arguments to the attention of the whole international community.26 The response by the statistical community has gone beyond our expectations, and explains the presence of several official statisticians in the HLEG. These statistical initiatives (which are described in more detail in the Annex) have followed a double track. On the one side, they aimed at making better use of statistics that already existed (e.g. on household living standards, inequalities, environmental pressures), bringing them together into dashboards aimed at providing a comprehensive picture of current well-being and of its sustainability. On the other side, they aimed at building the foundations for new and better statistics on the many aspects of concern to people and communities that are still inadequately covered by official statistics. Progress in both directions is needed to meet the Commission’s goal to shift the focus of our statistical system from measuring the volume of economic production to measuring the conditions of people “here and now” and assuring their sustainability tomorrow.
The response to the Commission report has also gone beyond the development of new metrics, to explore ways of making systematic use of these metrics directly in the policy process. As highlighted in Chapter 4, having a dashboard of well-being indicators is, in some cases, not enough. What is needed are institutional tools to force public agencies to act based on the evidence provided by these indicators, and to overcome the silo thinking whereby each agency pursues its own narrow goal, without paying attention to how their actions impact on the goal pursued by other government departments and with unintended negative effects being recognised only after the damage has been done. In some countries (e.g. France, Italy), national parliaments, assigned the task of allocating budgets, have pushed for better metrics, because they worried that inadequate metrics would induce wrong budgetary allocations. In others (e.g. New Zealand) it was Treasuries who took the lead in developing broad frameworks – encompassing sustainability, inequalities and risks – as tools to help their officials when designing policy reforms or providing advice to other government departments. In other countries yet, policy use of well-being metrics has focused on aligning priorities and actions across government departments and levels of administration (Scotland) and on identifying “what works best” in achieving specific goals (the United Kingdom), leveraging the initiatives of various public agencies and actors in the pursuit of higher level goals.
While all these initiatives, which are described in more detail in Chapter 4, are fairly recent, they share a common ambition: to anchor in policy practice societal concerns that currently don’t receive the attention they deserve by policy-makers. The hope is that a discussion of measurement would lead to more democratic engagement around the central questions facing all societies. What do we value? What should we measure? What should we pay more attention to?
Notes
← 1. Speech at University of Kansas, March 18, 1968.
← 2. The picture of the state of the economy provided by these early GDP estimates came as a shock to observers who had, until then, relied on partial data on production, employment and sales for different industries and regions: For the United States “the volume of net income paid out to individuals shrank by 40% during this (1929-32) three year period” (US Congress, 1934).
← 3. The joke of Paul Samuelson is famous: “what happens to GDP when a professor marries his servant?”
← 4. In the same article, Simon Kuznets – moving from the observation that “no one would welcome an acceleration of the overall rate of economic growth that was associated primarily with a market increase in defence expenditure” – argued that “effort must be exerted to formulate a consensus (on a list of desirable contents of economic growth, omitting the vulgar, the frivolous and the dangerous)... and to reformulate it in response to changing conditions” (Kuznets, 1962).
← 5. Speech at the University La Sorbonne in Paris, 14 September 2009, for the launch of the Commission’s report.
← 6. On 15 October 2007, commenting on “The Recent Financial Turmoil and its Economic and Financial Consequences” at the Economic Club in New York, Ben Bernake (Chair of the US Federal Reserve from 2006 to 2014) noted that: “the financial system entered the episode of the past few months with strong capital positions and a robust infrastructure. The banking system is healthy. Despite a few notable failures, hedge funds overall seem to have held up well, and their counterparties have not sustained material losses. The clearing and settlement infrastructure generally worked well despite trading volumes that were extremely high in some cases. Nevertheless, the market strains were serious… and they posed risks to the broader economy” (www.federalreserve.gov/newsevents/speech/bernanke20071015a.htm). In August 2008, Olivier Blanchard – who was to take up his role as IMF chief economist on the following month – wrote about the state of macro-economics as a field to conclude “The state of macro is good” (Blanchard, 2009). This was just as the economics profession as a whole failed to anticipate the most significant macro-economic event in three-quarters of a century, with the dominant DSGE (dynamic stochastic general equilibrium) model saying that a crisis of such features and proportion couldn’t or wouldn’t happen. They were unable to provide the analytic framework to address the crisis, including answering key policy questions. It was a financial crisis, and yet in the standard DSGE model the banking system, the wider financial system, credit rationing, or liquidity made no significant appearance. Perhaps even more remarkable, after the depth and severity of the crisis became apparent, Bernanke would write that there had been nothing wrong with the underlying models, only with their implementation (Lectures at Princeton University, Bernanke, 2014).
← 7. Comments made by Alan Greenspan at the Economic Club of New York on 20 May 2005. Greenspan also noted: “Without calling the overall national issue a bubble it’s pretty clear that it’s an unsustainable underlying pattern”, with “a lot of local bubbles” around the country (www.federalreserve.gov/boarddocs/speeches/2005/200505202/default.htm).
← 8. The need to develop data on institutional balance sheets was recognised by the G20 as part of the G20 Data Gap Initiative led by the IMF and the Financial Stability Board and implemented by several international organisations. The G20 Data Gap Initiative includes 23 recommendations. Recommendation II.8 (on sectoral accounts, including “from-whom-to-whom” information, i.e. financial relations by sector of origin and destination) and recommendation II.9 (which is about incorporating information on distribution in the system of national accounts household account) are led by the OECD.
← 9. US quarterly GDP growth for the 3rd and 4th quarter of 2009, which was originally estimated by the Bureau of Economic Analysis at -0.5% (actual rate) was revised downwards 3 years later (in steps) to -1.6%. The final estimate for average GDP growth over these two quarters was finally set at -1.3%.
← 10. In the euro area, GDP per capita increased by a cumulative 0.7% from 2009 to 2012, while household disposable income per capita fell over the same period by -0.7%, i.e. a gap of 1.8 point. The gap was larger in countries most affected by the Great Recession (e.g. in Spain real GDP contracted over the same period by -1.6% while household income fell by -3.6%) while it had the opposite sign in a few OECD countries – e.g. in the US, growth of real household income (at 1.5%) slightly exceed that of real GDP (at 1.3%).
← 11. The transfer of intellectual property assets within multinational enterprises was significantly incentivised by Ireland’s favourable tax system.
← 12. There were many other factors contributing to the growing lack of trust, and there are, to our knowledge, no good studies parsing out the relative role of these factors. For instance, many commentators cite the lack of accountability of the bankers who were viewed as causing the crisis – the bailouts centred on the banks rather than helping those who had suffered from predatory lending. Thus, there was a sense that the decisions about the response to the crisis were often in the hands of the very people who had brought on the crisis. This increased the sense that people have little control over what their government does: on average, only one third of people in OECD countries feel that they have some influence on what their government does (OECD, 2017b, p. 183). For a more extensive discussion of trust, see Chapter 10 by Yann Algan in the companion volume and Chapter 3 in this volume.
← 13. The Commission had as one of its central missions ensuring that our metrics drew our attention to those things that made a difference in the lives of ordinary people.
← 14. The members of the Commission were Bina Agarwal, University of Delhi; Kenneth J. Arrow, Stanford University; Anthony B. Atkinson, Nuffield College, Oxford; François Bourguignon, Paris School of Economics; Jean-Philippe Cotis, Insee; Angus S. Deaton, Princeton University; Kemal Dervis, UNPD ; Marc Fleurbaey, Université Paris 5 ; Nancy Folbre, University of Massachusetts ; Jean Gadrey, Université de Lille ; Enrico Giovannini, OECD; Roger Guesnerie, Collège de France, Paris; James J. Heckman, Chicago University; Geoffrey Heal, Columbia University; Claude Henry, Sciences-Po/Columbia University; Daniel Kahneman, Princeton University; Alan B. Krueger, Princeton University; Andrew J. Oswald, University of Warwick; Robert D. Putnam, Harvard University; Nick Stern, London School of Economics; Cass Sunstein, University of Chicago; and Philippe Weil, Sciences-Po, Paris.
← 15. Assuming that there exist complete markets for future goods as well.
← 16. Abramovitz (1959) noted that: “Since Pigou … economists have generally distinguished between ... welfare at large, and the narrower concept of economic welfare”, with “national product taken to be the objective and measurable counterpart of economic welfare”. Easterlin (1974) further noted that Arthur Pigou first expressed the “clear presumption that changes in economic welfare indicate changes in social welfare in the same direction, if not in the same degree”.
← 17. www.oecd-6wf.go.kr/eng/main.do.
← 18. www.oecd.org/statistics/better-life-initiative.htm.
← 19. In his final State of the Union Address in 2016, President Obama described rising income inequality as the “defining challenge of our time” (www.nytimes.com/2016/01/13/us/politics/obama-2016-sotu-transcript.html).
← 20. www.oecd.org/sdd/measuring-distance-to-the-sdgs-targets.htm.
← 21. See Doyle and Stiglitz (2014). Condensed and reprinted in Ministers Reference Book Commonwealth 2015, London: Henley Media Group, pp. 86-88.
← 22. See for example the Slovenian National Development Strategy: www.vlada.si/en/projects/slovenian_development_strategy_2030/.
← 23. Within Europe, several Statistical Offices have taken steps to account for “quality changes” in the volume measures for various types of government services (Eurostat, 2016).
← 24. This work is being pursued through a collaboration between the OECD and IMF.
← 25. Also published in French by Odile Jacob under the title Richesse des nations et bien-être des individus, in Chinese (reduced version) by Xinhua, in Italian by Etas, in Korean by Dongnyok, and in Spanish by RBA.
← 26. Following the French initiative, the G20 Leaders released a statement in Pittsburgh (November 2009) and Toronto (June 2010) encouraging “work on measurement methods so as to better take into account the social and environmental dimensions of economic development”. In Europe, the EU Commission issued a communication to the European Council and Parliament in 2009 on “GDP and beyond: Measuring progress in a changing world”, which referred to the Commission report. This communication identified five concrete actions aimed at: 1) complementing GDP with better environmental and social indicators; 2) developing (near) real time information for decision making; 3) reporting more accurate information on distribution and inequalities; 4) developing a European scoreboard on sustainable development; and 5) extending the National Accounts to cover environmental and social issues.