Chapter 7. Understanding subjective well-being
This chapter evaluates progress in measuring subjective well-being since the 2009 Stiglitz-Sen-Fitoussi Report. It summarises approaches based on evaluative measures, experiential well-being and eudaimonia (the extent to which a person believes that his or her life has meaning and purpose). It notes a tremendous uptake of subjective well-being measures by national statistical offices since 2009, and the growth in research on subjective well-being in the scientific literature. The chapter takes stock of what we have learned from global analyses of social and economic progress “Beyond GDP” since 2009, including through the UN World Happiness Report, the US National Academy of Science Report on Measuring Subjective Well-Being, the OECD “How’s Life?” series and its Better Life Initiative. It also describes progress in acquiring new knowledge about subjective well-being and progress in applying this to policy. The chapter identifies some of the key issues that will need to be addressed to gain a more complete understanding of subjective well-being, including causality and data collection.
Arthur A. Stone is Professor of Psychology, Economics, and Public Policy at the University of Southern California and Alan B. Krueger is Bendheim Professor of Economics and Public Affairs at Princeton University. The authors wish to thank all members of the HLEG, many of whom contributed sections to this report. They especially thank Prof. Sir Angus Deaton for his contributions. At the OECD, Carrie Exton also provided sections for the report and did extensive editing. Finally, the authors thank the participants to the HLEG workshop on “Multi-dimensional Subjective Well-being” held in Turin, Italy on 30-31 October 2014, organised in collaboration with the OECD, the International Herbert A. Simon Society and Collegio Carlo Alberto, and with the financial support of the Compagnia di San Paolo.
The opinions expressed and arguments employed in the contributions below are those of the author(s) and do not necessarily reflect the official views of the OECD or of the governments of its member countries.
7.1. Introduction
Extensive progress has been made in collecting, analysing and improving subjective well-being data since the Stiglitz, Sen, Fitoussi Report was published in 2009. Many National Statistical Offices (NSOs) have already invested in ambitious measurement programmes, and these are yielding important insights into the relationship between subjective well-being and a wide variety of characteristics and experiences.
Measures of subjective well-being (Box 7.1) ask individuals to self-report ratings of aspects of their lives, including satisfaction with their life as a whole, their feelings at a particular moment, or the extent to which they feel that their lives have meaning or purpose. These measures focus on what people believe and report feeling, not their objective conditions, although they can be related to objective conditions. Thanks to large investments on the part of NSOs and governmental research agencies such as the US National Institute on Aging, there is today growing evidence to support the idea that these measures can be the basis of useful indicators of individual and societal welfare, and that they provide relevant information that is not reflected in more conventional economic statistics such as GDP. Of course, these more conventional statistics also capture information that subjective well-being measures do not.
On an individual level, subjective well-being data give insight into the way that people learn, work, and live, and what makes their lives satisfactory and happy, or what causes them pain and stress. There is now an increasing consensus that broader measures of societal progress should take into account how people feel about and experience their own lives, alongside information about their objective conditions. At a social level, subjective well-being measures are potentially powerful indicators that can signal wider problems in people’s lives, capture prevailing sentiment, and predict behaviour. For example, one recent study (Ward, 2015) shows that subjective well-being measures can predict voting behaviour – even more effectively, in fact, than macro-economic variables. Subjective well-being measures can also be significant predictors of future health outcomes (Steptoe, Deaton and Stone, 2015) and yield new insights that challenge our intuitive understanding of the world. For example, many studies have shown that in advanced, English-speaking Western countries evaluative subjective well-being improves after middle age when we might have expected a decline due to higher rates of disease at older ages (Stone et al., 2010). Another surprising finding is that the impact of income differentially impacts evaluative and experiential well-being. At lower levels of income, there is a positive association between money income and subjective well-being, while at higher levels, only evaluative well-being is associated with income, whereas experiential well-being is not (Kahneman and Deaton, 2010).
Advances in research are facilitating the use of subjective well-being data in the public and private sectors. For example, businesses routinely access the satisfaction of their employees and customers; and “big data” on consumers’ ratings and choices are used to recommend products to purchase, movies to watch, and music to listen to.
The rapid progress achieved in the use of subjective well-being data since SSF in 2009 suggests that there is much more to learn and that this work should continue. Larger databases of harmonised subjective well-being data, and panel data that connect subjective well-being indicators to observed outcomes, are needed to reach conclusions about how these measures can most effectively be used – so collection of subjective well-being data requires continued support and commitment. Such support will also depend on demonstrating the usefulness of these measures, which is already being done by several promising initiatives, policy applications, and societal indicators.
7.1.1. Progress in measuring subjective well-being since the 2009 Stiglitz-Sen-Fitoussi Report
There has been dramatic progress in terms of both methodology and availability of subjective well-being data today relative to 5 years ago, and the report of the Stiglitz-Sen-Fitoussi Commission (2009) was a catalyst for much of this progress.
“Subjective well-being” is subjective, that is, it is based on a person’s self-reports of their beliefs and feelings. In this respect, it differs from objective well-being measures that might include observable health or material outcomes. A subjective well-being measure is one for which there is no obvious reference point that an external observer can use to evaluate a person’s self-report.
Broadly speaking, there are three types of subjective well-being measures:
-
Evaluative measures require a person to reflect upon and evaluate his or her life (or some aspect of it, such as health). This is often measured using questions such as: “The following question asks how satisfied you feel, on a scale from 0 to 10. Zero means you feel ‘not at all satisfied’ and 10 means you feel ‘completely satisfied’. Overall, how satisfied are you with life as a whole these days?” (OECD, 2013). There are other evaluative measures including the Cantril Ladder and Diener’s multi-item scale (Diener, 1984).
-
Experiential well-being is the measure of someone’s feelings, states and emotions, e.g. happiness, stress, pain or sadness. These measures are optimally assessed at a given moment or over the course of a day, though longer recall periods are sometimes used (which may yield a more evaluative than experiential measure). This is often called “hedonic” well-being or “affect”, though this report uses the broader term “experiential” well-being, which goes beyond purely affective states and includes pain and other miseries (Stone and Mackie, 2015). The rationale for this extension of hedonic well-being is that misery and pain are an important part of our momentary experience of life, and concepts that fit into the broader experiential well-being construct. These concepts are often measured using questions (in daily assessment) such as, “On a scale from 0 to 10, where 0 means you did not experience the emotion at all, and 10 means that you experienced the emotion all the time, how much [enjoyment/stress/anger...] did you feel yesterday?” (Stone and Mackie, 2015). An advantage of collecting experiential data in real-time is that the reports can be linked to objective data on time-use as well as activities and resources. For example, feelings can be related to the type of activity individuals engaged in at the time (e.g. TV watching) and resources available (e.g. the size of the TV).
-
Eudaimonia is the extent to which a person believes that his or her life has meaning and purpose (Ryff, 2014), but can also refer to other psychological states such as the idea of flourishing or thriving. Although scales of eudaimonia are available, recent national data collections have included questions such as: “Overall, to what extent do you feel that the things you do in your life are worthwhile?” (OECD, 2013), with responses given on a 0 to 10 scale where zero denotes “not at all worthwhile” and 10 denotes “completely worthwhile”. There are also multi-item scales available.
Life evaluation (or life satisfaction) and experiential or hedonic well-being (both positive and negative) were described in Diener (1984). Eudaimonia is a term that has come into common use since the publication of the first Stiglitz-Sen-Fitoussi report to describe aspects of people’s psychological functioning not falling under Diener’s definition: see OECD (2013) for further information.
We must be clear when speaking of “subjective well-being” to specify exactly which type of subjective well-being we mean, because the determinants and correlates differ among the measures. It is also apparent that confusion ensues when authors or policy-makers use the term “happiness” without saying which aspect of subjective well-being they have measured – sometimes they mean evaluative well-being, other times experiential well-being, and occasionally a mixture of the two.
There has been a tremendous uptake of subjective well-being measures by NSOs, but there has also been growth in research on subjective well-being in the scientific literature. Box 7.2 provides a sampling of the breadth of scientific questions where subjective well-being was a major predictor or outcome in articles published in 2015 from the Web of Science (partial listing). There has also been much progress in the theoretical understanding of the use of subjective well-being as a national indicator (e.g., Benjamin et al., 2014; Fleurbaey and Blanchet, 2013).
-
Subjective well-being as a predictor of childbearing behaviour and fertility decisions (Aassve, Arpino and Balbo, 2015)
-
How subjective well-being is linked to the “dark triad” of narcissism, psychopathy and Machiavellianism (Aghababaei and Błachnio, 2015)
-
Reasons for the decline of subjective well-being in China (Graham, Zhou and Zhang, 2015)
-
The link between subjective well-being and access to a cash margin among adult Swedes (Berlin and Kaunitz, 2015)
-
Subjective well-being as a measure to assess suffering in cancer patients (Anglim et al., 2015)
-
The subjective well-being of rural Anglican clergy (Brewster, 2015)
-
Subjective well-being as a proxy for valuing health status (Brown, 2015)
-
How subjective well-being is linked to trust and social cohesion (Cramm and Nieboer, 2015)
-
The prediction of later life subjective well-being from early life experiential well-being (Coffey, Warren and Gottfried, 2015)
-
How different types of subjective well-being vary by age and their association with survival at older ages (Steptoe, Deaton and Stone, 2015)
-
How homeostatic processes may produce stable levels of subjective well-being (Cummins et al., 2015)
-
Subjective well-being as a predictor of self-esteem in head and neck cancer patients (Devins et al., 2015)
-
Subjective well-being as a moderator in the association of emotion and stress (Extremera and Rey, 2015)
-
The impact of caring of a family member on the subjective well-being of Japanese adults (Niimi, 2015)
-
The impact of a comprehensive treatment on the subjective well-being of autistic young adults (Gal et al., 2015)
-
Subjective well-being as a correlate of workplace air and noise pollution (García-Mainar, Montuenga and Navarro-Paniagua, 2015)
-
Classroom teacher connectedness as a predictor for students’ subjective well-being (García-Moya et al., 2015)
-
Subjective well-being as means to evaluating efforts to cope with unemployment (Hahn et al., 2015)
-
Subjective well-being data as a tool for assessing workplace conditions in Spain (Garcia-Mainar et al., 2015)
-
Comparing the subjective well-being of Mexican immigrants with native born Mexican Americans (Cuellar, Bastida and Braccio, 2015)
-
The impact of employment on the subjective well-being of older Korean immigrants’ living in the United States (Kim et al., 2015)
-
The impact of daily energy management by employees on their subjective well-being (Kinnunen et al., 2015)
-
Using subjective well-being data to explore social networks amongst older Japanese people (Saito et al., 2015)
-
The association between health and subjective well-being among Europeans (Read et al., 2015)
-
The relationship between locus of control and cell phone use to subjective well-being (Li, Lepp and Barkley, 2015)
-
Attitudes of older caregivers and their impact on their subjective well-being (Loi et al. 2015)
-
Grand-parenting and its effects on subjective well-being (Muller and Litwin, 2015)
-
Gender differences and subjective well-being (Meisenberg and Woodley, 2015)
-
The correlation of immunological markers and subjective well-being in HIV patients in Uganda (Mwesigire et al., 2015)
-
The correlation between academic performance and subjective well-being in adolescents (Steinmayr et al., 2015)
-
How living with parents affects the subjective well-being of young adults (Nikolaev, 2015)
-
The impact of smoking laws on subjective well-being (Odermatt and Stutzer, 2015)
-
Self-control and emotion regulation as predictors of subjective well-being (Ouyang et al., 2015)
-
Female infertility and self-compassion as predictors of subjective well-being (Raque-Bogdan and Hoffman, 2015)
-
The association between Body Mass Index and subjective well-being (Linna et al., 2013)
-
The effects of labour market policies on the subjective well-being of the unemployed (Sage, 2015)
-
The effects of indoor cleaning on subjective well-being in Japan (Shiue, 2015)
-
Evaluating the impact of public parks on subjective well-being (Woodhouse et al., 2015)
-
The impact of bright lights on subjective well-being (Stemer et al., 2015)
-
The impact of plant closures on the subjective well-being of workers in Sweden (Stengard et al., 2015)
-
The association between crime rates and subjective well-being in former Soviet countries (Stickley et al., 2015)
-
The link between natural disasters and subjective well-being (Tiefenbach and Kohlbacker, 2015)
-
The link between time spent exercising and subjective well-being (Wicker, Coates and Breuer, 2015)
-
The impact of technological improvements on subjective well-being (Zagonari, 2015)
-
Subjective well-being as a moderator of cortisol secretion (Zilioli, Imami and Slatcher, 2015)
National Statistical Office data collection
The availability of survey data on subjective well-being, including panel data, has increased at a rapid pace. National Statistical Offices (NSOs) are increasingly including subjective well-being questions in their surveys, and a majority of OECD countries now collect at least some subjective well-being data (Table 7.1). For example, NSOs in all but one OECD country have collected life evaluation data in recent years, and more than three-quarters of NSOs have collected some data on aspects of eudaimonia and experiential well-being.1 This represents very significant progress since 2009. The OECD Guidelines on Measuring Subjective Well-Being (OECD, 2013), which provide clear directions and proposed modules for including subjective well-being questions in surveys, have galvanised this movement. Nevertheless, in some cases different measurement approaches continue to be adopted, particularly with regard to eudaimonia and experiential well-being, where broad consensus on best practice is still lacking. To ensure greater comparability and take-up of the data, further work is needed to co-ordinate and harmonise measurement efforts across countries, and to increase the frequency with which data are collected (see Exton, Siegerink and Smith (2018), for a review of recent progress).
In 2013, the EU Survey on Income and Living Conditions (EU-SILC, Eurostat, 2013) included an ad hoc module on subjective well-being, which included a question for each of its three main elements. This has produced comparable subjective well-being data for all 28 European Member States, as well as Iceland, Norway, Switzerland and Turkey. In 2015, Eurostat (the statistical office of the European Union) also launched a publication on Quality of Life - Facts and Views (Eurostat, 2015), with explanatory pages and an interactive tool to make the data more easily accessible to a wide variety of users. This was complemented by a Eurostat analytical report on subjective well-being published in 2016. All quality of life indicators, including subjective well-being, have been evaluated by the Eurostat Expert Group.
Based on these experiences, Eurostat is now considering adding a question on life satisfaction in the core part of the EU-SILC questionnaire on a yearly basis in the near future, while every 6 years an ad hoc module with around 20 variables on the topic will supplement this information. This will provide a remarkable resource to the research and policy community: a harmonised cross-country dataset with a sufficiently large sample size to estimate the relationship of subjective well-being to a host of individual and geographic characteristics over time. Eurostat’s plan for annual measurement is an important step that will help to establish a time series for more than 30 countries.
There have also been advances in including subjective well-being in time-use surveys. This is particularly important to improve our understanding of experiential well-being, since it enables the link between people’s activities, daily circumstances, social contact, and feelings to be examined. Some countries (the United States, France, Poland, Luxembourg, the United Kingdom and Canada) have incorporated some version of experiential well-being into their time-use surveys. For example, in the United States a governmental agency, the Bureau of Labor Statistics, regularly conducts a time-use survey of over 12 000 individuals (the American Time Use Survey, ATUS). In 2010, 2012 and 2013, a well-being module was included in ATUS that sampled three time-use episodes for each person and asked a number of experiential well-being questions. Unfortunately, the module was limited to three rounds even though a strong recommendation to continue collection of these experiential well-being data was issued by a National Academy of Sciences panel (Stone and Mackie, 2015).
The investment of NSOs in measuring subjective well-being is extremely important and should continue (Box 7.3). As with other indicators such as GDP, subjective well-being data is at its most valuable when one can observe and compare trends, meaning that long periods of data are needed. Continued methodological progress would be facilitated by the collection and dissemination of long time-series in large, high-quality datasets. Collection of such data will also facilitate the generation of policy-relevant insights. Researchers can help support this process by ensuring that analyses of the data that do exist are carried out and disseminated, demonstrating their usefulness; conversely, NSOs can help by ensuring that micro-data are available in a timely manner. Nevertheless, the methodological and conceptual issues raised later in this document must be taken into account when interpreting the data collected. To take one example, Deaton (2012) and Deaton and Stone (2016) suggest that tracking of subjective well-being data can be disrupted by a change in the questionnaire design or by the provision of inappropriate cues, and that such factors do not always average out.
In November 2010, supported by the then Prime Minister David Cameron, the UK Office for National Statistics (ONS) launched the “Measuring National Well-being (MNW) Programme” with the aim of establishing “an accepted and trusted set of National Statistics which help people to understand and monitor national well-being”. Alongside a six month national debate which asked people “what matters” to them, ONS began its Programme by developing and adding four questions on subjective well-being (called “personal” well-being, in the ONS initiative) to one of its largest household surveys (the Annual Population Survey). Some reflections on ONS experiences and lessons learned are provided below.
-
A robust set of personal well-being questions was developed. ONS undertook extensive work to develop a robust and credible set of four questions to capture personal well-being and introduced them into the UK’s largest household survey. Challenges faced in the process included investigations into interview mode effects, different response scales, question placement, and cognitive interviewing. These questions were then added to the Annual Population Survey, whose large sample size provided the opportunity to analyse personal well-being alongside numerous other variables while also minimising survey cost. The findings from ONS testing and development were used as best practice in informing the OECD Guidelines on Measuring Subjective Well-being.
-
Experience from asking these questions has been positive. The four ONS personal well-being questions take only 75 seconds to ask and complete. Since survey space is at a premium, they are an efficient use of both time and space. Feedback from interviewers has been positive, with many reporting that the questions provide an opportunity to build a rapport with respondents; by providing a focus on how people feel about their lives, they have also helped avoid refusals.
-
Demand for personal well-being data continues to grow. Since their introduction into the Annual Population Survey in April 2011, ONS subjective well-being questions have been used in over 20 government surveys covering areas such as crime, household wealth and visits to the natural environment. Researchers have used these data to improve understanding of the relationship between personal well-being and a range of other outcomes.
-
Personal well-being does not tell the whole story. The national debate managed by ONS reinforced the wealth of factors which people consider as important to their well-being and added legitimacy to the Measuring National Well-being programme. ONS developed a suite of 41 measures of national well-being, including both subjective and objective measures across a range of domains, including for example “Our relationships”, “Health”, “the Economy” and “the Natural Environment”. ONS also recognised that presentation would be critical to acceptance of the measures and understanding of the wider programme and developed the National Well-being Wheel to respond to this challenge; the Wheel was recently replaced by a new interactive dashboard, accessible by the increasing number of users relying on mobile devices, which provides “live” updates as new estimates become available for each indicator.1 While most media attention still falls on measures of personal well-being, a growing number of policy studies have used the domains of the National Well-Being Wheel as a framework to structure approaches to policy evaluation and improvement.
-
The What Works Centre for Well-being was established. In late 2014, a What Works Centre for Well-being was set up dedicated to bridging the gap between evidence and policy. Since its introduction, the Centre has helped ensure that high-quality evidence is available to support policy-making, giving a focus to attempts to improve well-being across the United Kingdom. ONS seconded its head of personal well-being for a period of two years to help establish the Centre and cement links between evidence and policy.
-
Policy use of subjective well-being is increasing. Estimates of personal well-being, within the framework of wider measures of national well-being, helped policy-makers understand how their decisions affect people’s life. Examples of policy use of personal well-being data include: the Public Health Outcomes Framework, which monitors the four measures of personal well-being as part of its vision to improve and protect the nation’s health and well-being; the presentation of personal well-being results by occupation, to support young people in making a more informed choice about their career; and using a well-being valuation approach in attempts to monetise the human cost of crime.
-
No appetite for a single index of national well-being. ONS is frequently asked to consider a single measure to summarise progress and place well-being on the same footing as GDP. While the advantages of a single indicator (particularly in aiding communication) are recognised, ONS has no intention of producing a single index of well-being: too many conceptual and methodological hurdles are, as yet, unresolved to allow progress in that direction.
← 1. www.ons.gov.uk/visualisations/dvc364/dashboard/index.html.
Source: Text provided by Jil Matheson.
Global reports and tools
Several global analyses of social and economic progress beyond (or in addition to) GDP have been published and widely disseminated since 2009, including the Legatum Prosperity Index (O’Donnell et al., 2014), the UN World Happiness Report2, released annually since 2012 by UNSDSN (Helliwell, Layard and Sachs, 2018), the US National Academy of Science Report on Measuring Subjective Well-Being (Stone and Mackie, 2015), the OECD How’s Life? series and Better Life Index (OECD, 2015a). While all of these projects include sections on subjective well-being, each takes a different approach to the analysis and comparison of well-being across countries. This diversity of approaches and initiatives helps to advance our understanding of subjective well-being and how it can be used.
Two particularly important documents – the OECD Guidelines on Measuring Subjective Well-Being (OECD, 2013) and the US National Academy of Science Report on Measuring Subjective Well-Being – lay out the current experience in collecting data on subjective well-being and provide a focal point for a growing consensus around methodology. We view these documents as “required reading” for policy-makers and researchers working with subjective well-being measures, because they carefully consider many of the various conceptual and methodological issues that are only briefly touched upon below. Furthermore, supported by the US National Institute on Aging, a conference on time-use and experiential well-being was held in 2015 to take stock of progress since the publication of the Day Reconstruction Method (DRM) and to identify remaining challenges. A report of the conference proceedings (Stone and Smith, 2015) outlines many issues and questions that remain about the DRM, despite its use in dozens of research studies. Two other documents – the Legatum report and the World Happiness Report – speak more to the policy uses of subjective well-being measures and are discussed in a later section of this chapter.
Improvements in methodology
The Stiglitz, Sen and Fitoussi (2009) report identified some of the methodological and interpretive issues that caused concern about using subjective well-being measures. Since the publication of the report, solutions have been presented and explored for many of those issues. A short summary of the issues is provided in Table 7.1 alongside the most promising solutions. While a deep examination of these issues is important to improving the measurement of subjective well-being, it is equally important to avoid setting a uniquely high-standard for subjective well-being in contrast to other indicators, such as income, consumption or wealth inequality, which, as shown in the other chapters in this volume, can be quite difficult to calculate or are similarly derived from self-reported measures that are equally sensitive to the survey vehicle used (for example, the length of the recall period used for expenditure diaries can have dramatic effects on consumption estimates, Beegle et al., 2011) or may have other issues related to self-reports more generally.
Some of the methodological issues detailed in Table 7.2 can be partially addressed by careful standardisation of questionnaires, which may reduce framing and potential context effects.3 For this reason, the continued collection of standardised questions across countries is needed. Following the OECD Guidelines is a good way to ensure that questions are standardised, as they represent the state of the art for question formulation and survey administration. Eurostat’s 2013 EU-SILC ad hoc module on subjective well-being followed the OECD Guidelines, and was based on its recommended questionnaire. The EU-SILC and its ad hoc modules have a legal basis, with a common list of variables, concepts, classifications and survey requirements translated in all EU languages. The legislation is accompanied by EU-SILC methodological guidelines, including the recommended questionnaire, translated in all languages. Importantly, the legislation requires that all EU countries contribute data to this effort.
To illustrate the importance of the concerns over systematically different response styles and bias, we provide a more detailed discussion here. If different groups of people show systematic differences in how they interpret subjective well-being questions or use response scales (for example, due to some common characteristic such as language or culture), then simply comparing the level of subjective well-being between these groups can yield misleading conclusions. The extent to which this is a problem will depend, in part, on the question the data are being used to answer. In some cases, this will not matter if the main focus of interest is whether the change in a variable produced a change in subjective well-being within a specific population, rather than direct comparisons between groups of individuals.
However, in simple descriptive analyses where levels of subjective well-being are compared across groups, such as gender or occupations, or across countries, then systematic differences in question interpretation or response styles between groups has the potential to cause bias. For example, if the elderly understand or respond to a subjective well-being question in a way that is systematically different to younger people, or if richer people have a response style that is somehow different to that found among the poor, then we might over- or under-estimate differences in subjective well-being between these groups. In order to have more concrete ideas about the extent to which this may be a problem, we should have a better idea of why such differences might exist in the first place, and have some theoretical justification for a concern with systematic differences in how subjective well-being questions are interpreted and answered.
Concerns about systematic biases, in particular their potential interaction with context effects, are not solved through the use of panel or longitudinal data if the goal is to compare levels of well-being between groups at a single point in time. A salient example of this is provided by Deaton (2012) on context effects, with its implications further refined in Deaton and Stone (2016) using subjective well-being data collected by the Gallup Organization. In this work, Deaton found evidence of a large impact of a set of political questions placed prior to an evaluative well-being question (the Cantril Ladder), an effect that was larger than that of the 2008 recession. This effect was driven by respondents who reported feeling that the country was going in the wrong direction, which exerted a strong downward bias on their answers to the subsequent life evaluation question. Importantly, these context effects varied by race or ethnicity. For example, the negative treatment effect of the political polling questions (compared to a control without such questions) was smaller for blacks than for whites. This meant that, while whites in the control group on average reported life evaluations almost 0.2 scale points higher than blacks (on a 0-10 scale), in the treatment group there was almost no difference between the two groups (less than 0.03 scale points). This contrasts with results for gender, age and income, where the size of the context effects remained stable across different population groups.
The finding that context effects can work differently for different populations complicates the interpretation of group differences in subjective well-being and requires more extensive study. Since NSOs are very unlikely to ask political polling questions, it will be important to understand whether other lead-in questions can also produce a significant shift in responses. For example, Lee et al. (2016) found that asking a self-rated health question immediately before a subjective well-being question prompted a stronger correlation between the answers compared to a situation when the question ordering was reversed. This effect was driven by a subsample of respondents who reported one or more chronic health conditions: among those without chronic health conditions, question ordering did not produce a significant difference in the size of the correlation.
Taken together, these studies reinforce the importance of question ordering for both survey design and data comparability. Unless explicitly tested through split-sample methods, the effects of question ordering will tend to remain hidden from view.
While systematic group differences in response styles are insufficiently addressed in the literature, several advances have been made. These include the use of vignettes (Crane et al., 2016; although see Grol-Prokopcsyk et al., 2015, and OECD, 2013, for concerns about these methods) when analysing data from migrants (Senik, 2014; Exton, Smith and Vandendriessche, 2015), and using individual fixed effects models with panel data. However, in general we view these concerns as unresolved and recommend continuing research.
Another continuing area of methodological development pertinent for experiential subjective well-being research is the use of real-time and near real-time data capture, for example, with momentary data recording such as Ecological Momentary Assessment (EMA), which is based on the administration of brief questionnaires in real-time in peoples’ everyday lives (Stone and Shiffman, 1994; Shiffman, Stone and Hufford, 2008), daily diaries, and day reconstruction methods (Kahneman et al., 2004). These are important techniques because of their potential to assess experiential subjective well-being with less retrospective bias than measures using (relatively) long recall periods that ask about fluctuating levels of emotions and pain. Long recall periods conflate actual memories of experiences with broad beliefs that do not necessarily accurately reflect experience. However, from a pragmatic perspective of data collection in national surveys, momentary methods can be unwieldy, burdensome, expensive and impractical in some cases (e.g. while people are driving, or when they are engaged in activities that cannot be interrupted) yielding selection effects. As result, methods that ask about the prior day have become the standard; these include simple overall questions about yesterday (as used in the UK ONS survey and the Gallup World Poll), so-called “hybrid” measures based on the DRM (which capture some details about the day, for example, the number of hours engaged in various activities (Christodoulou, Schneider and Stone, 2014; Miret et al., 2012), and DRM surveys (addressing the entire day or sections of the day, as done by the Survey on Health, Ageing and Retirement in Europe (SHARE).
An intriguing line of research pursued by psychologists, sociologists and economists is whether and how subjective well-being shifts with age. There are now dozens of articles examining this question. In short, the pattern is that evaluative well-being (life satisfaction, the Cantril Ladder) is relatively high in the 20s, falls to its lowest point in the late 40s and early 50s, and then improves to the highest levels in the 70s (although there may be declines in older age, see Figure 7.1). This pattern holds for English-speaking, wealthy countries, but not for poorer, non-Western countries (Steptoe, Deaton and Stone, 2015). There is also evidence that the pattern is not attributable to cohort effects, which could have explained the pattern by different cohorts of individuals experiencing various historical events (Blanchflower and Oswald, 2008). Less is known about how experiential subjective well-being changes with people’s age, but at least in the United States patterns of different affects are not U-shaped. For example, Stone et al. (2010) found that stress is high from age 20 through to about age 50, followed by a rapid decline through the 70s (the right side of this pattern is consistent with the evaluative well-being pattern of improving outcomes in older age). What is surprising about these patterns, at least for Western countries, is that the improvement in subjective well-being occurs at an age when the prevalence of chronic disease is on the increase, and that the presence of illness is associated with lower subjective well-being. Theoretical explanations, with some empirical support, focus on a shift in priorities and in social engagements and time use in older people, resulting in higher well-being.
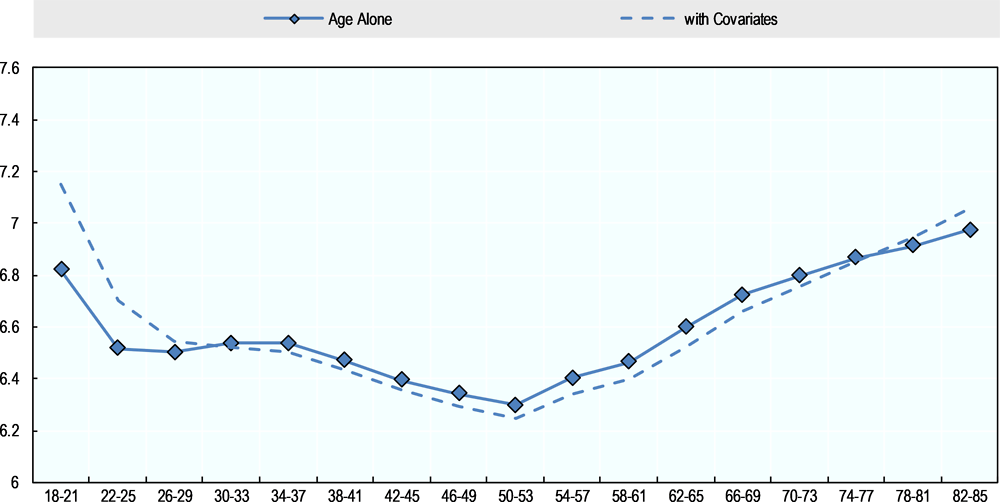
Note: Mean life evaluations, plotted by 4-year age groups. The continuous line represents unadjusted data, while the dotted line represents data adjusted for 4 covariates (the share of the population who are women living with a partner, with a child at home, and unemployed).
Source: Stone, A.A. et al. (2010), “A snapshot of the age distribution of psychological well-being in the United States”, Proceedings of the National Academy of Sciences of the United States of America, Vol. 107(22), pp. 9985-9990.
Complementary approaches to survey questions have been, or are being, developed. Several approaches exist, or are being developed, that can complement survey questions. For example, big data is being used to “nowcast” subjective well-being (Box 7.5), and new approaches are being developed to elicit people’s preferences, including information on how they value trade-offs between competing goals. “Automatic data capture”, which combines data such as GPS measurement or continuous health measures with survey questions on subjective well-being, is another example of these innovative approaches.
Big data offer opportunities to complement NSO-generated measures of subjective well-being, though there are significant cautions that must also be considered. Subjective well-being measures derived from Big Data can potentially provide more timely estimates, high-frequency information, local level data, and early warning signals. Big Data are also multi-dimensional – Google search queries (a form of revealed behaviour), for example, can be used to cover a wide range of states, such as pain. The wealth of big data means that the impact of various shocks (e.g. the impact of the financial crisis across and within US cities) can be investigated in a timely fashion.
There are, however, challenges. Much big data suffers from selection bias and noise, and disaggregating results by different population groups can be problematic. A particularly important problem is that it is difficult to credibly infer the intent of people who contribute data points: researchers have no way of validating their assumptions about why and when people tweet or search for particular terms on Google (which may also be considered selection factors). For this reason, interpretive exercises carried out using big data sources should be approached with caution; research comparing subjective well-being constructs measured with big data as compared to more traditional data collection methods could illuminate our understanding of these selection factors.
7.1.2. Substantive progress: New knowledge about subjective well-being
The global picture
Setting aside the measurement issues outlined above, which may impact the substance of what follows, Gallup World Poll data show that evaluative subjective well-being is highest, on average, in the Nordic countries, Switzerland, the Netherlands, Canada, New Zealand and Australia; and lowest in the poorer countries of sub-Saharan Africa, and in countries experiencing war, such as Syria and Afghanistan (Box 7.6). Changes in average reported life evaluation across countries since the SSF 2009 report also provide evidence that subjective well-being indicators are useful measures of social progress. The biggest drop in average life evaluations between 2005-07 and 2012-14 was in Greece, followed by Egypt and Italy (Helliwell, Layard and Sachs, 2015) – although this analysis excludes five of the world’s current 10 lowest ranking countries, including Syria and Afghanistan, due to lack of data in earlier waves of the Gallup World Poll.
New evidence from the Gallup World Poll shows that the positive relationship between evaluative well-being and income runs throughout the range of GDP per capita, from the poorest to the richest countries. This pattern was not easily seen from the World Values Survey, which does not include the really poor countries in Africa, and had to wait until the Gallup World Poll came along to become firmly established. Prior to that, many researchers had observed that, when plotted against per capita GDP, countries’ evaluative well-being flattened out at some point so that, at income levels above those of a country like Morocco, higher average income did not lead to higher evaluative well-being. This led many researchers in the field to conclude that income did not matter once countries were no longer poor. In his early papers, Easterlin used this as evidence that income did not improve the human lot, at least once we were not dealing with real poverty anymore (Easterlin, 1974).
Deaton (2008) using the Gallup World Poll showed that this conclusion was wrong. When life evaluation is plotted against the logarithm of income, the result is very close to a straight line. There is certainly diminishing marginal utility with respect to GDP per capita, but doubling income has the same effect at the bottom as at the top of the income scale, though the absolute changes in income are much smaller at the bottom than at the top (Figure 7.2). Of course, there is a lot of scatter, so that if you do not take the whole range, the relationship is much less obvious. For example using plots limited to rich countries, an observer might conclude that there is not much of a relation there.
The variability in the association is also important, because it shows that countries are not trapped by their level of GDP per capita. Some countries do much worse than others, some much better. One interpretation is that these deviations indicate the policy space: governments can promote high subjective well-being even with limited resources, and countries like the United States can have relatively poor outcomes in terms of subjective well-being, even when they are very rich in terms of GDP per capita. Many factors besides GDP per capita determine people’s subjective well-being levels, from employment status to health, and from environmental quality to social relationships. Nevertheless, some of the international variation may also be due to reporting styles. It is certainly plausible that people with different cultures use the scale differently. For example, countries of the former Soviet Union are way below the line, but first, there are good reasons for this, and second income measures for these countries are likely to be affected by large measurement errors, so perhaps there is no need to invoke Slavic dourness. In general, we should also remember that in these global comparisons involving per capita GDP measured in purchasing power parity (PPP) terms, there is also huge uncertainty about GDP measures; so not everything has to be attributed to oddities in life evaluation measures.
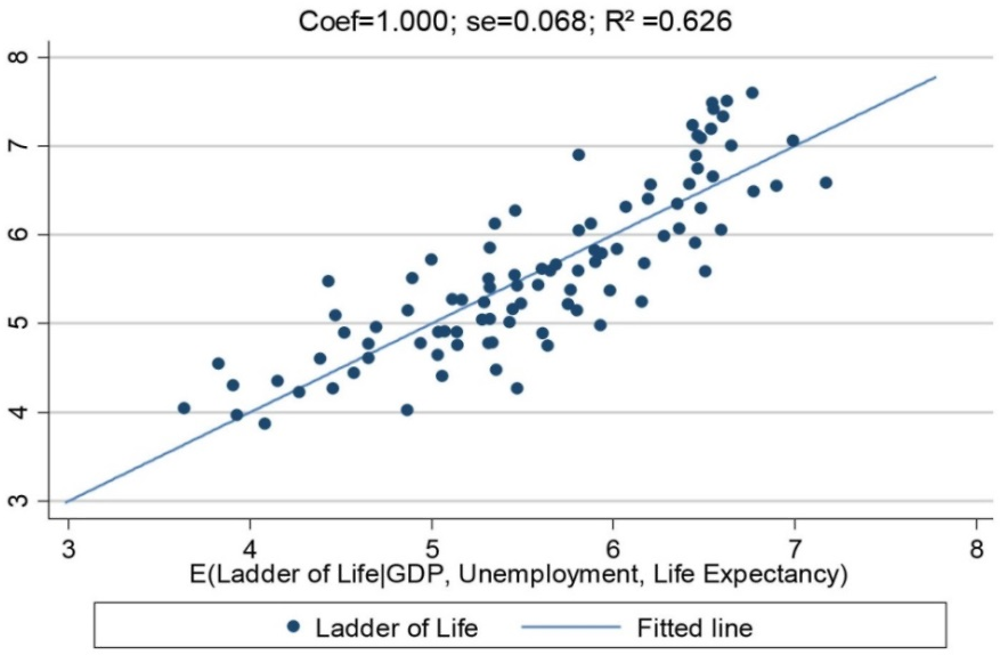
Note: N = 107 countries and territories. Pooled observations, 2009-13.
Source: Gallup World Poll and World Bank World Development data; Exton, C., C. Smith and D. Vandendriessche (2015), “Comparing Happiness across the World: Does Culture Matter?”, OECD Statistics Working Papers, 2015/04, OECD Publishing, Paris. https://doi.org/10.1787/5jrqppzd9bs2-en.
Another remarkable finding from the Gallup World Poll data is that experiential well-being measures are much less associated with per capita GDP than evaluative well-being, such as the Cantril ladder. At the country average level, there is only a small positive correlation between positive emotions (the sum of smiling/laughing, enjoyment and feeling well-rested a lot “yesterday”) and log GDP per capita, while negative emotions (feeling anger, worry and sadness a lot “yesterday”) show essentially no relationship (Exton, Smith and Vandendriessche, 2015). People in some African countries report as many instances of positive emotions yesterday as do people in much richer countries. If, as argued by Benthamite hedonistic utilitarians, the purpose of policy should be to maximise experiential happiness, then Gallup World Poll data would imply that Kuwait, Trinidad and Tobago and Paraguay should be giving aid to Syria, Iraq and Armenia, at least if aid improves happiness. Stress (for which Philippines is champion, and the United States is near the top), worry (Iraq) and anger (Algeria, Iran, Iraq, Turkey) are also not strongly related to income, while pain is highest in the Middle East. So, higher national income tends to come with higher life evaluation, but does little to improve the emotional lives of citizens.
Despite these findings, the association between money income and subjective well-being is not yet settled. Stevenson and Wolfers (2012), for example, claim that the derivative of the Cantril-ladder based evaluative measure with respect to the log of income is around 0.30, pretty much no matter where you look over time.
Other findings from Gallup data show that the U-shape between life evaluation and age is not universal across countries, or at least across regions of the world (Figure 7.3). It is no puzzle that the ladder falls with age in the former Soviet Union countries, given that the elderly experienced the greatest losses from the transition away from a planned economy. But there are also areas of the world, like sub-Saharan Africa, where the relation between life-evaluation and age is flat, others like Latin America and southern Europe where life evaluations fall with age, and some, like China, that share the English speaking U-pattern. Of course, these are cross-sectional results, but it is not clear how to reconcile them with a universal U that is biological, based on evidence from primates, as has been argued (Weiss et al., 2012). The life-cycle patterns of experiential well-being are more uniform across the world, with a lot of what originally reported in Stone et al. (2010) showing up in many places. Negative emotions really do seem to become less prevalent with age around the world. This should perhaps replace the U-shape in evaluative well-being as the new stylised fact.
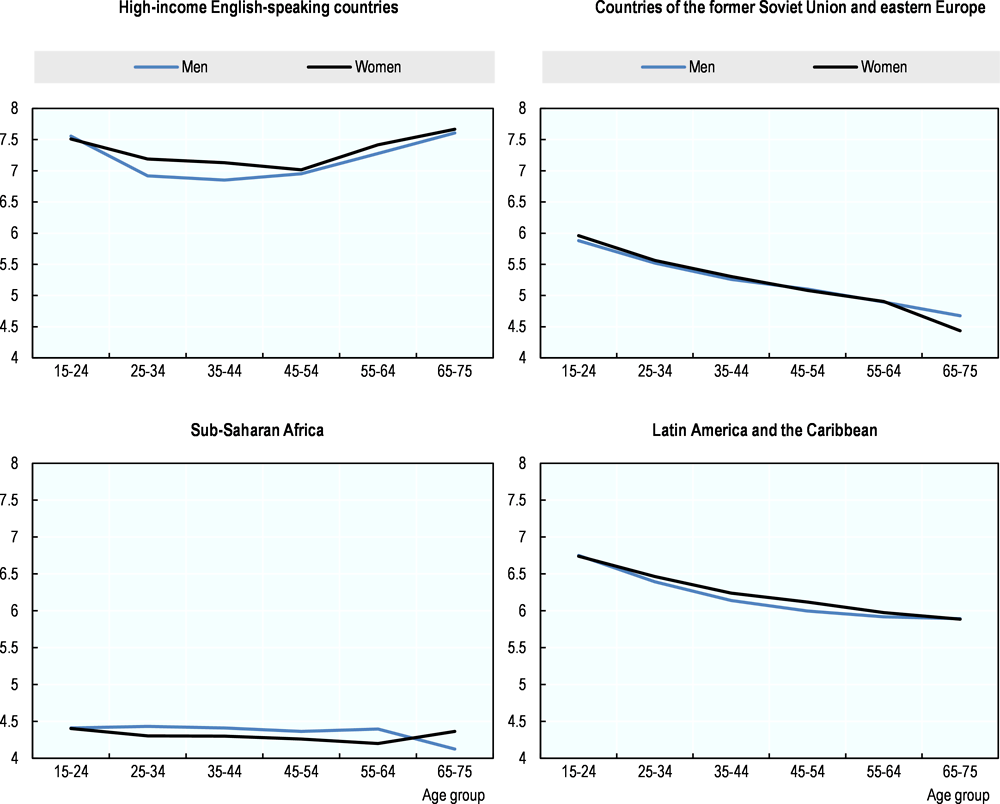
Source: Steptoe, A., A. Deaton and A.A. Stone (2015), “Subjective wellbeing, health, and ageing”, The Lancet, Vol. 385(9968), pp. 640-648.
Correlates and determinants of subjective well-being
At an individual level, there is a growing consensus around the factors that are correlated to higher life satisfaction: being employed, having higher income, better health and stronger relationships are among the most important factors (see for example Eurostat’s Analytical report on subjective wellbeing published in 2016). A large number of other correlates has been identified in some datasets, such as environmental conditions and pollution (Silva, de Keulenaer and Johnstone, 2012). See Box 7.2 for a partial list of the research findings on correlates of subjective well-being.
There is also new work on the importance of childhood as a critical period for later subjective well-being. Children’s emotional health is the largest predictor of adult life satisfaction, above cognitive skills (Layard et al., 2014; OECD, 2015b). This indicates that while children’s subjective well-being is important in and of itself, it matters also because it is likely to be a driver of adolescent and adult outcomes (such as adult life satisfaction, employment, or school achievement). Children’s subjective well-being and emotional health are, in turn, correlated with a variety of family characteristics such as financial difficulties, family structure, moving to a different residence, and the quality of the parent relationship. One way that this research might help policy-makers would be to better understand why some children are resilient to detrimental circumstances or events, but others are not, and what the implications for public service investments are. Eurostat is currently developing a module for EU-SILC on children’s health and material well-being that will likely be collected every 3 years in the future. When these data become available, they will provide many opportunities for deeper analysis on this topic.
Levels of subjective well-being are not only determined by the events that make people better or worse off, but also by the degree to which they “bounce back” after such events. Resilience is a concept closely related to that of (true) adaptation, and several papers in recent years have added to this literature. The picture that is painted by these studies is, however, mixed: there is evidence that life satisfaction adapts to some life events (such as marriage or childbirth), but less so to others (such as disability, entry into poverty, international migration, or unemployment; see, for example, Lucas, 2007; Clark et al., 2008; Oswald and Powdthavee, 2008; Frijters, Johnston and Shields, 2011; Clark and Georgellis, 2013; Clark, d’Ambrosio and Ghislandi, 2016; Helliwell, Bonikowska and Shiplett, 2016). One potential explanation is that people adapt more to positive life events than to negative life events – which may point to a relationship between loss aversion and adaptation. Again, we point out the importance of specifying which type of subjective well-being is being assessed: this is because experiential and evaluative subjective well-being are likely to have different patterns of adaptation.
Progress has also been made in analysing subjective well-being not only as an outcome, but also as a predictor or, in the framework of a production function, as an input to other life outcomes. Steptoe, Deaton and Stone (2015) have shown that, for example, there is evidence that the three components of subjective well-being predict individual morbidity and mortality even when controlling for a wide variety of individual characteristics. Similarly, a growing body of research has supported the idea that meaning and purpose in life (i.e. eudaimonic well-being) is associated with health and mortality. For example, recent findings from the Midlife in the United States study demonstrate their subjective well-being is linked to the metabolic syndrome, a group of factors that raises the risk for heart disease and other health problems such as diabetes and stroke (Boylan and Ryff, 2015). However, recent data from UK Million Women study show that ratings of “happiness” (admittedly an ambiguous construct from the multi-dimensional subjective well-being perspective advanced here – see Box 7.1) are not linked to mortality when personal and health conditions at the first assessment point were considered in the regressions (Liu et al., 2016). Although the study omitted men, could have been more refined in the subjective well-being measures employed, and may have over-controlled co-varying health status, its conclusions challenge the prevailing sentiment about this issue.
What do people mean when they say they are “satisfied with their life”?
To know what is behind these measures, and in particular to help understand how different measures relate to each other and might be combined, it is very important to understand what people mean when they say that they are satisfied with their lives, and how they weigh different well-being outcomes – that is, what matters for people’s subjective well-being.
The correlates of the three types of subjective well-being present a generally coherent picture and provide predictive evidence that the measures are performing as expected. Nevertheless, a strong case can be made for more deeply understanding the origins of the ratings – that is, how people are generating them. In this regard, most work has been done on evaluative measures like life satisfaction, where there have been investigations into the aspects of life that bear the most on judgments of life satisfaction by simply regressing overall satisfaction measures on ratings of specific domains of life such a work satisfaction, partner satisfaction, social satisfaction, etc. (Helliwell, Layard and Sachs, 2016, special section). However, simple, a-theoretical analytic approaches may result in misleading conclusions and, importantly, lead to incorrect policy inferences. More recently, an econometric approach to decomposing global life satisfaction using stated preferences has been proposed and tested by Benjamin et al. (2014). This study has shown that people’s decisions about the future are based on a complex weighting of ratings of anticipated well-being in several imagined outcomes. In another approach to the question, new work is ongoing employing traditional qualitative methods to understand the thought processes associated with making life satisfaction ratings, for example, via the use of “think aloud” techniques (Broderick et al., 2016).
7.1.3. Progress in applications to policy
Direct applications of subjective well-being to policy are at still an early stage. The years since 2009 have been immensely productive for the implementation of subjective well-being data collection in many countries, for understanding the issues in using subjective well-being data, and for the development of many techniques to cope with these issues. New research is now needed to better understand how subjective well-being measures can be transformed into a useful metric for policy-makers, and in what way they can provide meaningful information that contributes to better policy decisions. Yet another commission, from the Legatum Institute, focused on subjective well-being and governmental policy and provided a refreshingly pragmatic and thoughtful approach (O’Donnell et al., 2014). In many policy applications, some benefits and costs are recognised, but are not easily or accurately quantifiable in monetary terms, because explicit markets for these benefits and costs do not exist, and implicit valuations can only be imperfectly, if at all, placed on these factors. Thus, even if subjective well-being measures are imperfect, they have the potential to advance policy-making when compared with the imperfect measures of benefits and costs often available.
Cost-benefit analysis
Some work has used subjective well-being measures in cost-benefit analysis, as a method for valuing non-market outcomes (O’Donnell et al., 2014; Fujiwara and Campbell, 2011). The principle underlying this work is that many policies have costs and benefits that are difficult to monetise. As a result, standard cost-benefit analysis, which compares monetary costs and benefits, will lead to policy decisions that underweight those non-monetary costs and benefits if these are not taken into account. In the case of valuing non-market factors for cost-benefit analysis, current methods have serious limitations, so complementing existing methods with subjective well-being-based valuations could provide additional information. The United Kingdom Treasury’s Green Book, which provides formal guidance to government agencies on the appraisal and evaluation of policy proposals, was updated in 2011 to include a section on valuation for social cost-benefit analysis, including through subjective well-being based methods. However, additional work needs to be done to make this approach more credible. In particular, there are many problems with monetising differences in levels of subjective well-being (Kahneman and Krueger, 2006) – not least a lack of datasets containing high-quality measures of both personal income and subjective well-being, as well as conceptual problems in identifying a unit of measure with which to convert subjective well-being into dollars or euros. As with other measurement issues, the difficulties in using subjective well-being for cost-benefit analysis must be seen in light of the difficulties in other methods for cost-benefit analysis – and subjective well-being-based methods should be seen as a complement to, rather than a replacement for, more traditional techniques.
Programme and policy evaluation
Several policy or programme evaluations have included subjective well-being as an outcome indicator, and its inclusion can help both to assess the impact of a programme and to understand its mechanisms with more confidence. These studies not only support the idea that subjective well-being can be used to meaningfully measure policy impact; they also support the underlying construct of subjective well-being and its responsiveness to life circumstances. Another advantage of using subjective well-being measures in policy evaluations is that they may show that interventions have benefits that are not measured by conventional outcomes; or, conversely, to show that while conventional methods may show benefits, these benefits could be offset by lower subjective well-being (and, in both cases, providing a richer understanding of program impact).
For example, an in-work support programme in the United Kingdom was found to have unexpected negative impacts on the subjective well-being of people who participated in these programmes (Dorsett and Oswald, 2014). Similarly, an unconditional cash transfer programme in Kenya found positive impacts on the subjective well-being of participants, but negative spill-over effects on non-participants (Haushofer, Reisinger and Shapiro, 2015). In Morocco, while household connections to the municipal water supply showed no impact on health or income, they resulted in increased happiness (Devoto et al., 2012). Other studies suggest a positive impact of access to insurance on mental health (Finkelstein et al., 2012), of family leave policies on the life satisfaction of parents (D’Addio et al., 2014), and of national citizen service in the United Kingdom on the subjective well-being of participants (UK Cabinet Office, 2013). Finally, Ludwig, et al. (2013) found that subjective measures of mental health improved among participants in The Moving to Opportunities experiment in the United States before such results showed up in physical health. Measures of subjective well-being also have the potential to improve our understanding of people’s economic insecurity (Box 7.7), as also argued in Chapter 8 of this volume.
While work on refining the measurement and understanding of subjective well-being should continue, experimentation in policy applications should commence. As with many domains, experiments in policy applications and foundational work on measurement and understanding are likely to complement one another, in a mutually reinforcing process.
There are several possible threads through which one can link subjective well-being and economic insecurity. Research on both topics confronts several shared methodological issues, especially with respect to subjective economic insecurity. In addition, a primary concern about economic insecurity is that it reduces subjective well-being (even if the bad event does not actually happen). Eurostat’s Analytical report on subjective wellbeing (2016) showed, for example, that people’s inability to face unexpected expenses drastically reduces their subjective well-being, even when controlling for the impact of other variables such as their income or employment status.
A recent analysis of economic trends highlighted the differential effects of positive and negative GDP growth on people’s subjective well-being (De Neve et al., 2015), using data from the Gallup World Poll, the US Behavioral Risk Factor Surveillance System, and Eurobarometer. Motivated by inferences from Prospect Theory (Kahneman and Tversky, 1979), the authors found that average evaluative well-being (life satisfaction) reacted more strongly to negative GDP growth than to positive growth in all three surveys (a pattern which is consistent with loss aversion). On the other hand, experiential well-being was only impacted by negative GDP growth: daily happiness and enjoyment decreased and stress and worry increased during periods of economic declines.
These findings have implications for both economic theory and macro-economic policies, including the impact of unemployment, and nicely demonstrate the utility of taking a multi-faceted view of subjective well-being.
7.2. Continuing issues and new questions
7.2.1. Issues to be addressed to gain a more complete understanding of subjective well-being
Causality
First, as with all other types of analysis, careful attention must be paid to establish credible causality. It is difficult to reach strong conclusions about causality based on much of the subjective well-being research that is currently available, which relies mainly on observational and self-reported data. In order for the field to advance, it will be important to focus less effort on exploratory and hypothesis-generating studies, and more on developing and testing theories. These theories, and the research designed to test them, should ideally take into account the complex inter-relationships among subjective well-being correlates, in order to identify which variables are acting as mediators, moderators, or causing actual shifts in subjective well-being. Panel data, especially panel data that can take advantage of a discontinuity such as a policy shifts, are likely to be beneficial in this respect. As mentioned earlier, this endeavour is facilitated, and indeed perhaps only possible, when explicit models and theories are used to inform analyses and interpretations.
Understanding the nature of sorting with respect to preferences is also a priority for future research. For example, Krueger and Schkade (2008) provide some evidence that workers sort themselves across jobs based on their preferences, with workers who are more extroverted tending to be employed in jobs that require more social interactions.
Heterogeneity
Second, and related, analyses of subjective well-being need to go beyond the average and examine heterogeneity. Focusing on the average subjective well-being of a group or nation is misleading in the same way as focusing on the average income of a group or nation. There may be large inequalities in subjective well-being, including inequalities among people with different demographic characteristics. It is also important to consider the possibility of different levels and correlations among different groups in order to more fully understand the dynamics of subjective well-being. However, any sub-group analysis requires large sample sizes, which are not always available, although there are certainly some large-scale datasets in development, and data from NSOs will have a particularly important role to play here. In addition, data quality on the dimensions of interest for disaggregation is often poor among existing data sets, in particular income. This is a substantial problem for research on the relationship between income and subjective well-being. Again, large official datasets such as EU-SILC allow this disaggregation and analysis, with high-quality information on a range of covariates collected in a standardised way across countries. Most of these indicators and analyses are published – in the datasets and Eurostat publication – with a variety of different breakdowns such as sex, age, income, education level, employment status, country (for most countries also region) of residence, and degree of urbanisation.
A theoretical model detailing the factors and processes underlying observed differences in subjective well-being would be invaluable for understanding and for designing possible interventions to remedy these inequalities. Building up a long time series of data across a wide range of countries will also be essential for testing these models, and to assess the dynamic relationships among drivers and outcomes.
Similarly, relatively little is known about the tails of the distribution of subjective well-being, particularly those who rate themselves as having extremely low levels of subjective well-being (including those who live with high levels of pain). These people are likely to represent a particular policy concern, and much may be learned from research focusing on them.
Finally, research efforts should continue to focus on adaptation and resilience, as these are among the most promising, if difficult, research avenues. Further investigation of the role of public goods and services in supporting people’s resilience might lead to findings that could be directly acted upon by policy-makers; in other terms, such research might highlight the resources that are needed to restore subjective well-being after a life challenge.
7.2.2. Data collection and analytic issues
Data collection and availability
As described above, data collection on subjective well-being has expanded enormously. There are, however, two important areas where there is still a lack of data on subjective well-being, and where the inclusion of subjective well-being questions is likely be relatively low cost. The first is to expand high-quality data collection on subjective well-being to poor countries, for example, by including a life satisfaction and experiential well-being module in household surveys conducted in these countries. As well as casting important light on the societal conditions and policy environments that can influence changes in subjective well-being over time, research into level differences among countries has potential for addressing persistent methodological and conceptual questions concerning the meaning of subjective well-being responses from people in different cultural and economic settings. Have people in poor countries adapted to their circumstances, and are they using the subjective well-being scales in entirely different ways than those in wealthy countries? And if so, what do country comparisons mean?
Second, in order to increase our understanding of experiential well-being, the inclusion of subjective well-being measures in official time-use surveys is important, as recommended in the NAS report mentioned above. Such efforts could be supported by more guidance on which approach is best for this purpose, and by increasing the research output linked to existing efforts. The Guidelines on Harmonising Time Use Surveys (UNECE, 2013) have been useful in this area but additional analysis of different approaches to collecting experiential well-being data are necessary in order to provide empirical guidance on best practice in this area. As mentioned above, the inclusion of subjective well-being items in on-going time use surveys, such as the American Time Use Survey, is an efficient way to achieve this goal. Collecting time-use data and experiential well-being in poor countries would also be particularly useful, as little is known about the daily activities or experiential well-being of rural populations.
Finally, timely access to these data is critical, as well as responsiveness by researchers to new data availability. Measurement initiatives will push forward our knowledge and understanding of subjective well-being, but researchers must have access to these data in order to achieve this outcome. In turn, researchers must demonstrate the usefulness of these measures, or the measures risk being dropped. Increased co-operation between actors would improve the quality and usage of data on subjective well-being, and networks can play an important role in this respect.
Data analysis and interpretation
As discussed above, one of the most important issues inadequately addressed by current research is that of systematic differences in question interpretation and response styles between population groups. Is there conclusive evidence that this is a problem? And, if so, are there ways to adjust for it? Information is needed about which types of group comparisons are affected, about the magnitude of the problem, and about the psychological mechanisms underlying these systematic differences.
While some of the methodological issues that have been associated with subjective well-being measures are, to varying degrees, minimised through the use of standardised questionnaires, this issue is not resolved through standardisation alone. So far, only limited analysis has been performed for the assessment of the 2013 EU-SILC ad hoc module regarding the viability of cross-national comparisons (Eurostat, 2016). The analysis that exists has been mostly undertaken through internal and external validation (correlations with certain variables of interest), and the results are encouraging.
Some progress has also been made on using vignettes to address this issue but this approach has limitations. For example, people’s responses to the circumstances described in vignettes are very likely to be shaped by the policy environment in which they live – because the implications of, for example, living with a chronic health condition depend on factors such as health care cost and availability, as well as disability benefits. This means that “correcting” subjective well-being self-reports of their own conditions according to international differences in how people rate the same vignettes could ultimately remove the most policy-relevant part of the international variation in well-being, effectively throwing the baby out with the bathwater.
The U-index, which calculates the share of time that individuals spend in an unpleasant state – defined as a period when the strongest reported emotion is a negative one (Kahneman and Krueger, 2006) – is a promising method for neutralising differences in the extent to which response scales are used differentially across countries or groups of people. While some work is available supporting its utility, its application so far has been limited to measures of experiential well-being. More work is needed to see how large a problem inter-personal differences in the use of response scale actually is, and to find new cost-effective solutions.
Subjective well-being questions are generic, but there are times when they should be tailored to the application at hand. For example, in the US Moving to Opportunity project, feelings of security and anxiety were especially relevant for programme-participants and were specifically targeted. In many medical studies, pain may be a particularly relevant type of experiential well-being, whereas misery may be especially relevant in studies of refugees.
More population-level work is needed on subjective well-being beyond life satisfaction, i.e. extending measurements to eudaimonic and experiential well-being. At present, a variety of different approaches are being used across OECD statistical offices to collect this type of information (see Exton, Siegerink and Smith, forthcoming, for further details). As described in Box 7.1, measures of subjective well-being belong to three different categories. Life satisfaction is generally the most widely used measure of subjective well-being, and the one for which there has been the most research, for example, on adaptation. A focus on a single indicator is, on the one hand, beneficial and pragmatic, as it ensures a wider evidence base for at least one indicator. On the other hand, there are surely missed opportunities, as there is likely much to be learned from data on the other dimensions of subjective well-being.
We concur with the conclusion of the NAS report (Stone and Mackie, 2015) that research on subjective well-being should be explicit about the types of measure used, and should ideally include more than one type of measure. More effort should be given to understanding eudaimonia and experiential well-being, to describing the relationship between the different measures, and to ensuring that these outcomes are not being neglected.
Work on the other aspects of subjective well-being needs to be balanced with the need for clarity in communication with those outside the research community. While a synthetic indicator that combines different dimensions of subjective well-being is probably not a strategy that is well-grounded in current understanding of the different constructs, there is often some demand for combining information in summary form. Effort should be made to ensure that these measures, if they are to gain traction in a policy setting, are reasonably easy to understand and compare.
Related to this question is an issue that studies on subjective well-being share with other topics in this volume: how to think about, and communicate, what constitutes a meaningful change or difference in the measure considered. Especially in large samples, a very small difference may be statistically significant but not very important for policy-making. This can be particularly problematic when considering differences on a scale that has no inherent meaning. One option is to phrase differences in terms of some calibration (i.e. a difference of magnitude “x” corresponds to the increase in subjective well-being associated with an increase in personal income of “y”, although much more research is needed to establish a universal unit of measurement). It should also be noted that the original work on the Day Reconstruction Method presented differences in experiential well-being across groups by aligning those differences with the affect associated with typical daily activities, providing an informative ruler for interpreting affective differences.
7.2.3. Applications to policy
Experimentation and innovation
The application of subjective well-being to policy is at an early stage, and there is still much to learn. At this point, there is sufficient understanding of methodological issues and consensus on the best way to address most of those issues to cautiously move forward. Experimental initiatives will, in turn, generate new questions and more progress on the methodological issues. However, many policy applications will have to wait until a sufficiently large and long cross-country dataset has been built up, which will take time. In the meantime, there are a variety of ways that progress can be made.
Subjective well-being can complement existing policy analysis methods, and we recommend taking steps to consider all three dimensions of subjective well-being in order to obtain a complete picture. However, we realise that this recommendation is much less specific than we would like it to be, and the reason for this follows. Evaluative measures of subjective well-being (life satisfaction, Cantril Ladder, Diener scale) seem to us to have a conceptual advantage over the eudaimonic and experiential subjective well-being measures in that they target peoples’ summary evaluations of their current lives, which at face value appears more consistent with their choices and therefore with the economic concept of “utility”.
Experiential measures may be less ideal because of concerns about true adaptation to changing environmental situations (see Sen’s “happy peasant” arguments), though experiential measures do capture an essential aspect of well-being – how one feels. Eudaimonia addresses broader meaning and aspirations, which are undoubtedly an important aspect of life, yet it appears less directly applicable as a measure of utility. An example of this approach tracked evaluative and experiential well-being for people who migrated from Tonga to New Zealand, and showed how these measures illuminated their complex psychological transition (Stillman et al., 2015).
There are drawbacks, though, with exclusively adopting evaluative well-being as the primary measure for policy. First, as mentioned above, we believe that experience is an essential part of subjective well-being that should not be omitted. Second, as reviewed in the methodological sections of this chapter, evaluative measures are prone to being perturbed and, possibly, biased by a number of irrelevant factors, which raises questions about recommending their use for policy-making – particularly if the data are to be used as a proxy for utility, rather than as one of a variety of subjective well-being measures that might inform policy decisions.
Additional work should be done on cost-benefit analysis, to understand whether and how results from analyses based on subjective well-being valuation can complement existing methods. Early efforts have produced some extreme results, potentially due to income measurement issues (i.e. if the estimated partial effect of income on subjective well-being is small, and does not represent the “true” value of income, scaling other effects by this coefficient will lead to implausibly large monetary effects); and because models and theories were not sufficiently developed to allow sound interpretation. In addition, some other measures are particularly amenable to links with subjective well-being research, for example, the well-being adjusted “quality adjusted life years” (QALY), the so-called WELBY – well-being adjusted life year.
Some fairly low-cost initiatives would be to routinely collect, and report on, subjective well-being indicators in programme evaluation questionnaires, and to routinely add subjective well-being questions to questionnaires such as labour force surveys or surveys carried out in schools. In the European context this will be done using the EU-SILC as a vehicle, as 2-3 indicators (including life satisfaction) will be collected on a yearly basis. As shown in Box 7.2, data on subjective well-being is an important outcome not only in itself, but also as an input or driver of other outcomes of interest, and can help researchers provide a richer data analysis.
Researchers, in turn, need to spur applications to policy, in part to demonstrate to NSOs that investment in subjective well-being data is worthwhile. Much of the current research on subjective well-being is difficult to apply to policy, even experimentally. A greater focus on policy applications in the literature (e.g. on policy-amenable drivers of subjective well-being) would be helpful. Co-ordination between researchers, policy-makers and NSOs may be very valuable, a role that the OECD may be well-placed to play.
Cautions in using subjective well-being data for policy
Well-meaning but naïve policy changes may make people worse off due to the complex inter-relationships between choices, prices and heterogeneity in subjective well-being, as well as general equilibrium effects. Airport noise is one example: people live near airports for a reason, typically because of lower housing prices, or because they do not care too much about noise, and well-meaning policy (e.g. to reduce traffic at night) could actually make them worse off because of the effect of lower noise in raising house prices (this example is taken from a personal communication with Angus Deaton). We need to understand why people live where they do, and build models of how location could change in response to policy changes. Hedonic models of sorting are well established in labour economics (e.g. Rosen, 1986) and urban economics (e.g. Roback, 1982), and this type of work can be extended to subjective well-being.
A less ambitious but still important goal for policy is simply to provide information on subjective well-being and let people and businesses use it as they see fit. To use a term from David Halpern, “de-shrouding” subjective well-being means giving the public information on the correlates of subjective well-being – informing them that priests, or people without children, or people who live in Denmark are happier than others (clearly, some of this has already occurred in the news media). To some extent, this is simply providing information, which might in principle be useful to someone considering a move to Copenhagen.
However, such information may also be misleading, partly because of the considerable challenges in identifying causality in these studies. The types of people who become priests are very special, and the standard battery of variables used to control for differences between groups (e.g. sex, age, educational background, income, etc.) is unlikely to fully control for the difference between people who become priests and those who select other occupations. In this regard, subjective well-being data are no different from data on average income: while it is informative to know that doctors earn more than the average worker, it is the case that many individuals do not have the training, aptitude, or temperament to work as doctors. Therefore, to continue with the subjective well-being example, entering the clergy may not yield the expected gains in subjective well-being that were anticipated on the basis of the de-shrouded well-being averages.
In addition, results from observational studies are averages, even if they are averages within groups, and as such may not apply to a given individual. So, the application of subjective well-being data must be done in a considered way, given that the potential for unintended consequences are far from academic.
7.3. Conclusions
Up to this point, we have not made recommendations for how subjective well-being measures could be used in policy applications, i.e. recommendations beyond the generic suggestion echoed from the 2015 National Academy of Science’s report that both evaluative and experiential subjective well-being measures be used. While we continue to agree that this is a reasonable approach, here we describe our concerns about this position and lay out recommendations taking those concerns into account.
The choice of the subjective well-being measure that will be used to inform policy should be directed by a theory or model of whatever phenomenon is under consideration, which should direct the subjective well-being construct that best serves the model and policy objectives. As discussed throughout this chapter, explicit depiction of the potential pathways by which subjective well-being influences or is influenced by other variables is paramount for properly specifying the measures selected, for study design, for structuring analyses, and for allowing appropriate interpretation of the results. Without such considerations, investigators are prone to arrive at incorrect, and possibly counterproductive, conclusions about how subjective well-being is impacted by a specific policy.
In the light of the considerations made in the preceding sections, we would like to conclude by providing a limited number of recommendations that could guide research, measurement efforts, and policy application of subjective well-being data in the future.
-
1. Continue regular, frequent, and standardised collection of subjective well-being data by NSOs. Use the OECD Guidelines to create a standardised evidence base, and aim for re-evaluation of guidelines in the future, once a sufficient evidence base is established.
-
2. Ensure that these data are collected in a way that allows estimation of the joint distribution of subjective well-being with other variables, and that the other variables (in particular, income) are well-measured.
-
3. Focus on subjective well-being measures beyond life evaluation, and examine the relationship between different aspects of subjective well-being.
-
4. Continue to collect information on time-use and experiential well-being, and intensify efforts to collect such data in low-income countries.
-
5. Focus efforts to resolve methodological issues on systematic inter-personal differences in response styles, which are not amenable to solution through standardised questionnaires.
-
6. Develop theories and build models of how different types of subjective well-being function as predictors and outcomes, and how they relate to the other variables one is considering; and develop models of people’s sorting based on preferences and policy changes.
-
7. Add subjective well-being measures as outcomes in studies of randomised experiments and natural experiments to help identify causal mechanisms.
References
Aassve, A., B. Arpino and N. Balbo (2016), “It takes two to tango: Couples’ happiness and childbearing”, The European Journal of Population, Vol. 32(3), pp. 339-354, https://pdfs.semanticscholar.org/5f7f/cf43dcfcbca04e4d8cc90ab078f3190c4661.pdf.
Aghababaei, N. and A. Błachnio (2015), “Well-being and the dark triad”, Personality and Individual Differences, Vol. 86, pp. 365-368, https://doi.org/10.1016/j.paid.2015.06.043.
Beegle, K. et al. (2011), “Methods of household consumption measurement through surveys: Experimental results from Tanzania”, The Journal of Development Economics, Vol. 98(1), pp. 3-18.
Benjamin, D.J. et al. (2014), “Beyond happiness and satisfaction: Toward well-being indices based on stated preference”, The American Economic Review, Vol. 104, No. 9, pp. 2698-2735.
Berlin, M. and N. Kaunitz (2015), “Beyond income: The importance for life satisfaction of having access to a cash margin”, The Journal of Happiness Studies, Vol. 16(6), pp. 1557-1573, https://ideas.repec.org/a/spr/jhappi/v16y2015i6p1557-1573.html.
Blanchflower, D.G. and A.J. Oswald (2008), “Is well-being U-shaped over the life cycle?”, Social Science and Medicine, Vol. 66, pp. 1733-1749.
Boylan, J.M. and C.D. Ryff (2015), “Psychological well-being and metabolic syndrome: Findings from the midlife in the United States national sample”, Psychosomatic Medicine, Vol. 77(5), pp. 548-558.
Brewster, C.E. (2015), “Churchmanship and personal happiness: A study among rural Anglican clergy”, Rural Theology: International, Ecumenical and Interdisciplinary Perspectives, Vol. 13(2), pp. 124-134, www.tandfonline.com/doi/abs/10.1179/1470499415Z.00000000050.
Broderick, J.E. et al. (2016), “A qualitative study of themes considered in life satisfaction ratings in the U.S.”, unpublished manuscript, University of Southern California.
Brown, T.T. (2015), “The subjective well-being method of valuation: An application to general health status”, The Health Services Research Journal, Vol. 50(6), pp. 1996-2018, www.ncbi.nlm.nih.gov/pubmed/25762183.
Christodoulou, C., S. Schneider and A.A. Stone (2014), “Validation of a brief yesterday measure of hedonic well-being and daily activities: Comparison with the day reconstruction method”, Social Indicators Research, Vol. 115, pp. 907-917.
Clark, A.E., C. D’Ambrosio and S. Ghislandi (2016), “Adaptation to poverty in long-run panel data”, The Review of Economics and Statistics, Vol. 98(3), pp. 591-600.
Clark, A.E., S. Flèche and C. Senik (2015), “Economic growth evens out happiness: Evidence from six surveys”, The Review of Income and Wealth, Vol. 62(3), pp. 405-419.
Clark, A.E. and Y. Georgellis (2013), “Back to baseline in Britain: Adaptation in the BHPS”, Economica, Vol. 80, pp. 496-512.
Clark, A.E. et al. (2008), “Lags and leads in life satisfaction: A test of the baseline hypothesis”, The Economic Journal, Vol. 118, pp. 22-243.
Coffey, J.K., M.T. Warren and A.W. Gottfried (2015), “Does infant happiness forecast adult life satisfaction? Examining subjective well-being in the first quarter century of life”, The Journal of Happiness Studies, Vol. 16(6), pp. 1401-21, https://link.springer.com/article/10.1007%2Fs10902-014-9556-x.
Cramm, J.M. and A.P. Nieboer (2015), “Social cohesion and belonging predict the well-being of community-dwelling older people”, BMC Geriatrics, Vol. 15(1), p. 30, www.researchgate.net/publication/275051964_Social_cohesion_and_belonging_predict_the_well-being_of_community-dwelling_older_people.
Crane, M. et al. (2016), “Correcting bias in self-rated quality of life: An application of anchoring vignettes and ordinal regression models to better understand QoL differences across commuting modes”, Quality of Life Research, Vol. 25(2), pp. 257-266.
Cuellar, I., E. Bastida and S.M. Braccio (2004), “Residency in the United States, subjective well-being, and depression in an older Mexican-origin sample”, The Journal of Aging and Health, Vol. 16(4), pp. 447-466, https://doi.org/10.1177/0898264304265764.
Cummins, R.A. (2001), “The subjective well-being of people caring for a family member with a severe disability at home: A review”, The Journal of Intellectual and Developmental Disability, Vol. 26(1), pp. 83-100.
Cummins, R.A. et al. (2015), “A demonstration of set-points for subjective wellbeing”, The Journal of Happiness Studies, Vol. 15(1), pp. 183-206, https://doi.org/10.1007/s10902-013-9444-9.
D’Addio, A. et al. (2014), “Using a quasi-natural experiment to identify the effects of birth-related leave policies on subjective well-being in Europe”, The OECD Journal: Economic Studies, Vol. 2013/1, https://doi.org/10.1787/eco_studies-2013-5k3tvtg6fvmq.
Deaton, A. (2012), “The financial crisis and the well-being of Americans”, Oxford Economic Papers, Vol. 64(1), pp. 1-26.
Deaton, A. (2008), “Income, health and wellbeing around the world: Evidence from the Gallup World Poll”, The Journal of Economic Perspectives, Vol. 22(2), pp. 53-72, https://dx.doi.org/10.1257%2Fjep.22.2.53.
Deaton, A. and A.A. Stone (2016), “Understanding context effects for a measure of life evaluation: How responses matter”, Oxford Economic Papers, Vol. 68(4), pp. 861-870, https://academic.oup.com/oep/article-lookup/doi/10.1093/oep/gpw022.
Devins, G.M. et al. (2015), “Distancing, self-esteem, and subjective well-being in head and neck cancer”, Psycho-Oncology, Vol. 24(11), pp. 1506-13, https://doi.org/10.1002/pon.3760.
Devoto, F. et al. (2012), “Happiness on tap: Piped water adoption in urban Morocco”, The American Economic Journal: Economic Policy, pp. 68-99.
Diener, E. (1984), “Subjective well-being”, The Psychological Bulletin, Vol. 95(3), https://ssrn.com/abstract=2162125.
Di Tella, R. et al. (2010), “Happiness adaptation to income and to status in an individual panel”, The Journal of Economic Behavior & Organization, Vol. 76(3), pp. 834-852.
Dorsett, R. and A.J. Oswald (2014), “Human well-being and in-work benefits: A randomized controlled trial”, IZA Discussion paper, No. 7943.
Easterlin, R.A. (1974), “Does economic growth improve the human lot? Some empirical evidence”, in David, P.A. and M.W. Reder (eds.), Nations and Households in Economic Growth: Essays in Honor of Moses Abramovitz, Academic Press, New York.
Eurostat (2016), “Analytical report on subjective wellbeing”, Eurostat Statistical Working Papers, http://ec.europa.eu/eurostat/web/products-statistical-working-papers/-/KS-TC-16-005.
Eurostat (2015), Quality of Life. Facts and Views, Eurostat statistical books, http://ec.europa.eu/eurostat/web/products-statistical-books/-/KS-05-14-073.
Eurostat (2013), 2013 EU-SILC Module on Wellbeing: Assessment of the Implementation, http://ec.europa.eu/eurostat/documents/1012329/1012401/2013+Module+assessment.pdf.
Exton, C., V. Siegerink and C. Smith (2018), “Measuring subjective well-being in national statistics: Taking stock of recent OECD activities”, forthcoming, OECD Publishing, Paris.
Exton, C., C. Smith and D. Vandendriessche (2015), “Comparing happiness across the world: Does culture matter?”, OECD Statistics Working Papers, No. 2015/04, OECD Publishing, Paris, https://doi.org/10.1787/5jrqppzd9bs2-en.
Extremera, N. and L. Rey (2015), “The moderator role of emotion regulation ability in the link between stress and well-being”, Frontiers in Psychology, Vol. 6, p. 1632, https://doi.org/10.3389/fpsyg.2015.01632.
Finkelstein, A. et al. (2012), “The Oregon health insurance experiment: Evidence from the first year”, The Quarterly Journal of Economics, Vol. 127(3), pp. 1057-1106.
Fleurbaey, M. and D. Blanchet (2013), Beyond GDP: Measuring Welfare and Assessing Sustainability, Oxford University Press, Oxford.
Frijters, P., D. Johnston and M. Shields (2011), “Happiness dynamics with quarterly life event data”, The Scandinavian Journal of Economics, Vol. 113, pp. 190-211.
Fujiwara, D. and R. Campbell (2011), Valuation Techniques for Social Cost-Benefit Analysis: Stated Preference, Revealed Preference and Subjective Well-Being Approaches, Department for Work and Pensions, HM Treasury, London.
Gal, E. et al. (2015), “Integration in the vocational world: How does it affect quality of life and subjective well-being of young adults with ASD”, The International Journal of Environmental Research and Public Health, Vol. 12(9), pp. 10820-32, https://doi.org/10.3390/ijerph120910820.
García-Mainar, I., V.M. Montuenga and M. Navarro-Paniagua (2015), “Workplace environmental conditions and life satisfaction in Spain”, Ecological Economics, Vol. 119, pp. 136-146, https://doi.org/10.1016/j.ecolecon.2015.08.017.
García-Moya, I. et al. (2015), “Subjective well-being in adolescence and teacher connectedness: A health asset analysis”, The Health Education Journal, Vol.74(6), pp. 641-654, https://doi.org/10.1177/0017896914555039.
Graham, C., S. Zhou and J. Zhang (2015), “Happiness and health in China: The paradox of progress”, Global Economy and Development Working Paper, No. 89, Brookings, www.brookings.edu/wp-content/uploads/2016/07/happiness-health-progress-china.pdf.
Grol-Prokopczyk, H. et al. (2015), “Promises and pitfalls of anchoring vignettes in health survey research”, Demography, Vol. 52(5), pp. 1703-1728.
Hahn, E. et al. (2015), “Coping with unemployment: The impact of unemployment duration and personality on trajectories of life satisfaction”, The European Journal of Personality, Vol. 29(6), pp. 635-646, https://doi.org/10.1002/per.2034.
Haushofer, J., J. Reisinger and J. Shapiro (2015), “Your gain is my pain: Negative psychological externalities of cash transfers”, Working Paper, www.princeton.edu/~joha/publications/Haushofer_Reisinger_Shapiro_Inequality_2015.pdf.
Helliwell, J.F., A. Bonikowska and H. Shiplett (2016), “Migration as a test of the happiness set-point hypothesis: Evidence from immigration to Canada”, National Bureau of Economic Research Working Paper, No. 22601, www.nber.org/papers/w22601.
Helliwell, J.F., R. Layard and J.D. Sachs (eds.) (2018), World Happiness Report 2018, Sustainable Development Solutions Network, New York, http://worldhappiness.report/ed/2018/.
Helliwell, J.F., R. Layard and J.D. Sachs (eds.) (2016), World Happiness Report 2016, Sustainable Development Solutions Network, New York, http://worldhappiness.report/ed/2016/.
Helliwell, J.F., R. Layard and J.D. Sachs (eds.) (2015), World Happiness Report 2015, Sustainable Development Solutions Network, New York, http://worldhappiness.report/ed/2015/.
HM Treasury (2011), The Green Book: Appraisal and Evaluation in Central Government.
Kahneman, D. and A. Deaton (2010), “High income improves evaluation of life but not emotional well-being”, Proceedings of the National Academy of Sciences, Vol. 107(38), pp. 16489-16493.
Kahneman, D. and A.B. Krueger (2006), “Developments in the measurement of subjective well-being”, The Journal of Economic Perspectives, Vol. 20, pp. 3-24.
Kahneman, D. and A. Tversky (1979), “Prospect theory: An analysis of decisions under risk”, Econometrica, Vol. 47, pp. 263-291.
Kahneman, D. et al. (2004), “A survey method for characterizing daily life experience: The day reconstruction method”, Science, Vol. 306(5702), pp. 1776-1780.
Kim, B.J. et al. (2015), “The impact of employment and self-rated economic condition on the subjective well-being of older Korean immigrants”, The International Journal of Aging and Human Development, Vol. 81(3), pp. 189-203, https://doi.org/10.1177/0091415015607675.
Kinnunen, U. (2015), “Patterns of daily energy management at work: Relations to employee well-being and job characteristics”, International Archives of Occupational and Environmental Health, Vol. 88(8), pp. 1077-86, https://link.springer.com/article/10.1007%2Fs00420-015-1039-9.
Krueger, A.B. (2009), Measuring the Subjective Well-Being of Nations: National Accounts of Time Use and Well-Being, University of Chicago Press, Chicago.
Krueger, A.B. and D.A. Schkade (2008), “Sorting in the labor market: Do gregarious workers flock to interactive jobs?”, The Journal of Human Resources, Vol. 43(4), University of Wisconsin Press, pp. 859-883.
Layard, R., A. Clark and C. Senik (2012), “The causes of happiness and misery”, in Helliwell, J.F., R. Layard and J.D. Sachs (eds.), World Happiness Report 2012, Sustainable Development Solutions Network, New York.
Layard, R. et al. (2014), “What predicts a successful life? A life‐course model of well‐being”, The Economic Journal, Vol. 124(580), pp. F720-F738.
Lee, S. et al. (2016), “Question order sensitivity of subjective well-being measures: Focus on life satisfaction, self-rated health, and subjective life expectancy in survey instruments”, Quality of Life Research, Vol. 25(10), pp. 2497-2510.
Li, J., A. Lepp and J.E. Barkley (2015), “Locus of control and cell phone use: Implications for sleep quality, academic performance, and subjective well-being”, Computers in Human Behavior, Vol. 52, pp. 450-457, https://doi.org/10.1016/j.chb.2015.06.021.
Linna, M.S. et al. (2015), “Body mass index and subjective well-being in young adults: A twin population study”, BMC Public Health, Vol. 13, p. 231, https://doi.org/10.1186/1471-2458-13-231.
Liu, B. et al. (2016), “Happiness, health, and mortality reply”, The Lancet, Vol. 388(10039), pp. 27-28.
Loi, S.M. et al. (2015), “Attitudes to aging in older carers – Do they have a role in their well-being?”, International Psychogeriatrics, Vol. 27(11), pp. 1893-1901, https://doi.org/10.1017/S1041610215000873.
Lucas, R.E. (2007), “Long-term disability is associated with lasting changes in subjective well-being: Evidence from two nationally representative longitudinal studies”, The Journal of Personality and Social Psychology, Vol. 92(4), pp. 717-730.
Ludwig, J. et al. (2013), “Long-term neighbourhood effects on low-income families: Evidence from moving to opportunity”, The American Economic Review, Vol. 103(3), pp. 226-31.
Meisenberg, G. and M. Woodley (2015), “Gender differences in subjective well-being and their relationships with gender equality”, The Journal of Happiness Studies, Vol. 16(6), pp. 1539-55, http://10.0.3.239/s10902-014-9577-5.
Miret, M. et al. (2012), “Validation of a measure of subjective well-being: An abbreviated version of the day reconstruction method”, PLoS One, Vol. 7(8).
Muller, Z. and H. Litwin (2011), “Grandparenting and psychological well-being: How important is grandparent role centrality?”, The European Journal of Ageing, Vol. 8(2), pp. 109-118, https://dx.doi.org/10.1007%2Fs10433-011-0185-5.
Mwesigire, D.M. et al. (2015), “Relationship between CD4 count and quality of life over time among HIV patients in Uganda: A cohort study”, Health and Quality of Life Outcomes, Vol. 13, p. 144, https://doi.org/10.1186/s12955-015-0332-3.
National Research Council (2012), “The subjective well-being module of the American Time Use Survey: Assessment for its continuation”, Panel on Measuring Subjective Well-Being in a Policy-Relevant Framework, Washington D.C.
De Neve, J‐E. et al. (2015), “The asymmetric experience of positive and negative economic growth: Global evidence using subjective well-being data”, The Review of Economics and Statistics, Vol. 100(2), pp. 362-375.
Niimi, Y. (2015), “The ‘costs’ of informal care: An analysis of the impact of elderly care on caregivers’ subjective well-being in Japan”, MPRA Paper, No. 67825, Munich Personal RePEc Archive, https://mpra.ub.uni-muenchen.de/67825/.
Nikolaev, B. (2015), “Living with mom and dad and loving it…or Are you?”, The Journal of Economic Psychology, Vol. 51, pp. 199-209, https://doi.org/10.1016/j.joep.2015.08.009.
Odermatt, R. and A. Stutzer (2015), “Smoking bans, cigarette prices and life satisfaction”, The Journal of Health Economics, Vol. 44, pp. 176-94, https://doi.org/10.1016/j.jhealeco.2015.09.010.
O’Donnell, G. et al. (2014), Wellbeing and Policy, Legatum Institute, London.
OECD (2015a), How’s Life? 2015: Measuring Well-being, OECD Publishing, Paris, https://doi.org/10.1787/how_life-2015-en.
OECD (2015b), Skills for Social Progress: The Power of Social and Emotional Skills, OECD Skills Studies, OECD Publishing, Paris, https://doi.org/10.1787/9789264226159-en.
OECD (2013), OECD Guidelines on Measuring Subjective Well-being, OECD Publishing, Paris, https://doi.org/10.1787/9789264191655-en.
Oswald, A.J. and N. Powdthavee (2008), “Does happiness adapt? A longitudinal study of disability with implications for economists and judges”, The Journal of Public Economics, Vol. 92, pp. 1061-1077.
Ouyang, Y. et al. (2015), “People higher in self-control do not necessarily experience more happiness: Regulatory focus also affects subjective well-being”, Personality and individual differences, Vol. 86, pp. 406-411.
Raque-Bogdan, T.L. and M.A. Hoffman (2015), “The relationship among infertility, self-compassion, and well-being for women with primary or secondary infertility”, Psychology of Women Quarterly, Vol. 39(4), pp. 484-496, https://doi.org/10.1177/0361684315576208.
Read, S., E. Grundy and E. Foverskov (2015), “Socio-economic position and subjective health and well-being among older people in Europe: A systematic narrative review”, Aging and Mental Health, Vol. 20(5), pp. 529-542, https://doi.org/10.1080/13607863.2015.1023766.
Roback, J. (1982), “Wages, rents and the quality of life”, The Journal of Political Economy, Vol. 90(6), pp. 1257-1278.
Rosen, S. (1986), “The theory of equalizing differences”, in Ashenfelter, O.C. and R. Layard, Handbook of Labor Economics, Vol. 1, Elsevier, North-Holland, Amsterdam, pp. 641-692.
Ryff, C.D. (2014), “Self-realisation and meaning making in the face of adversity: A eudaimonic approach to human resilience”, The Journal of Psychology in Africa, Vol. 24(1), pp. 1-12.
Sage, D. (2015), “Do active labour market policies promote the subjective well-being of the unemployed? Evidence from the UK National Well-Being Programme”, The Journal of Happiness Studies, Vol. 16(5), pp. 1281-98, https://doi.org/10.1007/s10902-014-9549-9.
Saito, M. et al. (2015), “Development of an instrument for community-level health related social capital among Japanese older people: The JAGES Project”, The Journal of Epidemiology, Vol. 27(5), pp. 221-227, https://doi.org/10.1016/j.je.2016.06.005.
Senik, C. (2014), “The French unhappiness puzzle: The cultural dimension of happiness”, The Journal of Economic Behavior and Organization, Vol. 106, pp. 379-401.
Shiffman, S., A.A. Stone and M.R. Hufford (2008), “Ecological momentary assessment”, The Annual Review of Clinical Psychology, Vol. 4, pp. 1-32.
Shiue, I. (2015), “ Less indoor cleaning is associated with poor health and unhappiness in adults: Japanese General Social Survey, 2010”, Environmental Science and Pollution Research, Vol. 22(24), pp. 20312-15, https://doi.org/10.1007/s11356-015-5643-8.
Silva, J., F. de Keulenaer and N. Johnstone (2012), “Environmental quality and life satisfaction: Evidence based on micro-data”, OECD Environment Working Papers, No. 44, OECD Publishing, Paris, https://doi.org/10.1787/5k9cw678dlr0-en.
Steinmayr, R. et al. (2015), “Subjective well-being, test anxiety, academic achievement: Testing for reciprocal effects”, Frontiers in Psychology, Vol. 6, p. 1994, https://doi.org/10.3389/fpsyg.2015.01994.
Stemer, B. et al. (2015), “Bright versus dim ambient light affects subjective well-being but not serotonin-related biological factors”, Psychiatry Research, Vol. 229(3), pp. 1011-16, https://doi.org/10.1016/j.psychres.2015.05.068.
Stengård, J. et al. (2015), “Understanding the determinants of well-being and organizational attitudes during a plant closure: A Swedish case study”, Economic and Industrial Democracy, Vol. 36(4), pp. 611-631, https://doi.org/10.1177/0143831X14527775.
Steptoe, A., A. Deaton and A.A. Stone (2015), “Subjective wellbeing, health, and ageing”, The Lancet, Vol. 385(9968), pp. 640-648.
Stevenson, B. and J. Wolfers (2012), “Subjective well-being and income: Is there any evidence of satiation?”, The American Economic Review, Vol. 103, pp. 598-604.
Stickley, A. et al. (2015), “Crime and subjective well-being in the countries of the former Soviet Union”, BMC Public Health, Vol. 15, p. 1010, https://doi.org/10.1186/s12889-015-2341-x.
Stiglitz, J.E., A. Sen and J.-P. Fitoussi (2009), Report by the Commission on the Measurement of Economic and Social Progress, http://ec.europa.eu/eurostat/documents/118025/118123/Fitoussi+Commission+report.
Stillman, S. et al. (2015), “Miserable migrants? Natural experiment evidence on international and objective and subjective well-being”, World Development, Vol. 65, pp. 79-93.
Stone, A.A. and C. Mackie (2015), Subjective Well-Being: Measuring Happiness, Suffering, and Other Dimensions of Experience, The National Academies Press, Washington, D.C.
Stone, A.A. and S. Shiffman (1994), “Ecological momentary assessment (EMA) in behavioral medicine”, Annals of Behavioral Medicine, Vol. 16, pp. 199-202.
Stone, A.A. and C. Smith (2015), “Developments in the day reconstruction method and related methods: Review and new directions”, unpublished Report, University of Southern California.
Stone, A.A. et al. (2010), “A snapshot of the age distribution of psychological well-being in the United States”, Proceedings of the National Academy of Sciences of the United States of America, Vol. 107(22), pp. 9985-9990.
Tiefenbach, T. and F. Kohlbacher (2015), “Disasters, donations, and tax law changes: Disentangling effects on subjective well-being by exploiting a natural experiment”, The Journal of Economic Psychology, Vol. 50, pp. 94-112, https://doi.org/10.1016/j.joep.2015.07.005.
UNECE (2013), Guidelines for Harmonizing Time-Use Surveys, United Nations Economic Commission for Europe, Geneva, www.unece.org/stats/publications/time_use_surveys.html.
United Kingdom Cabinet Office and Ipsos MORI (2013), National Citizen Service 2013 Evaluation: Main Report, www.ipsos-mori.com/researchpublications/publications/1692/National-Citizen-Service-2013-Evaluation.aspx.
Veenhoven, R. (2012), “Cross-national differences in happiness: Cultural measurement bias or effect of culture?”, The International Journal of Wellbeing, Vol. 2(4).
Ward, G. (2015), “Is happiness a predictor of election results?”, Centre for Economic Performance Discussion Paper, No. 1343, http://cep.lse.ac.uk/pubs/download/dp1343.pdf.
Weiss, A. et al. (2012), “Evidence for a midlife crisis in great apes consistent with the U-shape in human well-being”, Proceedings of the National Academy of Sciences, Vol. 109, pp. 19949-19952.
Wicker, P., D. Coates and C. Breuer (2015), “Physical activity and subjective well-being: The role of time”, The European Journal of Public Health, Vol. 25(5), pp. 864-868, https://doi.org/10.1093/eurpub/ckv053.
Woodhouse, E. et al. (2015), “Guiding principles for evaluating the impacts of conservation interventions on human well-being”, Philosophical Transactions B, Royal Society, https://doi.org/10.1098/rstb.2015.0103.
Zagonari, F. (2015), “Technology improvements and value changes for sustainable happiness: A cross-development analytical model”, Sustainability Science, Vol. 10(4), pp. 687-698, https://link.springer.com/article/10.1007%2Fs11625-015-0311-y.
Zilioli, S., L. Imami and R.B. Slatcher (2015), “Socioeconomic status, perceived control, diurnal cortisol, and physical symptoms: A moderated mediation model”, Psychoneuroendocrinology, Vol. 75, pp. 36-43, https://doi.org/10.1016/j.psyneuen.2016.09.025.
Notes
← 1. Albeit often looking at longer-term aspects of affective experience, such as feelings and emotions in the last two weeks, which can confound evaluative and experiential well-being.
← 2. http://worldhappiness.report/.
← 3. A remaining concern is that, even though context effects can be reduced or eliminated through good survey design, if subjective well-being measures are particularly vulnerable to them this would imply that the underlying construct is not stable. This is however difficult to test empirically and is controversial. That said, substantial evidence on the validity of life evaluation measures, and their consistent relationship to objective factors, suggests that people can and do provide meaningful responses to these evaluative questions.