Chapter 2. SME and entrepreneurship characteristics and performance in Indonesia
This chapter first presents information on the structure of the Indonesian SME sector and its performance in terms of productivity, export, investment and innovation. Second, it offers an overview of entrepreneurial attitudes, entrepreneurship performance and business ownership in Indonesia. The chapter shows that the average Indonesian SME is small by international standards, but that there has been a recent consolidation by which larger SMEs (e.g. medium-sized firms) have come to account for a larger share of total employment and total investment. However, Indonesian SMEs continue to be poorly integrated in global markets and do not undertake much R&D or other forms of innovation. Entrepreneurial attitudes are generally positive in Indonesian society, but risk aversion is still high and contributes, together with other factors, to low entrepreneurial activity (i.e. the act of being in the process of creating a business). On the other hand, business ownership is widespread and one of the contributing factors to the small size of Indonesian SMEs.
The structure of the Indonesian SME sector
This section adopts a two-pronged approach. First, it uses data from the Indonesian Ministry of Co-operatives and SMEs, which include the agricultural sector and are based on estimates from co-operative membership, to provide a domestic overview of trends in firm size distribution and employment distribution in the Indonesian SME sector. Second, it combines data from the OECD Structural and Demography Business Statistics (SDBS) Database and the 2016 Indonesian Economic Census to present comparable information for OECD and Indonesia on the proportion of small companies (1-19 people employed) out of the total business population and the proportion of total employment in such small companies.
Two main SME definitions are used in this chapter, one based on turnover/assets which follows the provisions of Law 20/2008 (i.e. the so-called MSME Law) and which is used by the Ministry of Co-operatives and SMEs, and one based on employment which is used by the Indonesian Central Bureau of Statistics (Badan Pusat Statistik, BPS) (see Box 2.1).
It should be noted that data from the Ministry of Co-operatives and SMEs and from BPS mostly cover the informal sector. The economic census, owing to the universality of its sample, includes unregistered businesses, while data from the Ministry of Co-operatives and SMEs cover agriculture (i.e. farmers are considered entrepreneurs) where informality is very common.
Estimates of the informal sector in Indonesia vary, but universally point to a large sector. Rothenberg et al. (2016), after pooling the 2010-2013 waves of the BPS Survey of Micro and Small Enterprises (Survei Industri Mikro dan Kecil, IMK), found that 96% of micro firms (with less than 5 people employed) and 93.2% of small firms (5-19 people employed) were informal. In previous studies, using labour force surveys, researchers had found that the informal sector employed between 61% and 70% of the total labour force (Alatas and Newhouse, 2010). The most recent OECD Economic Survey of Indonesia estimates that about 70% of national employment is informal, and that informality is above the national average among women, youth and older people (aged above 55 years), as well as in certain sectors such as agriculture, construction and transport and storage (OECD, forthcoming).
Simulations by the OECD suggest that easing labour market regulation to the OECD average level over ten years could shrink Indonesia’s informal sector by about 40 percentage points, and that simplifying product market regulation from its 2013 level to the OECD average could lower informality by almost 25 percentage points (OECD, forthcoming). This underscores the importance of product and labour market regulatory reforms to reduce informality.
Law 20/2008 (Ministry of Co-operatives and SMEs)
The Ministry of Co-operatives and SMEs defines SMEs based on the National Law 20/2008 (Art. 6), by which micro, small and medium-sized enterprises are defined according to the following criteria:
-
Micro-enterprises:
-
Enterprises which have maximum net assets of IDR 50 million, not including the land and buildings used by the business; or
-
Enterprises which have maximum annual revenues of IDR 300 million.
-
-
Small enterprises:
-
Enterprises which have net assets of more than IDR 50 million but less than IDR 500 million, not including the land and buildings used by the business; or
-
Enterprises which have annual revenues of more than IDR 300 million but less than IDR 2.5 billion.
-
-
Medium-sized enterprises:
-
Enterprises which have net assets of more than IDR 500 million but less than IDR 10 billion, not including the land and buildings used by the business; or
-
Enterprises which have annual revenues of more than IDR 2.5 billion but less than IDR 50 billion.
-
This definition includes the agricultural sector and is, therefore, likely to result in an overestimation of the micro-enterprise segment through the inclusion of farmers.
Central Bureau of Statistics (Badan Pusat Statistik, BPS)
The Central Bureau of Statistics uses an employment-based definition of SMEs by which micro-enterprises are enterprises employing 1-4 people, small enterprises employ 5-19 people, medium-sized enterprises 20-99 people, and large enterprises above 100 people. This definition is used in the 2016 Indonesian Economic Census and in the BPS Survey of Micro and Small Enterprises (Survei Industri Mikro dan Kecil, or IMK), which were undertaken in collaboration with the Ministry of Co-operatives and SMEs until 2015.
Business distribution by size class
Based on data from the Ministry of Co-operatives and SMEs, Indonesia had nearly 59.3 million enterprises in 2014, up from 49 million in 2006, corresponding to an annual average increase of 2.4% over the period 2006-2014.1 This upsurge is partly explained by demographic dynamics – the population in Indonesia increased by 1.3% between 2006 and 2014 – but also by the sustained growth of the Indonesian economy, which expanded at an annual rate of 5.8% over the same time period (see Table 2.1).
Micro-enterprises represent the overwhelming majority of business enterprises in Indonesia, accounting for 98.75% of the total in 2014, 0.2 percentage points less than in 2006 (98.95%). Small and medium-sized enterprises accounted for 1.15% and 0.10% of the total stock of companies in 2014, respectively 0.2 and 0.3 percentage points more than in 2006. There has therefore been a consolidation process in the Indonesian SME sector over the period 2006-2014, to the extent that the proportion of micro-enterprises inched down and the proportions of small and medium-sized enterprises inched up. However, the share of large enterprises remained unchanged, pointing to the presence of barriers to further business growth.
Despite the recent consolidation, the Indonesian SME sector is still dominated by very small enterprises, as shown by Figure 2.1 which indicates the share of companies employing less than 20 people across OECD countries and Indonesia.2 These companies make up 98.5% of the total enterprise population in Indonesia, one of the highest percentage values in comparison with OECD countries and a much higher figure than, for example, that of another emerging-market economy like Brazil (93.6%).3
On the whole, therefore, structural business data show that the Indonesian SME sector, despite some recent consolidation, is still dominated by very small companies. Further consolidation, through the scale-up of existing SMEs, could play an important role in driving national economic growth and poverty reduction strategies, in that a smaller number of larger SMEs are expected to offer better jobs (i.e. more productive and with better working conditions) and better access to public services than a very large number of own-account workers and micro-enterprises.
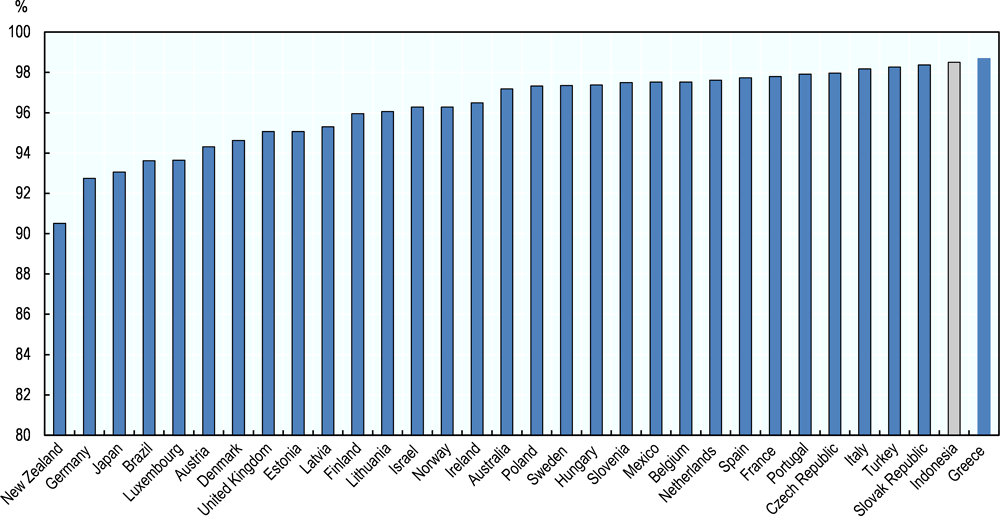
Note: Data refer to enterprises, except for Indonesia, Korea and Mexico where data refer to establishments. For countries which use establishments as the measurement unit, this may lead to an overestimation of small size classes such as the one taken into consideration in this figure. However, since when compared with the total business population most enterprises consist of only one establishment, problems in comparability are not expected to be significant. Data for Indonesia are from 2016, data for most OECD countries refer to 2014. Data from the Indonesian Economic Census exclude agriculture, forestry, fishery, government administration, defence and social security sectors, and household activities. Unregistered businesses are included.
Source: OECD (2017), Entrepreneurship at a Glance 2017, OECD Publishing, Paris, https://doi.org/10.1787/entrepreneur_aag-2017-en and Indonesian Economic Census 2016.
Employment distribution by size class
Data from the Indonesian Ministry of Co-operatives and SMEs show that the private sector, including agriculture, employed nearly 127.5 million people in 2014, i.e. nearly three-quarters of the economically active population of Indonesia (170.5 million). The proportion of people employed in SMEs hovered around 97% (between 96.7% and 97.3%) over the period 2006-2014; however, this aggregate figure hides some important changes which occurred within the SME sector during this period. In particular, micro-enterprises employed 87% of the private-sector workforce in 2014, down from nearly 91% in 2006, whereas small enterprises employed 5.7% in 2014, up from 3.5% in 2006, and medium-sized enterprises employed 4% in 2014, up from 3% in 2006. On the other hand, the share of private-sector employment for large companies only changed by about half a percentage point between 2006 and 2014 (see Table 2.2). These data, therefore, corroborate the hypothesis of a recent consolidation process by which larger SMEs (small and medium-sized companies to the disadvantage of micro-enterprises) have come to account for a larger share of the economy.
Nonetheless, comparable data from the 2016 Indonesian Economic Census and the OECD SDBS database show that Indonesian SMEs are generally still much smaller in size than the OECD average. Small companies (1-19 people employed) accounted for 76.3% of Indonesian employment in 2016, more than in any OECD country (Figure 2.2). Based on data from the BPS IMK Survey, Rothenberg et al. (2016) also found that over two-thirds of such firms have no more than two people employed.
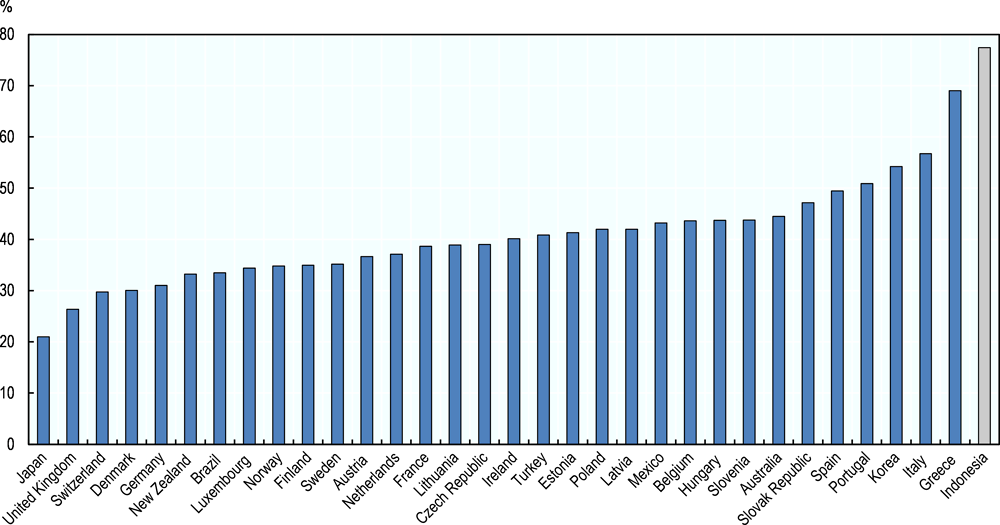
Note: Data refer to enterprises, except for Indonesia, Korea and Mexico where data refer to establishments. Data for Korea and Japan refer to employees, rather than to total people employed. For countries which use establishments as the measurement unit, this may lead to an overestimation of small enterprise size classes such as the one taken into consideration in this figure. However, since most small enterprises consist of only one establishment, problems in comparability are not expected to be significant. Data for Indonesia are from 2016, data for most OECD countries refer to 2014. Data from the Indonesian Economic Census exclude agriculture, forestry, fishery, government administration, defence and social security sectors, and household activities. Unregistered businesses are included.
Source: OECD (2017), Entrepreneurship at a Glance 2017, OECD Publishing, Paris, https://doi.org/10.1787/entrepreneur_aag-2017-en and Indonesian Economic Census 2016.
The performance of Indonesian SMEs
This section follows a three-pronged approach. First, it draws on data from the Indonesian Ministry of Co-operatives and SMEs to show recent productivity trends in Indonesian SMEs (including the agricultural sector), as well as information on their export and investment activity. Second, it combines data from the OECD Structural and Demography Business Statistics (SDBS) database and the BPS IMK Survey to present comparable information for OECD countries and Indonesia on the productivity and export performance of small companies (1-19 people employed) within the manufacturing industry. Third, it uses data from the World Bank Enterprise Surveys (WBES) to offer a comparative perspective on SME performance across selected ASEAN (Association of Southeast Asian Nations) economies.
The productivity of Indonesian SMEs
Productivity is a key driver of long-term economic growth, especially as economies seek to move from a middle-income status in which labour utilisation still plays an important role, to a high-income status in which growth is mostly driven by productivity gains. Labour productivity (GDP per worker) in Indonesia was USD 24 300 in 2015, behind Singapore (USD 127 800), Malaysia (USD 55 700) and Thailand (USD 26 500), but above all other ASEAN economies and the ASEAN average (USD 21 900) (APO, 2017).4 The government of Indonesia has set the target of increasing labour productivity by 40% by 2019, which implies a larger number of high-quality jobs in the formal economy and a structural transformation of the economy in which an increasing share of jobs is created in manufacturing and supporting services (OECD, 2016).
Data from the Indonesian Ministry of Co-operatives and SMEs, which include agriculture, provide a first estimate of recent productivity trends among Indonesian SMEs. GDP per worker (at current prices) in micro-enterprises was about USD 8 400 in 2013, only 3% of GDP per worker in large enterprises (USD 266 328), while GDP per worker in small and medium-sized enterprises was respectively 16% (USD 41 460) and 31% (USD 82 540) of that of large companies. This is in line with Rothenberg et al. (2016), who found that the median micro or small firm (up to 20 employees) had a value added per worker of less than 5% of the average value added per worker of large firms (100+ employees).
Productivity growth net of inflation (i.e. using GDP at constant prices) over the period 2006-2013 was modest across all business size classes, with average annual rates between 0.3% (small enterprises) and 1.1% (micro-enterprises) (Table 2.3), despite the fact that the Indonesian economy continued to expand rapidly over this period, with annual growth rates between 4.5% and 6.3%. This suggests that economic growth in Indonesia has mostly been driven by factors other than firm-level productivity, such as consumer spending, government spending and increased labour force utilisation.
Comparable information on the labour productivity performance (turnover per person employed) of small companies (1-19 employees) in manufacturing can be drawn from Indonesian BPS data (IMK survey) and the OECD SDBS database. The average labour productivity of Indonesian small manufacturers was about USD 38 000 in 2015, higher than Mexico but lower than Brazil, two other large emerging-market economies (Figure 2.3).5 This corresponded to one-quarter of the OECD median value (USD 146 000).
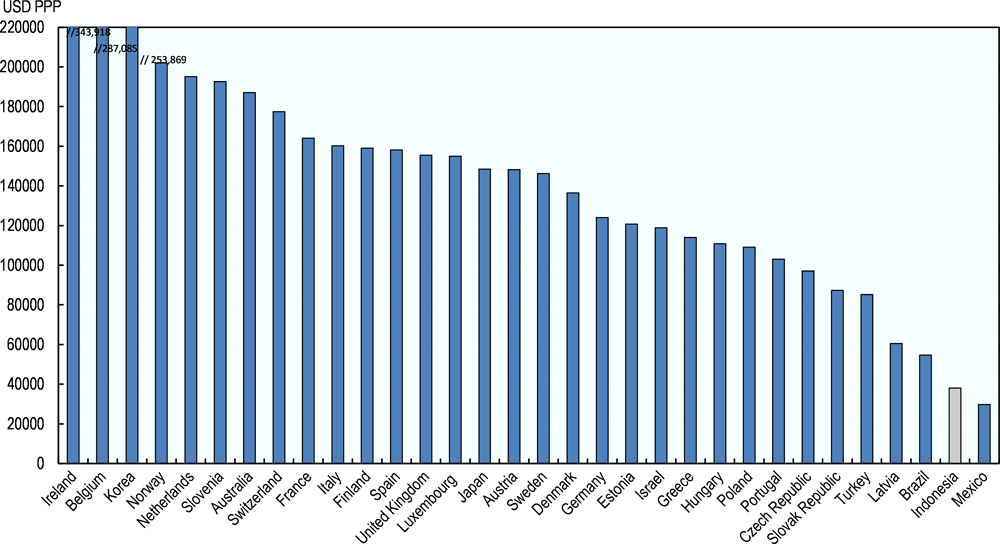
Note: Labour productivity is measured as turnover per worker (rather than as value added per worker) to enable the comparison between OECD countries and Indonesia. Data for Indonesia refer to 2015. Productivity levels in national currencies are converted to USD, using 2014 USD PPP conversion rates.
Source: OECD based on OECD Structural and Demography Business Statistics (SDBS) database, Indonesian Central Bureau of Statistics and OECD Purchasing Power Parity (PPP) statistics.
Data from the World Bank Enterprise Survey (WBES) allow for a comparison of productivity growth trends across selected ASEAN economies. Altogether, average labour productivity growth (measured as turnover per person employed) over the three years preceding the national surveys has been modest across the whole ASEAN region. Indonesian small (5-19 employees) and large enterprises (100+ employees) experienced average negative growth over the period 2012-2015 (-1.2% and -2.4%), while medium-sized companies recorded slightly positive growth (+2%) (Figure 2.4).
To summarise, productivity levels in Indonesian SMEs are still low compared not only with OECD countries (one-quarter of the OECD median value in the case of small manufacturers), but also relative to other emerging-market economies such as Brazil. Enhancing SME productivity will be important not only to sustain economic growth, but also to reduce social inequalities by increasing the income of small business workers.
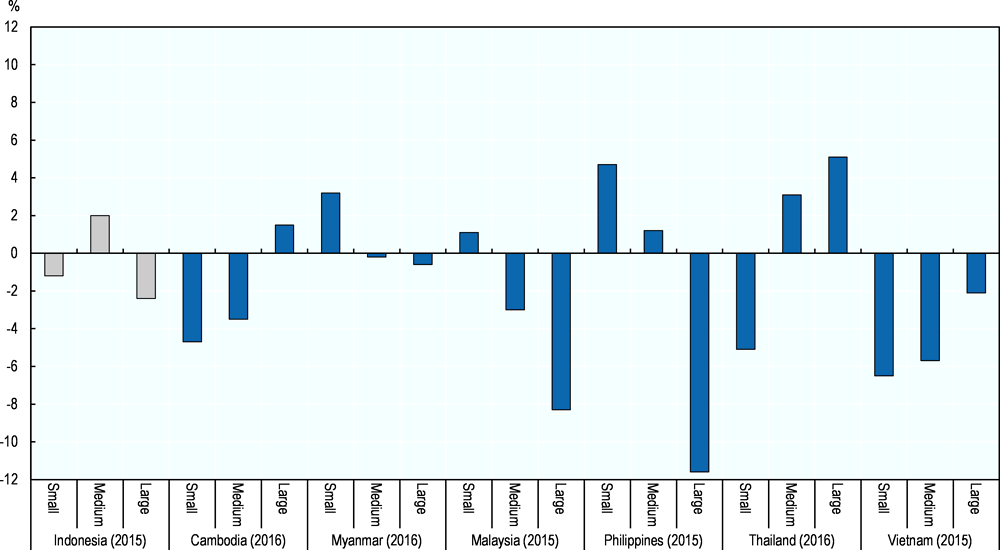
Note: Small companies are companies with 5-19 employees; medium-sized with 20-99 employees; large companies with 100+ employees. Average labour productivity growth in the WBES is measured over the three years preceding the national survey.
Source: World Bank Enterprise Survey (WBES) Database.
The export performance of Indonesian SMEs
Exporting companies have typically already achieved levels of competitiveness which enable them to enter international markets. At the same time, exporting companies further improve their efficiency by being exposed to the competitive pressure and market knowledge of foreign markets. This self-reinforcing process makes exporting a key driver of SME performance.
Based on data from the Ministry of Co-operatives and SMEs, Indonesia’s export activity (excluding the oil and gas sector) is strongly dominated by large companies. Large companies (as defined in Box 2.1) accounted for 84.3% of total exports in Indonesia, up from 82% in 2006. Conversely, the proportions of total exports by other firm size classes declined over the same period 2006-2013: from 12.2% to 11.5% for medium-sized firms; from 4% to 2.8% for small enterprises; and from 1.7% to 1.4% for micro-enterprises (Figure 2.5). Such statistics are affected by the large weight of commodities (e.g. palm oil, coal, rubber, etc.) in Indonesia’s national exports, as well as by the large informal sector which undermines the contribution of SMEs to national exports (since companies need to operate in the formal economy to export).
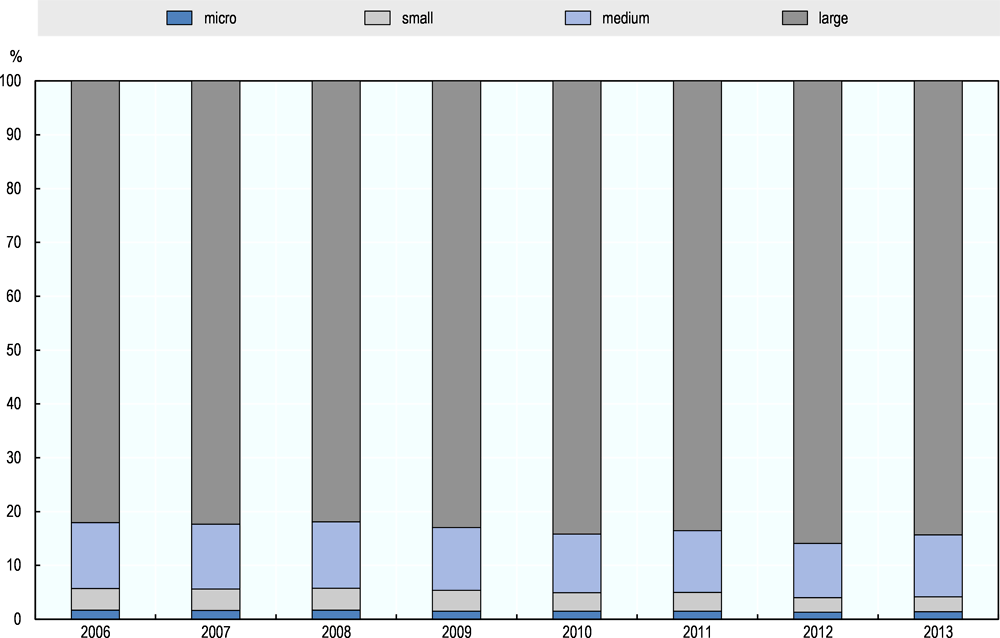
Note: The SME definition of Law 20/2008 is used in this graph.
Source: OECD based on data from the Ministry of Co-operatives and SMEs.
By the same token, over the period 2006-2013, the average export performance (i.e. total export volume divided by the number of firms by firm size) increased by an annual rate of 6.9% for large companies, but only by 2.4% for medium-sized companies and 3% for micro-enterprises, whereas the average export performance of small enterprises declined at an annualised rate of 1.7%. The overall picture is, therefore, one in which export activity is mostly driven by the large corporate sector in Indonesia, and this feature has become even more prominent over the last seven years (2006-2013) for which data are available.6
Data from the World Bank Enterprise Survey (WBES) allow for a comparative analysis of export performance by firm size across selected ASEAN economies. Figure 2.6 shows the proportion of firms in each country exporting (at least 10% of total sales) either directly or indirectly (as suppliers of exporting companies). Both variables are affected by the size of the domestic economy since companies located in large countries (such as Indonesia) are under less pressure to export to be able to grow. Furthermore, the second variable (indirect exports) provides an indication of the ability of SMEs to tap into global supply chains.
Overall, as many as 10% of firms export directly (6.4%) or indirectly (3.6%) in Indonesia, which is less than in Malaysia (19.4%), Cambodia (14%) and Vietnam (12.8%), but more than in the Philippines (8.5%), Thailand (5.1%) and Myanmar (4.8%). A break-down by firm size corroborates these aggregate figures. Indonesian small and medium-sized enterprises are less integrated into global markets than those of Cambodia, Malaysia and Vietnam (with the exception of small firms in Vietnam), but more integrated than those of the other three ASEAN economies taken into consideration (Myanmar, the Philippines and Thailand).
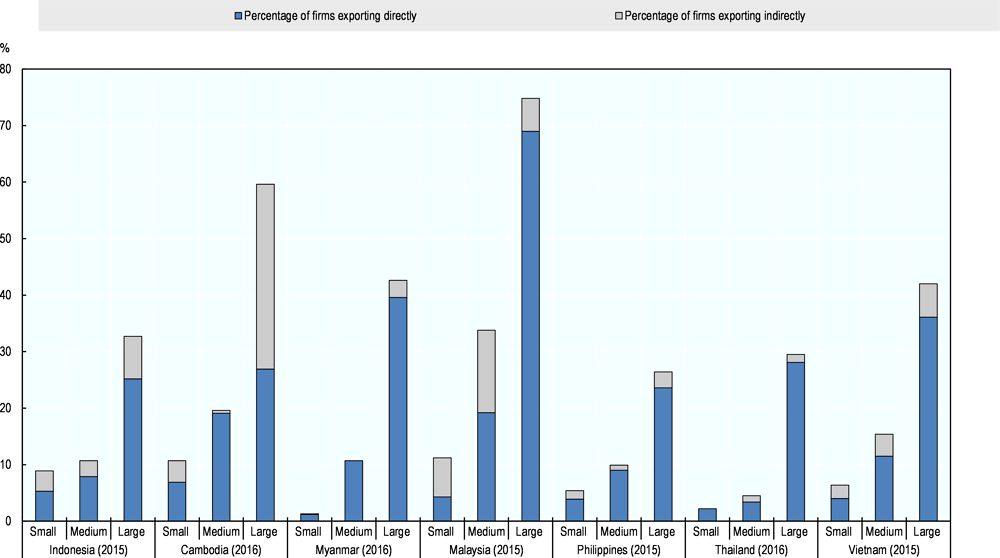
Note: Small companies are companies with 5-19 employees; medium-sized with 20-99 employees; large companies with 100+ employees. Only firms which export at least 10% of total sales are considered exporters.
Source: OECD based on World Bank Enterprise Survey database.
On the other hand, the percentage of firms using foreign-origin inputs in the production process is lower in Indonesia than in all other ASEAN economies analysed (except Thailand) across all three business size classes, which may point to existing restrictions to imports (see chapter 3) (Figure 2.7).
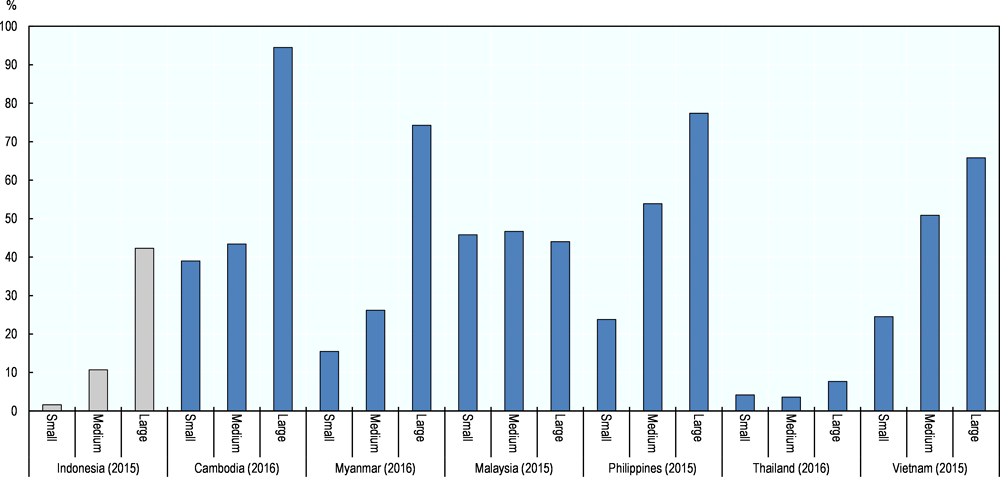
Note: Small companies are companies with 5-19 employees; medium-sized with 20-99 employees; large companies with 100+ employees. This graph only considers the manufacturing sector.
Source: OECD based on World Bank Enterprise Survey database.
Tangible and intangible investments in Indonesian SMEs
Aggregate investment is also driven by the large corporate sector in Indonesia, albeit less than in the case of exports. Large companies accounted for 43.8% of total aggregate investments in 2013, down from 48.4% in 2006. Total investments by small and micro-enterprises also dropped over the same period, respectively from 20.7% to 18.4% and from 8.6% to 6.9%, to the advantage of medium-sized enterprises, whose shares of aggregate investments leapt from 22.4% in 2006 to 30.9% in 2013 (Figure 2.8). Average investment by firm size (i.e. total investment divided by the number of firms by firm size) has also increased considerably more for medium-sized companies (+7.8% on an annual basis) than for large (5.4%), small (1.6%) and micro-enterprises (2.6%), confirming the consolidation process by which larger SMEs (e.g. medium-sized firms) have assumed a greater role in the economy, especially in terms of aggregate investment and aggregate employment (export being an exception, as noted earlier).7
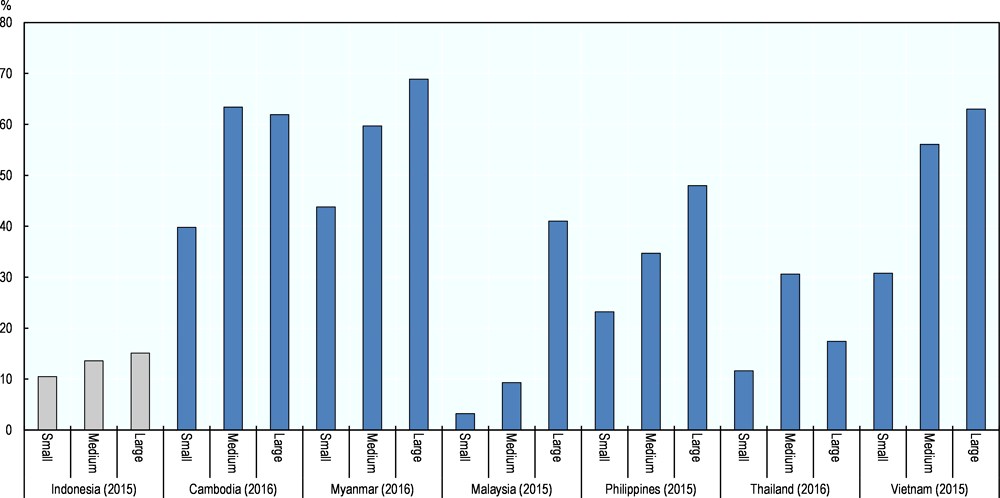
When compared to other ASEAN economies, the percentage of firms buying fixed assets in Indonesia is only 11.1% of the total, less than in the other benchmarked countries except for Malaysia (6.7%). On the other hand, there is not much difference in the investment propensity across different firm size classes in Indonesia, with the proportion of firms buying fixed assets ranging between 10.5% among small companies and 15.1% among large companies (Figure 2.9).
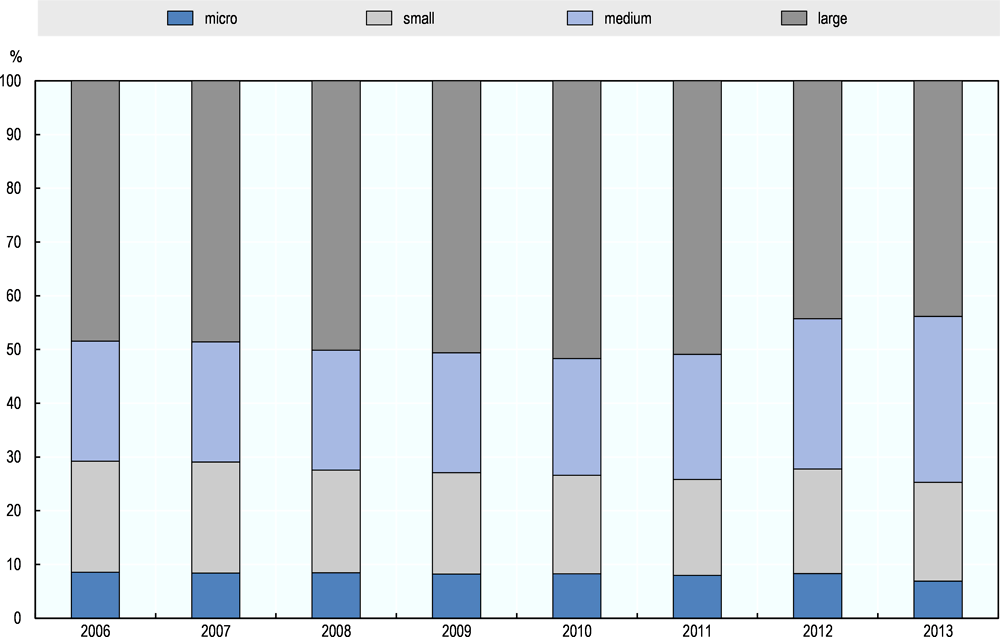
Note: Data in constant prices. The SME definition of Law 20/2008 is used in this graph.
Source: OECD based on data from the Ministry of Co-operatives and SMEs.
Note: Small companies are companies with 5-19 employees; medium-sized with 20-99 employees; large companies with 100+ employees.
Source: OECD based on World Bank Enterprise Survey database.
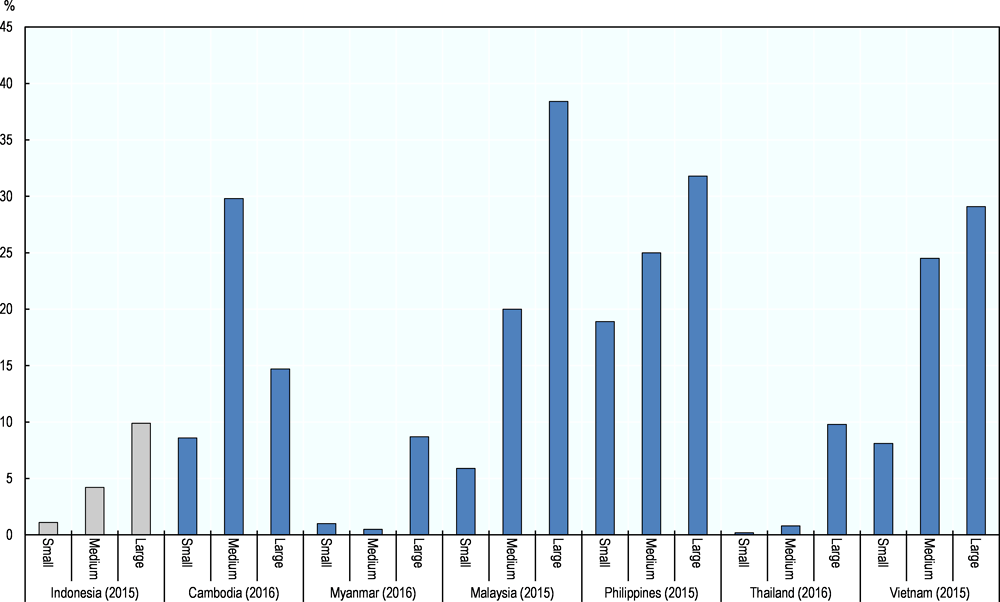
Investments in intangible assets have also become a key driver of productivity growth (Haskel and Westlake, 2017). Based on survey data from the World Bank Enterprise Survey, the proportion of firms which invest in R&D, one of the most common forms of intangible asset and often a precondition of product development, is only about 2% in Indonesia, much less than in Vietnam (15.7%) and Malaysia (10.5%). There is, nonetheless, some heterogeneity in R&D performance in the Indonesian business sector, with only 1% of small firms (5-19 employees) but as many as 10% of large firms (100+ employees) investing in R&D (Figure 2.10).
R&D outcomes are affected by a number of structural conditions, including the weight of manufacturing (which is more R&D-driven than services or agriculture) in the economy, the average enterprise size (i.e. larger firms are more likely to engage in R&D) and the degree of informality in the economy (i.e. informal businesses are by definition reluctant to invest).
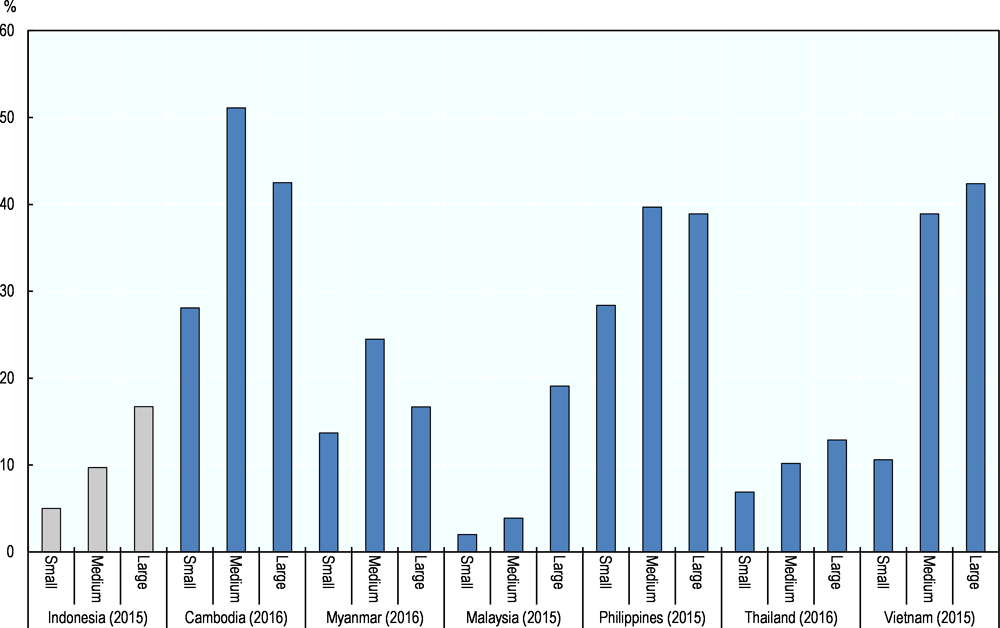
The proportion of firms which has introduced new products or services is also lower in Indonesia (6.2%) than in the other benchmarked ASEAN economies, again with the significant exception of Malaysia (3.5%), which also had a lower proportion of firms buying fixed assets. Only 5% of small enterprises (5-19 employees) and 9.7% of medium-sized enterprises (20-99 employees) have introduced a new product or service in Indonesia, which is more than in Malaysia (2% and 3.9% respectively), similar to Thailand (6.9% and 10.2% respectively), but less than in the other ASEAN economies (Figure 2.11).
Note: Small companies are companies with 5-19 employees; medium-sized with 20-99 employees; large companies with 100+ employees.
Source: OECD based on World Bank Enterprise Survey database.
Note: Small companies are companies with 5-19 employees; medium-sized with 20-99 employees; large companies with 100+ employees.
Source: OECD based on World Bank Enterprise Survey database.
Enhancing the innovation performance of Indonesian SMEs, both in terms of inputs (e.g. investments in R&D) and outcomes (e.g. new products), will be one of the vehicles to strengthen SME productivity and, thereby, improve the contribution of Indonesian SMEs to economic growth and social inclusion through the offer of better quality jobs.
Entrepreneurship performance in Indonesia
Entrepreneurial attitudes
Positive entrepreneurial attitudes (e.g. self-confidence and risk assessment) are important drivers of successful entrepreneurship. Data from the Global Entrepreneurship Monitor (GEM) research consortium show that nearly half (47.7%) of the Indonesian adult population (aged 18-64) see good opportunities to start a business in the area where they live, which is higher than the OECD median value (42.6%) and higher than all other BRICS economies. However, risk aversion, as measured by “fear of failure” (i.e. the proportion of people perceiving good opportunities in the local market who indicate that fear of failure would prevent them from setting up a business) is relatively high in Indonesia, at 47%, compared with the OECD median value of only 37%. Risk aversion is also higher in Indonesia than in all BRICS economies, and only second to Thailand among the ASEAN economies for which GEM data are available (Figure 2.12).
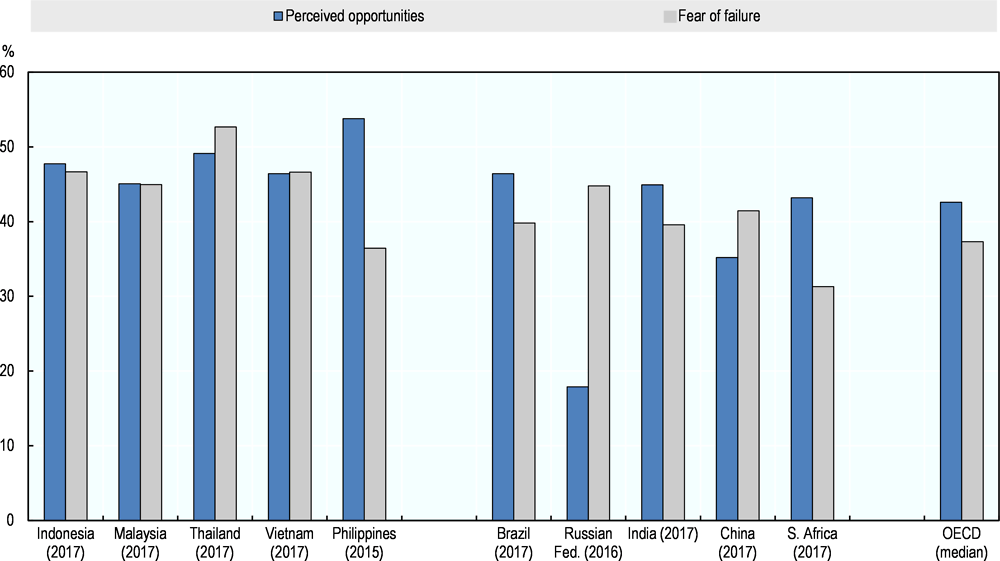
Note: Perceived opportunities: Percentage of total adult population (aged 18-64) who see good opportunities to start a business in the area where they live. Fear of failure: Percentage of total adult population (aged 18-64) with positive perceived opportunities who indicate that fear of failure would prevent them from setting up a business.
Source: OECD based on Global Entrepreneurship Monitor (GEM) database.
Perceived entrepreneurial skills are strong in Indonesia: 57.3% of Indonesian adults believe they have the required skills and knowledge to start a business, which is higher than the OECD median value (43.8%) and all benchmarked BRICS and ASEAN economies, except for the Philippines (69%). Entrepreneurial intentions (i.e. people who intend to start a business within three years but have not yet taken any steps in this respect) are also robust in Indonesia, at 28%, which is nearly three times as high as the OECD median value (11%) and only second to the Philippines (37%) and Thailand (37%) among the benchmarked ASEAN economies (Figure 2.13).
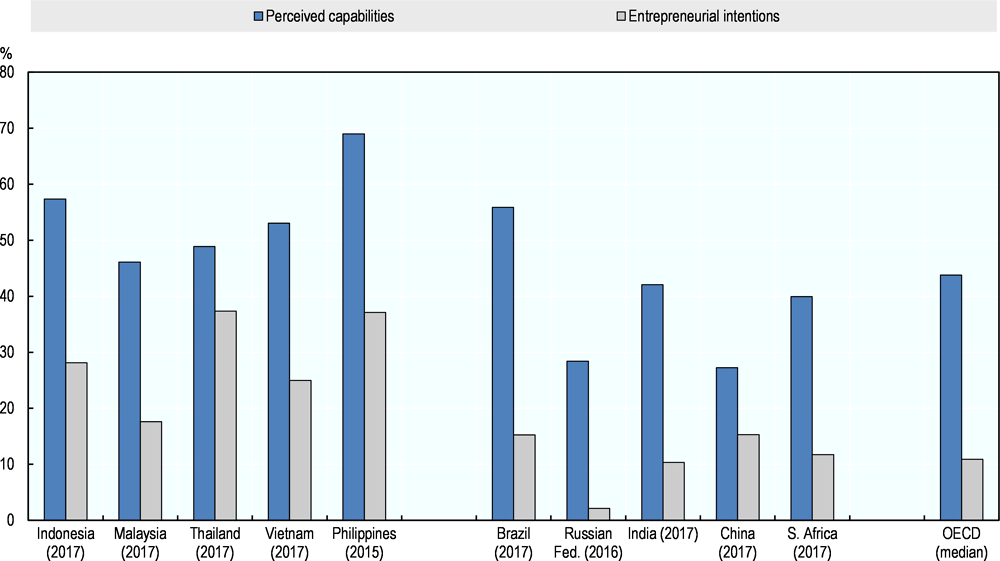
Note: Perceived capabilities: Percentage of total adult population (aged 18-64) who believe they have the required skills and knowledge to start a business. Entrepreneurial intention: Percentage of total adult population (aged 18-64) who intend to start a business within three years, excluding individuals already involved in any stage of entrepreneurial activity (i.e. those counted in the Total Entrepreneurial Activity rate, TEA rate)
Source: OECD based on Global Entrepreneurship Monitor (GEM) database.
Despite strong perceived market opportunities, perceived entrepreneurial skills and entrepreneurial intentions, Indonesia’s Total Entrepreneurial Activity (TEA) rate (i.e. the proportion of adults who are either a nascent entrepreneur or owner-manager of a new business which is less than 42 months old) is low by international comparison (7.5%), less than the OECD median figure (8.4%) and all other benchmarked ASEAN and BRICS economies (except for the Russian Federation) (Figure 2.14). There is, therefore, a significant gap between entrepreneurial attitudes and entrepreneurial activity in Indonesia, which is partly explained by some risk aversion (i.e. fear of failure) in the population but also by the wage job opportunities generated by sustained economic growth (e.g. Indonesia’s employment rate rose by 4 percentage points between 2005 and 2017).
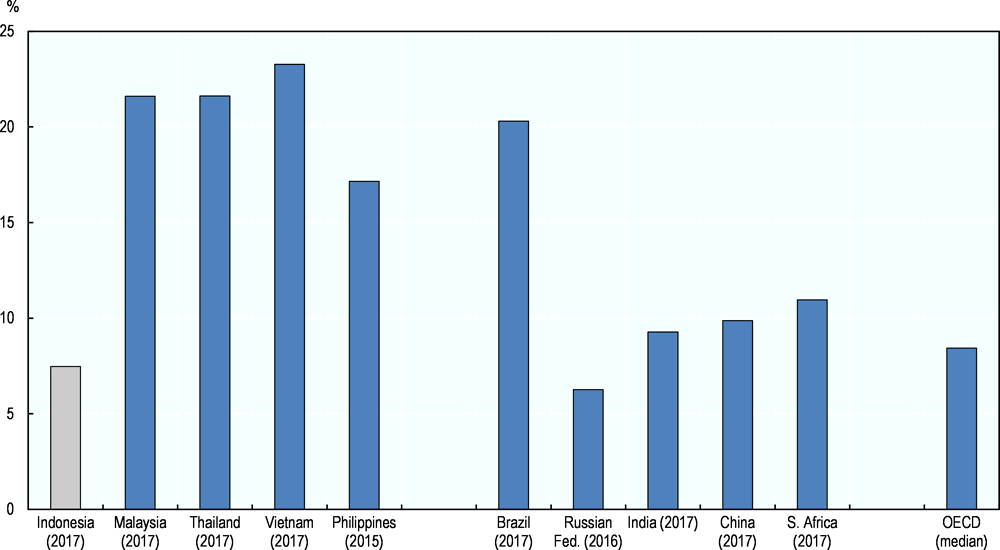
Note: The TEA rate provides estimates of the proportion of the adult population (aged 18-64) who have either been involved in a start-up for less than three months (i.e. nascent entrepreneurs), or who have been business owners for less than three-and-a-half years (i.e. new business owners).
Source: OECD based on GEM database.
Business ownership
Based on GEM data, “established business ownership” (i.e. the proportion of adults who own and manage an existing enterprise) is relatively common in Indonesia at 10.4%, higher than the OECD median value (6.7%) and most benchmarked ASEAN and BRICS economies. By the same token, business density (i.e. the number of enterprises per 1 000 economically active people), an indicator which shows the spread of business ownership in the labour force, is particularly high in Indonesia, i.e. 174 companies for every 1 000 economically active people, compared with the OECD median value of 106 (Figure 2.15). Indonesia’s Central Bureau of Statistics also calculates its own “entrepreneurship ratio” as the number of employer business owners over the total population: the ratio was 1.7% in 2017, up from 1.64% in 2014. Altogether, existing data indicate that business ownership is widespread in Indonesia and a contributing factor to the average small size of Indonesian SMEs.
There are 14.3 million self-employed women in Indonesia, corresponding to 37% of total self-employed people. About 94% of self-employed women are own-account workers, while only 6% are employers, compared with 12% of the male self-employed (BPS, 2016). Although the number of women entrepreneurs has been steadily rising, women-owned businesses are on average smaller than male-owned businesses and concentrated in sectors such as trade and services (World Bank, 2016).
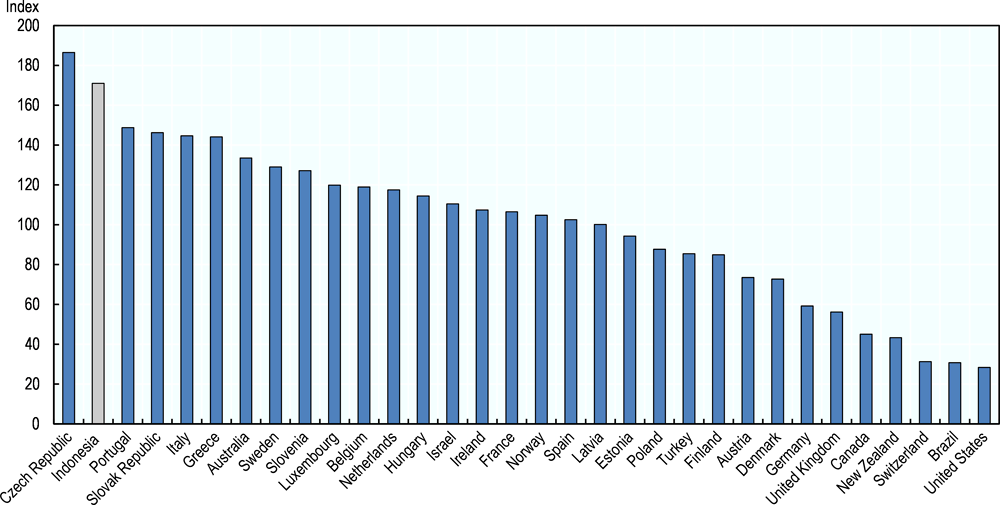
Note: Business density for OECD countries is measured based on information from the OECD Structural and Demography Business Statistics (SDBS) Database and the OECD Labour Force Database. For Indonesia business density is calculated based on data supplied by the Indonesian Ministry of Co-operatives and SMEs and the World Bank World Development Indicators (WDI). Data from the Ministry of Co-operatives and SMEs are net of firms from the agricultural sector (the percentage average, 50.5%, over the period 2006-2010 for which data are available from the Ministry) and from companies in finance and insurance to enable better comparison with OECD data. Comparative statistics on business densities should be taken with caution due to differences in the definition of what constitutes the creation of a new business across countries, resulting in a relatively wide range of values.
Source: OECD based on information from OECD SDBS database, OECD Labour Force database, World Bank World Development Indicators and Indonesian Ministry of Co-operatives and SMEs.
A call for more and better data
The main aim of this chapter has been to highlight the key characteristics of the Indonesian SME sector. However, the chapter has also indirectly shown that data collection on SMEs could be improved in Indonesia in order to build a stronger evidence base for national policies.
At present, the Ministry of Co-operatives and SMEs and the Central Bureau of Statistics use different definitions of SMEs, the first of which is based on assets and/or turnover and the second on number of employees. Moreover, the current configuration of size classes is such that it does not allow for an in-depth comparative analysis of Indonesian SMEs with other regional groups, including ASEAN, or with OECD member countries. As seen earlier, a comparative analysis between Indonesian SMEs and SMEs in OECD countries has only been possible for the group of companies employing less than 20 people and, in some cases, only for the manufacturing sector. Collecting more granular information on SMEs across a larger number of employment size bands, and ensuring that these new size bands allow comparison with commonly used firm size bands at international level (e.g. 1-9; 10-19; 20-49; 50-99; 100-249; 250-499; and 500+ employees) would help enrich the analysis on the Indonesian business structure and provide stronger evidence for the decisions of policy makers.
In this respect, the collaboration between the Ministry of Co-operatives and SMEs and the Central Bureau of Statistics, which had allowed some regular SME data collection until 2015, should be renewed and revamped, collecting information not only based on the SME definition of Law 20/2008, but also on the aforementioned employment size classes. Key areas of analysis covered in the partnership could include business distribution by firm size as well as distribution of employment, investment and export by firm size. In addition, ad-hoc surveys could be developed to measure innovation activity in SMEs – similar to the Community Innovation Survey taking place in EU countries every three years – and to estimate size and trends of the informal sector.
Conclusions and policy recommendations
Indonesian structural business statistics reveal that the average domestic enterprise is small by international standards, but also that there has recently been a consolidation process by which larger SMEs have come to account for a larger share of national employment and investment. The large informal sector contributes to the average small size of Indonesian SMEs; estimates point out that it accounts for about 70% of national employment and more than 90% of total business enterprises.
Labour productivity gains have been modest across all business size classes, suggesting that economic growth in Indonesia has thus far been mostly propelled by other factors (e.g. increased labour utilisation and consumer spending) and making the case for productivity growth to become a more important objective of future SME policies. This shift will be especially important as the country approaches a stage of development where gains in efficiency, e.g. through increased industrialisation, will matter more than before.
Productivity-enhancing policies will span from encouraging the further scale-up of existing SMEs through targeted measures (e.g. aimed at upgrading workforce and managerial skills), through nurturing a business environment which favours experimentation and business entry-exit dynamics (e.g. via business-friendly product and labour market regulations), to designing national and local policies (e.g. cluster policies) which encourage economies of agglomeration and economies of specialisation. Enhancing SME productivity will not only encourage growth but will also reduce income disparities by improving the quality of jobs in SMEs. Less burdensome product and labour market regulations will also help reduce the size of the informal sector.
Business ownership is widespread in Indonesia and is a contributing factor to the small average size of Indonesian SMEs. However, nascent entrepreneurial activity, as measured by the Total Entrepreneurial Activity (TEA) rate, is not very high, which is also probably linked to growing job opportunities in the labour market.
Finally, there is a need to collect more and better (i.e. more granular and more internationally comparable) data on SMEs in Indonesia, including through stronger collaboration between the Central Bureau of Statistics and relevant ministries. This would allow the government to achieve a better understanding of recent trends in business dynamics and SME performance and would ultimately support better informed public policies.
Based on the analysis in this chapter, the following recommendations are put forward to improve SME and entrepreneurship performance in Indonesia.
-
Design a wide range of productivity-enhancing policies which encompass targeted approaches aimed at upgrading workforce skills, managerial skills and business innovation in SMEs, as well as business-friendly product and labour market regulations such as further ease of business licensing procedures and less strict but better-enforced labour market regulations.
-
Encourage further consolidation in the SME sector through the development of co-operatives and business consortia, and through a network approach to SME policy in which programmes are delivered to groups of companies rather than to individual companies.
-
Consider the launch of a campaign to strengthen entrepreneurial attitudes in the Indonesian adult and youth population. This could include initiatives to raise awareness about social and growth-oriented entrepreneurship and to improve the quality of entrepreneurship training, entrepreneurship education and business incubation (see also chapter 5).
-
Improve data collection on SMEs by adopting and using more frequently an employment-based definition to allow better international comparison between Indonesia and OECD countries with respect to the structure and performance of the SME sector.
-
Renew the partnership between the Ministry of Co-operatives and SMEs and the Central Bureau of Statistics which had allowed annual SME data collection until 2015.
References
Alatas V. and D. Newhouse (2010), Indonesia Jobs Report: Toward Better Jobs and Security for All, World Bank, Washington, DC.
Asian Productivity Organization (APO) (2017), APO Productivity Databook 2017, Tokyo. http://www.apo-tokyo.org/publications/wp-content/uploads/sites/5/APO-Productivity-Databook_2017.pdf
Badan Pusat Statistik (Central Bureau of Statistics) (2016), Labor Force Situation in Indonesia, August 2016, Jakarta. https://www.bps.go.id/website/pdf_publikasi/Keadaan-Angkatan-Kerja-di-Indonesia-Agustus-2016--.pdf
Haskel J. and S. Westlake (2017), Capitalism without Capital: The Rise of the Intangible Economy, Princeton University Press, Princeton, NJ.
OECD (forthcoming), OECD Economic Surveys: Indonesia 2018, OECD Publishing, Paris.
OECD (2017), Entrepreneurship at a Glance 2017, OECD Publishing, Paris, https://doi.org/10.1787/entrepreneur_aag-2017-en
OECD (2016), OECD Economic Surveys: Indonesia 2016, OECD Publishing, Paris, https://doi.org/10.1787/eco_surveys-idn-2016-en.
Rothenberg A., A. Gaduh, N. Burger, C. Chazali, I. Tjandraningsihc, R. Radikun, C. Sutera and S. Weilant (2016), “Rethinking Indonesia’s Informal Sector”, World Development, Vol. 80, 96-113. https://doi.org/10.1016/j.worlddev.2015.11.005
World Bank (2016), Women Entrepreneurs in Indonesia: A Pathway to Increasing Shared Prosperity, World Bank Indonesia Office, Jakarta.
Notes
← 1. The large number of companies (59.3 million) in a population of 261 million is primarily due to the inclusion of agriculture, which accounts for about 50% of the total number of companies estimated by the Ministry of Co-operatives and SMEs.
← 2. Comparable information for Indonesia and the OECD is achieved through the use of data from the 2016 Economic Census of Indonesia and the OECD SDBS database. As noted earlier, the 2016 Indonesian Economic Census follows an employment-based classification of SMEs by which: micro-enterprises, 1-4 people employed; small enterprises, 5-19 people employed; medium-sized enterprises, 20-99 people employed; and large enterprises, 100+ people employed. The OECD SDBS database also collects information on firm size by employment, based on the following classes: 1-9 people employed; 10-19 people employed; 20-49 people employed; 50-249 people employed; and 250+ people employed. A common and comparable (small) firm size class of 1-19 people employed can, therefore, be used for both Indonesia and OECD countries.
← 3. Due to the inclusion of agriculture, the SME definition used by the Ministry of Co-operatives and SMEs leads to an overestimation of the size of the SME sector compared with the definition of BPS. For example, micro and small enterprises are 99.9% of the total in the first case and 98.3% of the total in the second case. This can be better observed in employment terms. In the first case, micro and small enterprises account for 92.7% of total employment in the business economy, in the second case the proportion is 76.3%.
← 4. The Asian Productivity Organization (APO) measures, in this case, labour productivity as “per-worker GDP”, using GDP at constant basic prices per worker, based on 2011 USD purchasing power parities.
← 5. The relatively large difference in labour productivity estimates for Indonesia in the case of APO calculations (USD 24 300) and calculations in this report (USD 38 000) can be attributed to different measurement methods. APO’s labour productivity estimate is based on “GDP per worker for the whole economy”, where the measurement of GDP only includes the value of final goods produced by a country within a certain period of time, thus excluding intermediate inputs to avoid double counting. The labour productivity estimate in this report is based on “turnover per worker in manufacturing”, with the measurement of turnover which does not exclude intermediate inputs and with manufacturing which has productivity levels above the rest-of-the economy average.
← 6. Average export performance by firm size can be affected by changes in the value of exports as much as by changes in the number of firms within the firm size band, which will also depend on business dynamics, including movements of companies which scale up and move to the next firm size band or which scale down and move to the previous firm size band.
← 7. Average investment by firm size follows the same logic of average export by firm size, this indicator also being affected by business dynamics within the SME sector, i.e. companies which grow and move up to the next firm size band and companies which shrink and move down to the previous firm size band.