Chapter 3. Public-private partnerships at the subnational level of government: The case of PFI in the United Kingdom
This chapter presents a case study of public-private partnerships (PPPs) for infrastructure development in the United Kingdom (the UK). While PFI is now an historic mechanism, the UK’s history with PFI and the limited attention to the regional and local government experience with PFI in existing literature make the experience at the subnational level particularly worthy of review. The case study explores four areas which can present challenges when implementing subnational public-private partnerships: 1) legal and regulatory arrangements; 2) financing and funding, 3) economies of scale, and 4) local administrative capacity. The case study concludes with a summary of lessons emerging from the UK’s (and particularly England’s) history with PFI at the subnational level.
Introduction
This chapter presents a case study of public-private partnerships (PPPs) for infrastructure development in the United Kingdom (the UK). More specifically, it examines subnational experience with a specific type of PPP – Private Finance Initiative (PFI) contracts with a focus on local authorities in England. Between 1997 and 2012, PFI was a key mechanism used to meet social infrastructure needs, particularly at the subnational level. In 2012, PFI was revised and replaced by PF2. While PFI is now an historic mechanism, the UK’s history with PFI and the limited attention to the regional and local government experience with PFI in existing literature make the experience at the subnational level particularly worthy of review. The case study will address three main questions: 1) what trends can be observed with respect to PFI at the subnational levels of government over time? 2) how did multi-level governance arrangements play out with respect to local authority PFIs between 1997 and 2012 in England? and 3) what does the UK experience suggest in terms of governance of PPPs at the subnational level?
The case study is organised as follows. It begins with an historical overview of PFI in the UK, with a focus on England and the use of PFI at the local level. This is followed by a look at the multi-level governance context of subnational PFIs in the UK. In addition to a brief discussion of actors at different levels of government, it explores four areas which can present challenges when implementing subnational public-private partnerships: 1) legal and regulatory arrangements; 2) financing and funding, 3) economies of scale, and 4) local administrative capacity. The penultimate section provides a deeper examination of these issues by examining England’s “Waste Infrastructure Delivery Programme” which emphasizes local PFI projects to help achieve EU landfill targets. The case study concludes with a summary of lessons emerging from the UK’s (and particularly England’s) history with PFI at the subnational level.
Background
Infrastructure needs and the emergence of PFI
At the outset of the 1980s, the UK’s public sector owned the country’s utilities and transportation, and owned and operated most social infrastructure such as schools and hospitals (Winch, 2012). This began to change in the 1980s as the country shifted toward increased private participation in infrastructure finance, ownership, and operation (Winch, 2012). Privatisation and concessions launched in the mid-1980s were followed by private finance in the 1990s (Winch, 2012).
The shift toward privatisation followed on the heels of substantial declines in public investment. Public investment as a percentage of GDP declined throughout the 1970s, and reached a first low point by the end of the 1980s before reaching an historical low at the end of the 1990s. Looking at gross capital formation as the measure of public investment, Clark et al. (2002) find a drop from 8.9% of GDP in 1975 to 1.7% in 2000. They attribute much of the dramatic decline in the 1970s to a substantial drop-off in local government investment, which fell from 3.8% of GDP in 1975 to 0.8% in 1982. Reduction in investment in council housing was the primary contributor in this regard. A second major contributor to the decline in public investment was effect of privatisation. Public corporations’ contributions to GDP dropped from 2.8% of GDP in 1983 to 1.2% of GDP in 1988 to less than 0.5% in 2000 (Clark et al., 2002). According to the authors, there were also substantial declines in public investment in education. Finally, the 1990s saw declines in central government investment in general, which dropped from 1.4% of GDP in 1991 to 0.4% in 1999 (Clark et al., 2002). Clark et al. (2002: 307) argue that privatisation and declines in public investment were motivated by “a desire to contain the ‘headline’ measure of the public deficit — the public sector borrowing requirement (PSBR)” and to keep tax rates low in the face of rising non-discretionary expenditures such as social security. The historical trends can be observed in Figure 3.1., which tracks public sector net investment (slightly different from but based on gross fixed capital formation).
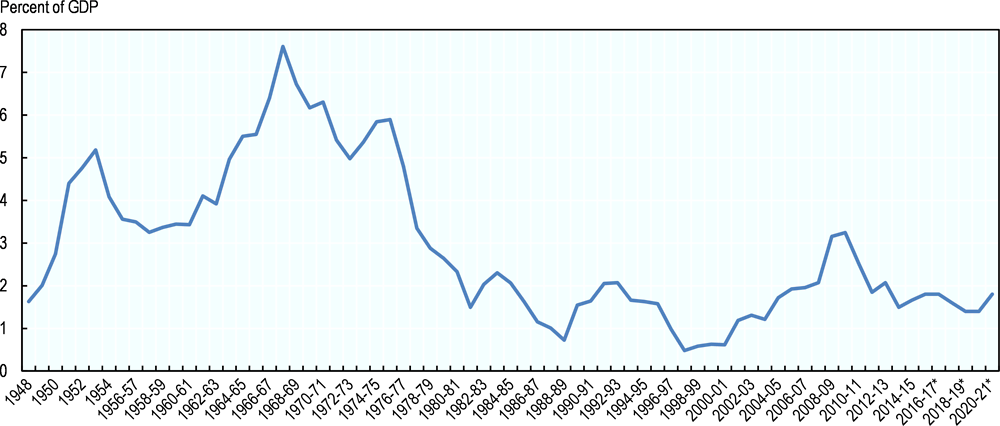
Note: Public Sector Net Investment is gross spending on investment less depreciation. Years with an asterisk are estimates.
Source: UK Office of Budget Responsibility (2015), PSF Aggregates Databank, Excel, November 2015.
By 1989, public investment was decidedly low in historical terms. Where the public sector did invest, it had a weak track record of delivering infrastructure projects on-time and on-budget, and tended to under invest in operations and maintenance (LexisPSL and Addleshaw Goddard, n.d.-a). To address some of these challenges, in 1992, the UK government formally launched the now well-known “Private Finance Initiative (PFI)”, a special type of PPP, to help tackle infrastructure needs (Winch, 2012) (Box 3.1). Launched first with large central government projects (e.g. Channel Tunnel Rail Link and the Jubilee Line Extension), it was not until 1996/1997 that PFI was extended to subnational governments (Wilson and Game, 2011). The “Public Private Partnership Programme” (4ps, now called Local Partnerships) was established in 1996 to help extend PFI to local governments (Winch, 2012). Clark et al. (2002: 310) note that PFI was introduced at a time of “large and growing fiscal deficits” and thus at least partially justified by its positive impact on the public deficit (PBSR). From 1994 onward, HM Treasury approval for publicly funded capital investment was usually predicated on previous consideration of private finance options (House of Lords, 2010).
The UK’s “Private Finance Initiative” was launched in 1992. While discussed in the context of public-private partnerships (PPPs/P3), PFI and PPP are not synonymous. PPP refers to a “family of procurement methods” (LexisPSL and Addleshaw Goddard, n.d.-a). By contrast, PFI is a specific type of PPP contract which bundles construction, operations, and maintenance into a single contract. The project is privately financed up-front via private sector equity and debt (usually debt), and paid for over the long-term with public funds. PFI traditionally involves establishing a Special Purpose Vehicle (SPV) to raise capital and undertake the project. The SPV is later repaid via fixed government payments (i.e. unitary charges) over the life of the project beginning in the operational phase. By contrast, a PPP need not involve such financing arrangements. PFI was replaced in December 2012 by similar but updated approach, Private Finance 2 (PF2) which will apply to England. New elements of PF2 include:
-
Centralised procurement units for certain sectors;
-
A maximum window of 18 months for the competitive tendering phase;
-
Requirements that government act as a minority equity investor;
-
Competitions for some portion of the private sector equity;
-
A shift in risk allocation towards the public sector;
-
Even greater standardisation of contract documents;
-
The removal of soft facilities management from contracts; and
-
Annual publication of project information, including off-balance sheet PF2 contract liabilities.
Despite the emergence of PF2, as PFI projects generally have a life span of approximately 25 years, numerous PFI projects are ongoing.
While PFI has tended to dominate public-private partnerships in the United Kingdom, it exists alongside other forms of PPPs.
Sources: LexisPSL and Addleshaw Goddard (n.d.-a), “Forms of Public Private Partnerships”, LexisPSL Practice Note; LexisPSL and Addleshaw Goddard (n.d.-b), “Introduction to the Private Finance Initiative and Public Private Partnerships”, LexisPSL Practice Note; LexisPSL and Laver, N. (2013), “PF2--the story so far”, LexisPSL News Analysis; LexisPSL and Laver, N. (2012), “PF2--a new look for PFI?”, LexisPSL News Analysis; HM Treasury (2012), “A new approach to public private partnerships”, London, UK; EPEC (2012), “United Kingdom - England: PPP Units and Related Institutional Framework”, European PPP Expertise Centre; House of Lords (2010), “Private Finance Projects and off-balance sheet debt, Volume I: Report”, House of Lords Select Committee on Economic Affairs, 17 March 2010.
Transitioning to private finance of public infrastructure was not without hiccups. Early PFI deals were delayed by legal problems, costly and time-consuming bidding procedures, and weak public sector skills for this new, complex approach to procurement (Winch, 2012). Following the comprehensive government (“Bates”) review in 1997, the government overhauled bidding procedures, clarified legal issues, and introduced a Treasury Taskforce to promote the PPP approach (Winch, 2012). A second review in 1999 led to the creation of Partnerships UK, a national “PPP unit” set up to promote PPPs and to provide technical support to HM Treasury and contracting authorities (Winch, 2012; OECD, 2015). As subsequent sections show, the PFI approach took off over the following decade.
While PFI achieved positive performance in some areas, there has also been criticism. Government reviews have suggested that PFI projects tend to outperform traditional procurement in terms of cost and schedule overruns (Winch, 2012). There is also an indication that maintenance is better managed under PFI than traditional procurement (House of Lords, 2010). Overall, PFI has likely facilitated infrastructure development that would not have been possible without private finance (Winch, 2012). However, emerging lessons attenuated some of the enthusiasm for PFI. Criticisms included inappropriate risk allocation, a lack of sufficient flexibility/difficulty to change contract terms, a lack of transparency regarding future liabilities, perceived excessive private sector profits, and lengthy and costly procurement (HM Treasury, 2012). In 2010, these criticisms, along with the effects of the 2008 financial crisis, prompted the incoming government to cancel significant PFI programmes underway and to undertake a review of PFI (LexisPSL and Addleshaw Goddard, n.d.-a). The result was the launch PF2 in 2012, a rebranded version of PFI with changes intended to improve value for money, increase procurement efficiency, introduce greater flexibility during the operational phase, and improve transparency and public confidence (LexisPSL and Addleshaw Goddard, n.d.-a; LexisPSL and Laver, 2013).
The evolution of PFI over time
How did PFI evolve over time and in different regions of the United Kingdom? Using an approach similar to Navarro-Espigares and Martín-Segura (2011), this section provides an overview of PFI at different levels of government, in different regions, and for different sectors.1 Data come from HM Treasury’s publicly available Excel spreadsheet containing current projects as of 31 March 2014 (HM Treasury, 2014a). Each project in the dataset is assigned to a level of government (i.e. central government, devolved authority (N. Ireland, Scotland, and Wales), local authority, or NHS) based on the procuring authority listed in the dataset.2 Financial year is determined based on the date of financial close for each PFI project. Assignment of projects to regions and sectors is provided in the dataset.3
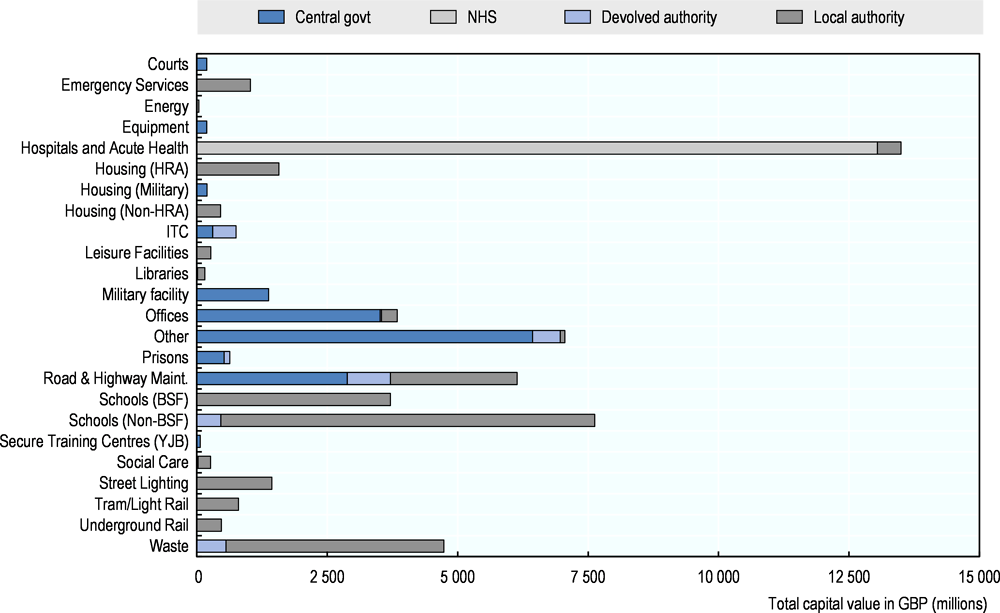
Data show that the volume of PFI projects grew over the course of the 1990s, reaching its highest levels between 1999 and 2007 (Figure 3.2.). While the earliest PFI projects were procured by the central government, by the 2000s, all levels of government were involved in PFI procurement, with local authorities’ procurement representing a substantial portion of total capital value. As of March 2014, 728 PFI contracts were in operation or under construction with a total capital value of GBP 56.6 billion; an additional 11 projects were in procurement with an expected capital value of GBP 816.1 million (HM Treasury, 2014b). The value of deals peaked in 2007/08, with a value of GBP 8.4 billion signed in that year, but dropped off in the face of the financial crisis.
The financial crisis had a notable effect on the PFI programme. After 2008, the availability of finance for PFI projects narrowed, debt margins rose, and total private finance costs were only partially offset by declining interest rates (NAO, 2010). These rising costs raised questions about the value for money of PFI compared to traditional procurement (NAO, 2010).4 Although some projects went forward, the number of new deals dropped dramatically (Figure 3.2.). According to Winch (2012: 118), “in July 2010, the new administration cancelled all ‘Building Schools for the Future’ projects that had not already reached financial close, on value for money grounds. Similarly, 7 of the 18 municipal waste PFI projects that had not yet reached financial close were cancelled in October 2010”. In 2013/14, nine new projects were agreed to with a capital value of GBP 1.4 billion (Booth and Starodubtseva, 2015).
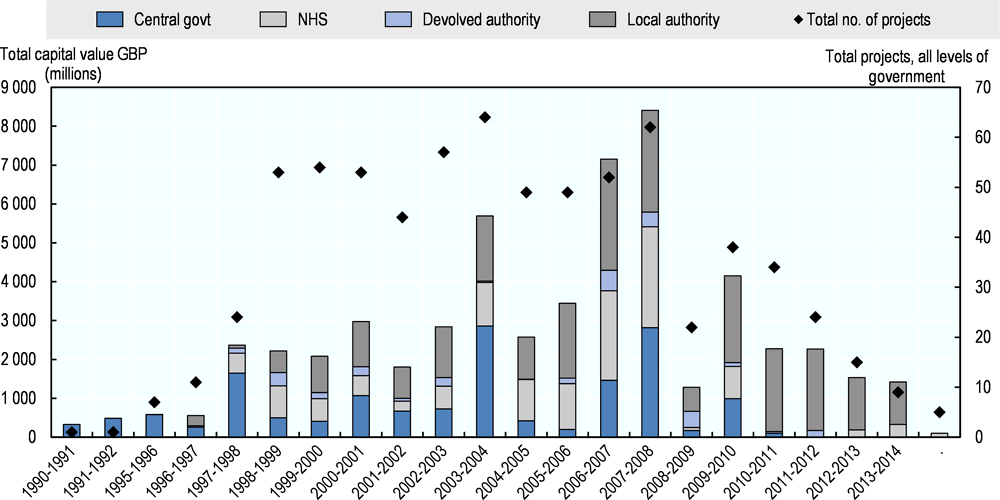
Note: Assignment to level of government is based on the “procuring authority” listed in the dataset. Current projects exclude expired or terminated projects and projects in procurement.
Source: Author’s calculation based on HM Treasury (2014), “Current projects as at 31 March 2014”, Excel.
The most valuable projects tend to be awarded by the central government. For current projects as of March 2014, both the maximum and the average value of central government projects tended to be much higher than other levels of government (Table 3.1). However, as Table 3.2 reveals, in terms of volume, most projects are procured by lower levels of government (60% of total projects are procured by local authorities; 7% by devolved authorities). Thus, while central government projects often have the highest capital value, devolved and local authorities represent nearly half of the total capital value procured as of March 2014. However, as will be shown later, although subnational governments procure a great deal of capital value, they are not solely responsible for paying for it. It is also worth noting that despite the increase in the number of deals in the 2000s, PFI/PPP projects accounted for approximately 10–15% of English local authority capital investment during the latter half of the decade (House of Lords, 2010).
As in Espigares and Martín-Segura (2011), the data reveal regional variation in PFI procurement across the UK (Figure 3.3.). London stands out as the region with the greatest number of projects and the highest accumulated capital value. However, once population is taken into account, the total capital value per inhabitant in London – while higher than other English regions – is no longer the highest in the UK. Northern Ireland and Scotland both stand out with higher per capita values. In Northern Ireland, the total value of projects is relatively low and procured largely by the devolved government. There are no PFI projects for which a local council is the procuring authority. In Scotland, the total value is the 4th highest of 12 regions, with procurement undertaken by all levels of government. Scottish local authorities represent a significant share of total projects and total value. Wales trails all other regions with low PFI penetration.
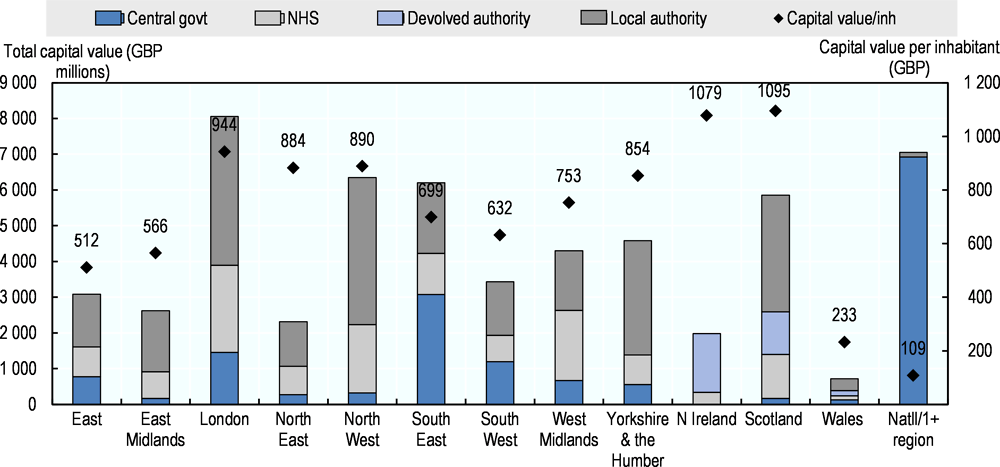
Note: Assignment to level of government is based on the procuring authority. The data already assign projects to regions. Current projects exclude expired or terminated projects and projects in procurement.
Source: Author’s calculation based on HM Treasury (2014), “Current projects as at 31 March 2014”, Excel; ONS (2015), “MYE2: Population Estimates by single year of age and sex for local authorities in the United Kingdom, mid-2014”, Excel, version 25 June 2015.
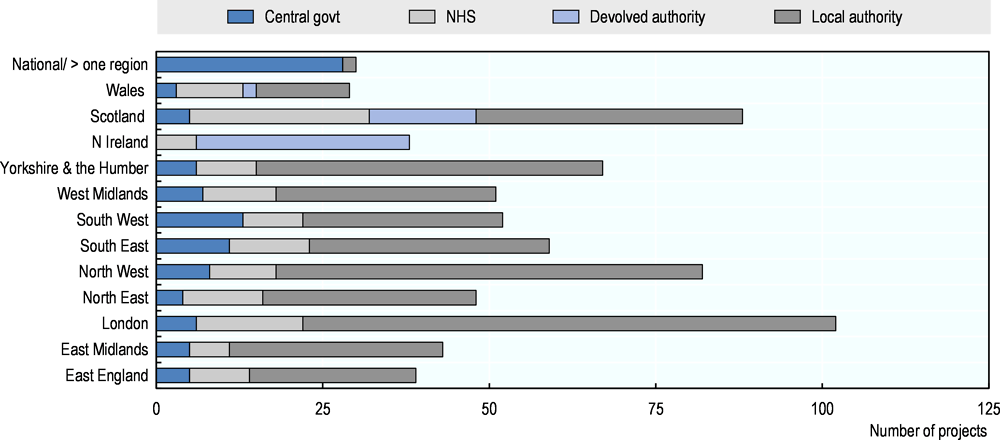
Note: Assignment to level of government is based on the procuring authority. The data already assign projects to regions. Current projects exclude expired or terminated projects and projects in procurement.
Source: Author’s calculation based on HM Treasury (2014), “Current projects as at 31 March 2014”, Excel.
Note: Assignment to level of government is based on the procuring authority. Current projectsexclude expired or terminated projects and projects in procurement.
Source: Author’s calculation based on HM Treasury (2014), “Current projects as at 31 March 2014”, Excel.
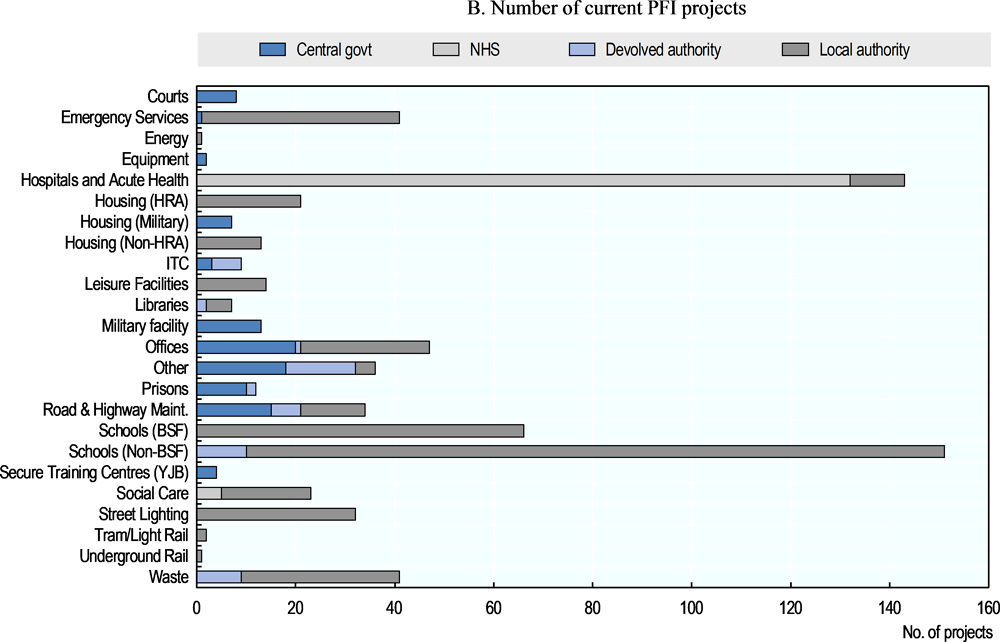
PFI has traditionally been associated with social infrastructure such as health, education, and housing – although the model has been used for other infrastructure such as transportation. Examining PFIs by sector underscores the priority for social infrastructure. Since the early 1990s, the greatest total capital value has been generated in health and hospitals through projects procured largely through the National Health Service. Between 1990 and March 2014, a total of 143 health PFI projects were procured worth a total capital value of GBP 13.5 billion. Of these, 132 are attributed to NHS entities and the remainder to local governments. Although the greatest value was generated via health projects, education projects were, in fact, most numerous and rank second in terms of capital value. 217 PFI projects in education were procured both via the “Building Schools for the Future” (BSF) programme and otherwise. Their total capital value was GBP 11.3 billion for both categories combined. All school projects were subnational ones, with the overwhelming majority procured by local authorities. By contrast, transport projects – which also generated substantial value – were split between the central and local levels. Road and highway projects are shared between levels of government, while tram/light rail/underground rail were pursued as local projects. PFI has also been tapped for office space, street lighting, waste management, prisons, and emergency service projects.
Following the 2008 financial crisis, the central government’s infrastructure focus shifted away from social infrastructure towards economic infrastructure (LexisPSL and Addleshaw Goddard, n.d.-b; NAO, 2011). This shift intended to reinforce global competitiveness and to create jobs (LexisPSL and Addleshaw Goddard, n.d.-b). Since 2010, these priorities have been articulated in the Government’s National Infrastructure Plan (NIP), a long-term strategy for addressing infrastructure in key sectors through 2020 and beyond. The 2014 NIP contained information on planned public and private sector investment in infrastructure valued at over GBP 460 billion (approx. 25% of GDP) through 2020 and beyond (LexisPSL, n.d.; Pisu et al., 2015). Approximately two-thirds of the financing for the 550 projects and programmes in the NIP was expected to come from private sources, 21% from the public sector, and 14% from mixed (public-private) sources (Pisu et al., 2015). Thus, there is interest in attracting private capital, but the priority given to PFI/PF2 as a mechanism for delivering infrastructure appears diminished although it remains in use. The Priority Schools Building Programme to refurbish 260 schools, for example, uses PF2 (EFA, 2015; HM Treasury, 2014c).
Multi-level governance context
Subnational public private partnerships in the UK occur in a context of multi-level governance. The UK, as a highly centralised unitary country, exerts a great deal of influence over subnational governments, particularly in England. However, as responsibility for capital expenditures is devolved, there is some variation in approach across the UK. This section examines the various laws, regulations, policies, and actors associated with PPPs that exist at multiple levels of government, and the complexities and co-ordination challenges that emerge from such arrangements.
Actors
Numerous actors at different levels of government play a role in the implementation of public private partnerships for infrastructure delivery in the UK. In terms of contracting authorities for PFI/PF2, central government departments, devolved administrations (i.e. Scotland, Northern Ireland, and Wales), arms-length entities (e.g. NHS Trusts), and local authorities are all able to enter into PFI/PF2 contracts. It is important to clarify that the term “local authority” includes a variety of local bodies. In total there are 353 “principal local authorities” in England with statutory responsibility for public services (NAO, 2015a). These include “single-tier” bodies and “two tier” bodies (where responsibilities are shared between a county council and a district council). Strategic or combined authorities have also been created to carry out certain functions (e.g. the Greater London Authority) (NAO, 2015b). In Scotland, Wales, and Northern Ireland, all local authorities are “single-tier”. There are 32 local authorities in Scotland, 22 in Wales, and 11 (previously 26) in Northern Ireland (Scottish Government, 2015; Welsh Government, 2015a; Northern Ireland Executive, 2015). Local competences are not the same everywhere. Local authorities’ competences in Northern Ireland are more limited than elsewhere (CEMR, 2012; Northern Ireland Executive, 2015).
Regulatory and supporting authorities also exist at all levels of government. At the central government level, key actors are associated with HM Treasury. Various actors have been created within HM Treasury over the years to address infrastructure priorities and in some cases PPPs in particular.5 Until recently, the primary central government actor was Infrastructure UK (IUK), established in 2009 to focus on England’s long-term infrastructure priorities with a goal of facilitating private sector investment including PPPs (EPEC, 2012a). In 2010, it incorporated Partnerships UK (PUK), a PPP unit which was itself a PPP between HM Treasury and the private sector that operated for a number of years to promote and support PPP deals (discussed under administrative capacity) (EPEC, 2012a). In January 2016, IUK was replaced by the Infrastructure and Projects Authority, a merger of IUK with the Major Projects Authority, which oversaw the largest government projects (Cabinet Office, 2015). Also important at the central level are the line ministries (departments), which play a role in local PFI projects in England. This is true for the Department for Communities and Local Government, for example, with respect to housing (OECD, 2015). The role of the Department for Environment, Food and Rural Affairs (Defra) in local waste PFI projects is discussed later.
With limited exception, responsibility for infrastructure and public private partnerships is devolved to Scotland, Wales and Northern Ireland (LexisPSL and Addleshaw Goddard, n.d.-c). In Scotland, infrastructure projects are administered by the Infrastructure Investment Unit, which is part of the Finance Directorate (EPEC, 2012c). Its responsibilities include sponsorship of the Scottish Futures Trust (SFT) established in 2008 to seek best value in infrastructure investment (including but not limited to PPPs) across the region (EPEC, 2012c). SFT provides assistance to the Scottish government, health boards, and local authorities to structure and implement PPPs. In Wales, the Infrastructure Investment Plan is the Welsh Assembly's primary vehicle to prioritise and deliver capital investment (Welsh Government, 2015b; LexisPSL and Addleshaw Goddard, n.d.-c). In Northern Ireland, infrastructure planning and delivery are the responsibility of the Strategic Investment Board, an advisory company owned by and accountable to the Office of the First Minister and deputy First Minister (OFMDFM) (EPEC, 2012b). Other key players include the Central Finance Unit in the Department of Finance and Personnel, the Economic Policy Unit, and the Public Private Investment Unit in the OFMDFM (EPEC, 2012b).
Finally, at the local level, (as noted previously) local authorities have responsibility for procuring and managing PPP and PFI projects. In Northern Ireland, local authorities have played little role to date in PFI projects (EPEC, 2012b). In England, local authorities’ capacity to design and deliver projects (and renegotiate contracts) is supported by Local Partnerships, a joint venture between the Local Government Association and HM Treasury. Some local authorities, such as Leeds, have also developed their own “PPP unit”, to reinforce capacity for PFI projects (Partnerships Bulletin, 2007; EPEC, 2012a). It is worth noting that although local authorities frequently act as the procuring authority for PFI contracts, the projects involved are often part of central government programmes (NAO, 2009a). As such, they contribute toward national goals, are often (partially) financed via central government funds (NAO, 2011), and regulated by central government guidance.
Legal and regulatory arrangements
Regulatory coherence across levels of government with respect to PPPs poses relatively few issues in England. There is no specific “PPP law” but “there is sufficient flexibility and certainty within the statutory and common law framework to recognise and permit PPPs” (EPEC, 2012a: 23). As a unitary country, local authorities are very much subject to centrally promulgated regulations, with some variation across regions and little variation across local authorities. HM Treasury heavily influences PFI/PF2 contract provisions for all levels of government in England and Wales, and somewhat less so for Northern Ireland and Scotland. When drafting PFI contracts, English and Welsh public authorities – including local governments – must use standardized guidance referred to as “Standardisation of PFI Contracts (SoPC)” (see discussion in the section regarding administrative capacity). Contract models for Northern Ireland and Scotland are generally consistent with or reflect the SoPC (EPEC, 2012b; 2012c).
Regulatory influence also exists at the supra-national level. Authorities at all levels of government have had to abide by EU procurement law, the main aspects of which can be found in the Public Contracts Directive (2014/24/EU), the Utilities Contracts Directive (2014/25/EU) and the Concessions Directive (2014/23/EU) (LexisPSL and Digings, n.d.).6 According to LexisPSL and Addleshaw Goddard (n.d.-c), “in addition … the principles of the Treaty on European Union (including transparency, proportionality, equal treatment and mutual recognition) must be considered when a public body awards contracts for certain works or services to a third party.” Supranational influence has also been felt when the national government relies on local authorities to achieve compliance with EU directives. This is the case, for example, with the 1999 European Union Landfill Directive (1999/31/EC) and the “Waste Infrastructure Delivery Programme” (WIDP) discussed in Section 4.
Of particular importance to the PPP landscape has been the influence of statistical treatment of PPPs. These rules, embodied in the European System of Integrated Economic Accounts (ESA), determine how infrastructure projects are classified with respect to debt and deficit figures in National Accounts. PFI contracts recorded in the National Accounts also feed into the calculation of Public Sector Net Debt (Booth and Starodubtseva, 2015) which has been associated with fiscal rules (House of Commons, 2011). Until recently, statistical treatment of PPPs was undertaken in the basis of ESA95. Depending largely on risk allocation, PPP projects are classified as either on or off the national government’s balance sheet (EPEC, 2010). Where the majority of risk is borne by the private sector, the project is “off balance sheet.” By contrast, “on balance sheet” projects count toward a national government’s public debt and annual budget deficit limits under the Excessive Deficit Procedure (EDP) under the Maastricht Treaty (60% of GDP and 3% of GDP, respectively) (EPEC, 2010). Revised rules were implemented under ESA10 in September 2014 (EPEC, 2015) with greater emphasis placed not only risk allocation but also control of the project. Although the UK is not subject to sanctions under the EDP (EC, 2015), in general the Eurostat rules produce an incentive to consider (and possibly alter) PPP structures depending on the impact on National Accounts (EPEC, 2010). These incentives likely flow to the local level.
Complicating matters is a divergence between statistical treatment of PFI/PPP projects (i.e. ESA95/ESA10) and accounting treatment of the same projects. Accounting treatment of PPPs is set at the national level (EPEC, 2010). Until 2009, public authorities employed UK GAAP (Generally Accepted Accounting Practice) rules to define whether or not PFI projects were to appear on or off their balance sheets. The UK GAAP criteria and ESA95 criteria produced similar results with respect to PFI, and thus public authorities’ financial accounts and National Accounts did not conflict (House of Lords, 2010). In 2009, however, the UK switched to the International Financial Reporting Standards (IFRS) and under this regime many PFI projects moved on-balance sheet, leading to a discrepancy between accounting treatment and statistical treatment of PPPs (House of Lords, 2010). For the UK, the solution has been the separate reporting of the statistical treatment (under ESA95/ESA10) and accounting treatment (under IFRS) of PFI projects (EPEC, 2010). According to UK NAO (2011:8), “although there is well developed Treasury guidance on assessing value for money of PFI projects, the method of calculating public sector net debt may, even though the financial accounting treatment has changed, continue to act as an incentive to use PFI as it often leaves liabilities off the national balance sheet.”
Beginning in 2011 the UK government introduced the annual publication of the Whole of Government Accounts (WGA). According to HM Treasury (2012), the WGA are full accruals based accounts covering the public sector. It consolidates the accounts of about 1500 bodies at all levels of government, including the health service and public corporations. The WGA categorizes PPPs according to IFRS (and thus largely on the balance sheet). It provides a publicly available summary of the long-term contractual commitments and contingent liabilities associated with PFI (or similar) projects (HM Treasury, 2012; OECD, 2015). According to the OECD (2015:8), “despite the WGA there can still be an accounting incentive to use PFI, but this is now minimal and stems mainly from compliance with [ESA] rules.”
Financing and funding
Before discussing financing of PFI projects, it is worth asking: Why would local authorities consider PFI at all? While the prospect of efficiency gains and better coverage of asset maintenance may well have played an important role increasing the appeal of PFI, a major driver behind its uptake at the local level is likely to have been the “desire for additionality to the public funding capability” (Winch et al., 2012: 5). Local government capital budgets had been under pressure from the central government for some time at the outset of the Private Finance Initiative (Wilson and Game, 2011). According to these authors, until 2004 the central government maintained tight control over three sources of local capital financing: local borrowing, capital receipts, and capital grants. It was not until the introduction of the prudential borrowing regime in 2004 that local authorities could realistically consider financing substantial capital expenditure themselves. Capital grants were available from the central government, but until recently they were largely earmarked (Wilson and Game, 2011). In addition, UK fiscal targets regarding its Public Sector Net Debt (PSND) as a percentage of GDP (ONS, 2006; OECD, 2009) between 1997 and 2008, as well as the EU Maastricht targets (ONS, 2006), likely discouraged public authorities at all levels from accumulating capital projects on their balance sheets.7 In short, PFI promised additionality.
The additionality of PFI comes from the fact that expenditures from capital budgets that would have to be made in the present under traditional procurement are substituted for payments from current expenditure budgets in the future. A PFI project traditionally involves establishing a Special Purpose Vehicle (SPV) to raise capital for infrastructure development in which the project is financed via private sector equity and debt. The SPV is later repaid via fixed government payments over the life of the project, beginning in the operational phase (called “unitary charges”). “Unitary charges include payments for ongoing services (e.g. maintenance, cleaning, catering and security) associated with these projects, as well as repayment of and interest on debt used to finance the capital costs” (HM Treasury, 2014b: 11). Payments are made from revenue (current) spending.
There are pros and cons associated with unitary charges. On the positive side, because the annual unitary payments are long-term contractual obligations, they are predictable and offer substantial price certainty (Corner, 2006). Moreover, contractors have an incentive to deliver projects on-time because the payments generally do not start until the asset is operational (Corner, 2006). Finally, because unitary payments are to cover whole life costs, the contractor has an incentive to seek efficiencies over the life of the contract (Corner, 2006).
There are also downsides of unitary charge payments. First, because PFI project financing relies (in large part) on debt issued at commercial rates that tend to be higher than government borrowing rates, taxpayers generally pay higher borrowing costs via PFI than they would have under traditional procurement (Corner, 2006). Second, unitary charge payments extend for many years and “constitute one of the first claims on local authority budgets” (Cuthbert and Cuthbert, 2011). As discussed later, historically local government unitary payments have been partially subsidized by the central government with the remaining portion coming from own revenues. In the UK, local authorities have very little own revenue at their disposal. As a result, local governments face limited room for manoeuvre when obliged to make set unitary charge payments while also trimming budgets. This means in times of fiscal constraint, “other parts of local authority services … have to bear the brunt of budget cuts” (Cuthbert and Cuthbert, 2011). In their examination of PFI schools projects in Scotland, Cuthbert and Cuthbert (2011), find that this situation is exacerbated where local contributions to unitary charges have been indexed at a rate that exceeds inflation and by poor affordability assessments on the part of local authorities. They hold local authorities accountable for failing to adequately implement Treasury guidance, and higher levels of government accountable for poor oversight. In England, inflation on unitary charge payments has outpaced that of revenues. Many local governments are thus confronting affordability issues on their PFI projects.
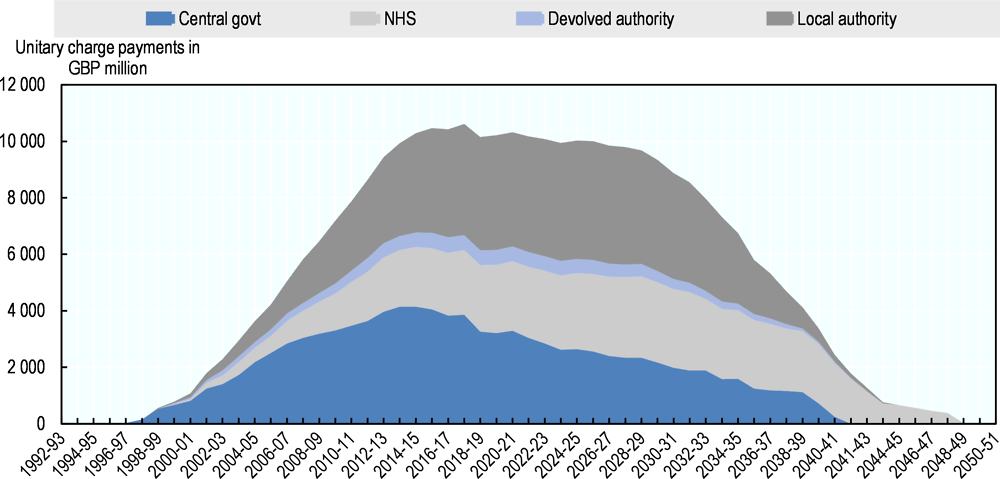
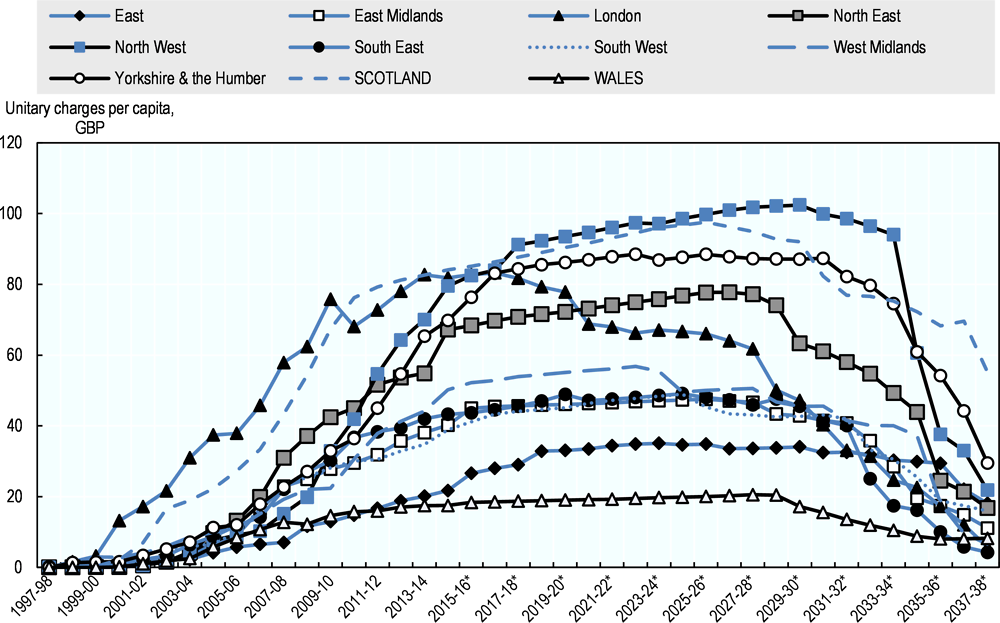
As Figure 3.6. indicates, since the launch of PFI in 1992 through 2050, unitary charge payments attributable to local government constitute a sizeable proportion of total unitary charges. Total PFI unitary charge payments for 2015-16 were expected to amount to GBP 10.5 billion, with approximately GBP 3.7 billion attributable to local authorities. On a per capita basis, local authority unitary charges appear greatest for North West England and Scotland, and smallest in Wales. Since the reform of PFI in 2012, central and subnational governments have sought to identify and recoup savings via PFI contract reviews and renegotiations. Local Partnerships, for example, has worked with over 57 public sector organisations, including local authorities, to identify around GBP 1.2 billion in PFI contract savings (Local Partnerships, 2016) (nominal whole life cost). This includes, for example, a savings of GBP 4.1 million over the life of a PFI street lighting contract for Newcastle and North Tyneside which originally had unitary charges totalling GBP 74.8 million (nominal whole life cost) (Local Partnerships, n.d).
Note: Assignment to level of government is based on the procuring authority. Current projects exclude expired or terminated projects and projects in procurement. Unitary charges in nominal terms, not discounted.
Source: Author’s calculation based on HM Treasury (2014), “Current projects as at 31 March 2014”, Excel.
Note: Unitary charges per capita are estimated by aggregating local authorities’ projects’ unitary charges to the regional level on an annual basis and dividing the sum by population values and projections available through 2037. Unitary charges extend past this date, but population projections were not available at the time of calculation. Figures are nominal, not discounted. Assignment of PFI projects to the local level was done on the basis of procuring authority. There are no projects for N. Ireland in which the procuring authority was a local government. Current projects exclude expired or terminated projects and projects in procurement.
Source: Author’s calculation based on HM Treasury (2014), “Current projects as at 31 March 2014”, Excel; ONS, “Table 1: 2012-based Subnational Population Projections for Regions in England”, 29 May 2014, Excel; StatsWales, “2012-based national population projections for Wales, 2012-2037”, Excel; National Records of Scotland, “Population Projections for Scottish Areas (2012-based)”, Excel; OECD, UK regional population statistics (TL2) 1992-2012, Excel, extracted from OECD.stat 12 Oct 2015.
Local authorities are not the only entities facing trade-offs between services and making unitary charge payments. NHS trusts have received much attention for their fiscal distress associated with PFI payments. For example, Peterborough and Stamford NHS Trust is “one of seven trusts with unaffordable PFI debts to receive money from a special GBP 1.5bn Department of Health (DoH) bailout fund to help keep them afloat” (Campbell, 2012). Unitary charges also present potential downsides to the private sector which can face unexpected delays, costs, and losses in delivering a project.
Incentives for a PFI-led approach to local asset development were likely enhanced by central government policy through 2010. Until that year, the central government offered “PFI credits” for English local authorities wishing to pursue PFI projects. The credits, issued through central government departments, were grants made available to local authorities to assist with repaying the capital investment (via unitary charges) once a PFI project was operational. The grants/credits effectively subsidized unitary charge payments. To access PFI credits, projects needed to meet specific conditions including compliance with SoPC guidance and a requirement that the project be off-balance sheet (EPEC, 2012a; NAO, 2009a). PFI projects that were off the local authority’s balance sheet under UK GAAP rules (and thus ESA95) did not count against the central department’s capital expenditure budget. By contrast, on-budget projects did. The NAO (2009a: 39) reported that “allocating each Department a set amount of PFI credits each year provides an incentive for the Department to pursue off-balance sheet projects. PFI credits are used by Departments as if they were another capital budget in addition to [their capital department expenditure limit], solely for off-balance sheet projects.” This approach could also provide an incentive for local authorities to structure projects to be off-budget and capture PFI credits rather than necessarily maximize value-for-money.8
As of February 2010, different central government departments had committed GBP 22 billion in PFI credits to 364 projects, with an additional GBP 7.3 billion in credits for 73 projects in the pipeline (Table 3.3). The credits were abandoned in 2010 as they were seen to distort the assessment of whether or not PFI was the appropriate procurement method and, in doing so, create a bias toward PFI (HM Treasury, 2012). Some of the credits were later retracted for budgetary reasons, as in the case of the waste infrastructure that follows. Similar subsidies were provided by the Scottish government in the form of “level playing field support”. These funds provided by the Scottish Executive to local authorities via the General Revenue Grant were to assist them with unitary charge payments associated with PFI projects (Cuthbert and Cuthbert, 2011). The level playing field support continues as grants to local governments (see Box 3.2 on private finance in Scotland).
Economies of scale
Because PFI focused on social infrastructure, most PFI projects (even bundled ones like schools) have tended to stay within administrative boundaries. Local PFIs have tended to correspond to local competences that do not have significant cross-border co-ordination requirements, such as schools. An exception may be waste management. Yet small-scale projects that may appeal to local governments are not always appropriate for the PFI approach. They do not necessarily represent value for money nor are they commercially viable (Vernon and Sanders, 2007). The UK’s standardised PFI guidance (SoPC4, discussed below) explicitly indicated that “the PFI is not suitable for projects with a capital value of less than GBP 20 million” (HM Treasury, 2007: 3). Efforts were made to create alternatives to a traditional PFI contract to tap the benefits of the PPP approach, put forward commercially viable projects, and achieve economies of scale (Vernon and Sanders, 2007). These either incorporated the use of PFI or involved alternative procurement. The approaches have included strategic partnering, multi-authority procurement, and multi-service projects (Vernon and Sanders, 2007):
-
Strategic partnering models have included the Local Improvement Finance Trust (LIFT) scheme for aggregating smaller health projects into larger schemes undertaken via joint venture involving the central government (Partnerships for Health), the local health body, and a private partner. A similar model was put in place for schools. The Building Schools for the Future (BSF) programme similarly involved aggregating school projects via a joint venture (a Local Education Partnership), that brought together the central government (Partnerships for Schools), the local authority and a private partner to develop and deliver school projects via private finance (PFI) or traditional design-build contracts (Vernon and Sanders, 2007);
-
At the local level, multi-authority procurement has involved different local authorities either jointly procuring an asset and separately contracting for services, or jointly procuring both the asset and services. Such joint procurement was encouraged by the central government and by the local government association as a way to increase procurement efficiency. It was encouraged for waste sector PFIs seeking to secure PFI credits (Vernon and Sanders, 2007); and
-
Finally, multi-service projects bring together a variety of services under one roof (i.e. a one-stop shop). Commonly referred to as a Joint Service Centre, these projects were commonly procured via PFI or LIFT schemes (Vernon and Sanders, 2007).
Seeking efficiency gains through joint procurement has not been restricted to England. In Scotland, the “hub” model brings together multiple public authorities in a geographic area and is a potential facilitator of collaboration. This is encouraged by the Scottish government, particularly for small-scale projects (see Box 3.2). Despite some evidence of joint procurement and shared assets, such collaboration is underutilised for public investment generally (Audit Scotland, 2013) and possibly for PPPs. At least in Scotland, local authorities report challenges aligning timetables and priorities (Audit Scotland, 2013).
Administrative capacity
Public private partnership arrangements are well-documented as complex transactions requiring expertise in a variety of areas. A lack of sufficient capacity for these complex transactions has been noted at the central and local levels alike (NAO, 2011). While both levels of government can face capacity challenges, the problems for local authorities can be more acute. From the outset of the PFI programme, the UK has actively worked to build and reinforce public sector capacity to engage effectively with the private sector. Its primary strategy has been to establish PPP units and other institutional structures to strengthen government capacity, reinforce project scrutiny, and provide financial resources to local governments to access technical support.9
With respect to institutional support, until 2010 the UK had three units at the national level working on PPPs: Partnerships UK (PUK), HM Treasury’s PPP Policy Team, and HM Treasury’s Infrastructure Finance Unit. In 2010, the three entities were consolidated and replaced by Infrastructure UK (Istrate and Puentes, 2011). PUK was active during the main years of growth of the PFI programme (2000-2010). 10 It was a fee-charging, public-private entity that worked with public authorities at all levels of government to facilitate PPP/PFI transactions and, to a lesser extent, support operational PPPs (EPEC, 2012a; PUK, 2009). IUK, by contrast, is wholly government owned. In addition to support from the national level, direct assistance is available to English local authorities via Local Partnerships (LP). LP is a joint venture between the Local Government Association and HM Treasury. It is the successor to 4ps (the Public Private Partnerships Programme) established in 1996 by the English and Welsh local government associations to help extent the PFI model to the local level (4ps, 2009; Winch, 2012). It supports local authorities’ capacity for procurement, project management, contract management, and funding and partnering abilities. Services have included independent scrutiny of PPP projects at key stages (gateway reviews) (EPEC, 2012a).
Reinforced scrutiny of local government projects came largely through the Project Review Group (PRG). The PRG, which involved representation from HM Treasury, the ministry responsible for local government (DCLG), and 4ps, oversaw the approval process of local projects receiving PFI credits (EPEC, 2012a) and was deemed “valuable” for project assurance (NAO, 2011: 7). Despite this, the NAO (2011: 7) pointed to scope for “greater project assurance.” With the abolition of PFI credits in 2010, the PRG mechanism was dropped and scrutiny of local projects was merged into the central government’s approval process for major projects (EPEC, 2012a). Local projects which receive no central government funding are not subject to this process and “have no formal interaction with central government” (EPEC, 2012a: 26).
Finally, the use of standardized contract documents helped to attenuate some of the risks presented by the complexity of PPP contracts and administrative capacity constraints of the public sector. The Standardisation of PFI Contracts (SoPC), developed by PUK and HM Treasury in 1999, provided standardized guidelines for PFIs. Updated four times through 2007, the last version (SoPC4) was succeeded by PF2 guidance. The use of SoPC aimed “first, to promote a common understanding of the main risks which are encountered in a standard PFI project; secondly, to allow consistency of approach and pricing across a range of similar projects; and thirdly, to reduce the time and costs of negotiation by enabling all parties concerned to agree a range of areas that can follow a standard approach without extended negotiation” (HM Treasury, 2007: 1). Use of SoPC, or approved sector-specific contracts such as for health and education, has been mandatory in England and Wales (HM Treasury, 2007; EPEC, 2012a) but models in Scotland and Ireland have been consistent with the SoPC (EPEC, 2012b; 2012c). There is some scope for procuring authorities to tailor individual contracts to meet project needs but any changes are subject to approval by HM Treasury (OECD, 2015). Consideration for local authority contracts above and beyond the SoPC4 were issued by 4ps in its “Local Authority Supplement to SoPC” (HM Treasury, 2007). The use of the SoPC and the limitation on alternatives has led to relatively uniform PFI contracts in England (EPEC, 2012a) and likely reinforced a minimum level of local capacity.
Much of the attention to public sector capacity appears to have revolved around project appraisal and effective procurement. Yet, because most PFI contracts have a life in excess of two decades, contract management is a critical but often underdeveloped public sector capacity. According to PWC (2011: 3), “PFIs rely upon the private sector regulating its own performance but this self-monitoring must be managed and tested as part of the public sector contract management function.” Unfortunately, contract management teams are often “woefully under-resourced and contract managers are often unaware of their rights under the contract or how to enforce them” (pg. 2). The authors highlight the need to provide the same level of resources and support to contract managers as is provided to procurement teams.
Scotland has substantial experience with various models of PPPs. From the late 1990s through 2010, the PFI approach to PPPs played an important role in infrastructure delivery. More recently, the Scottish government has emphasised new PPP models such as its non-profit distributing model (NPD) and hub models for infrastructure development. The motivations to pursue PFI (or PPPs more generally) have come, in part, from borrowing constraints. Until April 2015 (SFT, 2015a), the Scottish Government was unable to borrow to finance capital expenditures. Instead, traditionally procured capital expenditures had to be financed from the capital transfers received from the UK central government. PPPs (including PFI) offered additional resources for infrastructure investment, as well as the efficiency gains and long-term commitment to asset maintenance that come from the whole-of-life approach. In 2010, the UK spending review resulted in a 38% cut in capital transfers for Scotland (BBC, 2010), creating further impetus to seek private finance to meet infrastructure needs. Local authorities in Scotland can and do borrow for capital expenditure, but supplement this with capital transfers from the Scottish government and PPPs (i.e. PFI and NPD described below) (EPEC, 2012).
Responsibility for many areas of infrastructure and public private partnerships (exceptions include defence, telecoms, power) is devolved to Scotland, Wales and Northern Ireland. In Scotland, overall infrastructure investment is undertaken in the context of the “Infrastructure Investment Plan”. The 2011 Plan sets out investment priorities and mechanisms to finance those investments through 2020. Infrastructure projects are administered by the Infrastructure Investment Unit within the Finance Directorate (LexisPSL and Addleshaw Goddard, n.d.). It sponsors the Scottish Futures Trust (SFT), set up in 2008 to help ensure value-for-money in infrastructure investment for the region, including but not limited to PPPs (EPEC, 2012).Between 1999 and 2010, PFI played an important role in infrastructure development. Although PPP policy and guidance is determined by the Scottish Government, during this period the approach to PPPs generally followed the Standardisation of PFI Contracts (SOPC) promulgated by HM Treasury (EPEC, 2012). According to 2014 HM Treasury data, over the period of 1999-00 to 2013-14, a total of 88 PFI projects for Scotland were signed with a capital value of GBP 5.85 billion. These data indicate that the UK government acted as the procuring authority for 5 projects, Scottish government (including Scottish Water) for 16, health bodies for 27, and local authorities for 40 projects. Local authority projects accounted for 56% of total capital value. Nearly all of this value is associated with school projects (Audit Scotland, 2013).
In 2010, concerns about PFI and particularly excessive private sector profits led the Scottish Government to develop an alternative, albeit similar, PPP model. The Non-Profit Distributing Model (NPD) is similar to PFI in many ways but distinguished by the fact that there is no dividend-bearing equity, private sector returns are capped, surpluses are distributed back to the public sector, and there is a public interest director to protect public sector interests. In contrast to PFI (but not PF2), soft services are also not included in the contract. NPD has to date been used for developing infrastructure in further education, transportation, and health (SFT, 2015b). The Scottish government set aside GBP 3.5 billion for the NPD programme and, as of March 2015, had GBP 1.8 billion of projects under construction (SFT, 2015b). Under the Hub model, public authorities in one of five designated geographical areas along with the Scottish Government (via SFT) enter into a joint venture with a private actor (a “hubco” company not unlike an SPV) to deliver a pipeline of infrastructure projects for the particular area. Projects delivered via the hubco can be traditionally procured, or procured via private finance. In the latter case, returns are capped. The Hub model is generally used for smaller projects than NPD. GBP 450 million of the GBP 1.25 billion “Scotland’s Schools for the Future” programme is expected to be delivered via “hub” (EPEC, 2012). SFT also uses other models for facilitating private participation in (local) infrastructure, including the National Housing Trust and Tax Incremental Financing (EPEC, 2012). SFT provides technical support to procuring authorities for the different models.
Challenges to implementing PPP projects in Scotland are similar in many ways to those experienced in England. With respect to multi-level governance, while “value-for-money” is ostensibly the primary driver when it comes to choosing between traditional procurement or private finance, EU-driven classification treatment appears to play an important role in Scotland (as elsewhere in the UK). NPD and Hub projects that did not count toward public sector debt and deficit figures under ESA95 rules may be more likely to do so under new rules which came into effect in late 2014 (ESA10) (Dockreay, 2015). If this were to be the case, instead of providing the additionality needed to meet infrastructure needs, the projects could be counted against government capital budgets. The UK Office of National Statistics ruled that Scotland’s largest NPD project, the Aberdeen Western Peripheral Route (AWPR), must be reclassified as public sector (Dockreay, 2015). In response, Scotland is expected to amend the AWPR contract and consider adjustments to the hub model in response to the new ESA10 rules (Dockreay, 2015).
With respect to financing and funding, it is important to note that while PFI has played an important role in infrastructure development, at the local level the amount of capital value procured via private finance was dwarfed by local capital expenditures. As of March 2013, local authorities had invested GBP 27 billion in infrastructure in real terms since 2000/01: GBP 23 billion from their capital budgets and nearly GBP 4 billion via private finance (PFI and NPD) (Audit Scotland, 2013). For PFI projects only (i.e. excluding NPD), unitary charges total GBP 31.3 billion through 2041-42, of which GBP 15.2 billion are associated with local authority projects (HM Treasury, 2014). Including both NPD and PFI payments, unitary charges for local authorities will peak in 2025/26 at approximately GBP 591 million (Audit Scotland, 2013). Local authorities only pay a portion of this cost, however. As with the English “PFI credits”, the Scottish Government has traditionally provided funds to assist local authorities with unitary charges (previously called “level playing field support”). In 2012/13, this support amounted to 49% of the annual cost of the payments (Audit Scotland, 2013).
With respect to cross-jurisdictional co-ordination for PPPs, the hub model has the potential to facilitate collaboration. It is unique in that it combines entities across sectors (i.e. health, education, fire, police) in a given place and brings them together with a private development partner. While collaboration is not obligatory, it is encouraged by the Scottish government – particularly for projects that are too small to justify the overhead costs involved with launching a PPP. Despite all this, there are still challenges in getting different authorities to align priorities, budgets, and trust to make collaboration happen both for PPPs and for public investment generally (Audit Scotland, 2013).
As elsewhere, local administrative capacities in Scotland are mixed. There are 32 local authorities, many of which conduct very few PPPs. As a result, the in-house technical capacity to procure a complex PPP project may not necessarily exist. Even if it does, due to the infrequency of deals, it may not remain into the future. Once projects are closed, the contract monitoring is also a challenge. There can be a lack of understanding of the contract and how to ensure a contractor is delivering properly. As a result, local authorities may end up receiving less than expected from a PPP deal. Scottish Futures Trust (SFT) aims to reinforce local capacity by facilitating a transfer of resources, in the form of seconded staff, either from SFT to public authorities or among authorities themselves. They also carry out independent expert reviews at key stages of a project (“Gateway Reviews”) to reinforce project planning and make adjustments if needed.
The 2013 Audit Scotland report on major capital projects at the local level suggests that good practices such as design quality assessment and gateway reviews are more likely to occur for PFI projects than traditionally procured ones.
Sources: Audit Scotland (2013), “Major capital investment in councils”, Edinburgh; European PPP Expertise Centre (EPEC) (2012), “United Kingdom - Scotland: PPP Units and Related Institutional Framework”, June 2012; LexisPSL and Addleshaw Goddard (n.d.), “UK infrastructure projects--relevant sources, government bodies and guidance”, LexisPSL Practice Note; Scottish Futures Trust (SFT) (2015a), “SFTinvest”, webpage, www.scottishfuturestrust.org.uk/our-work/funding-and-finance (accessed 7 Dec 2015); Scottish Futures Trust (SFT) (2015b), “Non-Profit Distributing (NPD)”,webpage,www.scottishfuturestrust.org.uk/our-work/funding-and-finance/non-profit-distributing/ (accessed 3 Dec 2015); Dockreay, A. (2015), “ESA10: EU accounting trouble for Scotland’s NPD scheme”, IJGlobal, 6 Aug 2015; “Reforming PFI: Lessons from Scotland”, SocInvest, 10 Oct 2012; HM Treasury (2014), “Current projects as at 31 March 2014”, Excel; “Spending Review: Cuts ‘threaten 12,000 Scottish jobs’”, 20 Oct 2010, BBC News.
PFIs and England’s “Waste Infrastructure Delivery Programme” (WIDP)
How have some of the issues raised in previous section played out with respect to specific PPPs? Some of the issues can be illustrated by examining England’s “Waste Infrastructure Delivery Programme” (WIDP).
In 1999, the European Union issued the Landfill Directive (1999/31/EC) which set targets for member states to reduce the amount of biodegradable waste sent to landfills. Failure to meet targets can lead to fines (NAO, 2009b). Targets exist for England, Scotland, Northern Ireland and Wales (NAO, 2014). The UK’s Department for Environment, Food and Rural Affairs (Defra) is responsible for ensuring that England achieves its targets (NAO, 2014). Prior to 2001, this responsibility lay with Defra’s predecessor, the Department for the Environment, Transport and the Regions (NAO, 2014). It is local authorities, however, that are responsible for municipal waste disposal. The national strategy for achieving the EU targets thus heavily implies local authorities. They decide if and how to invest in waste disposal infrastructure (NAO, 2009b).
Despite the reliance on local authorities to achieve EU targets, prior to 2003 Defra did not have a clear strategy for facilitating new local waste infrastructure (NAO, 2009b). Moreover, intergovernmental relations were not particularly well organized to tap PFI as a mechanism for developing waste infrastructure capacity. According to the NAO (2009b), responsibility for managing the programme within the Department was unclear; early guidance for the PFI projects did not focus on landfill diversion or the EU directive; and the Department approved projects on a first-come, first-served basis. In 2006, Defra established the “Waste Infrastructure Delivery Programme” (WIDP) to “accelerate” development of local waste infrastructure by providing support and funding for waste PFI projects (NAO, 2014). The programme was given a clear structure, bringing together ~30 staff from Defra, Partnerships UK, and 4ps in a single team managed by Defra. Local authorities were invited to develop projects for the Department’s approval in organised procurement rounds, as opposed to a case-by-case basis (NAO, 2009b). Funding for projects increased.
Local authorities have not been obliged to choose PFI as their procurement route. Where they opted for a PFI project, PFI credits have been available. Prior to 2003, the amount of PFI credits available was limited (NAO, 2009b). Figures reported by the NAO (2009b) show that in 2002 HM Treasury allocated GBP 355 million to Defra for PFI credits, which were then capped at a maximum of GBP 25 million per project. The report notes that the allocation dropped in 2004 to GBP 275 million and the maximum grant allowed increased to GBP 40 million. Following the 2007 Spending Review, the allocation increased substantially to GBP 2 billion and the credits were capped at 50% of a project’s capital costs (NAO, 2009b). With better organisation, better support, and better funding, PFI contracts began to increase. As of 2014, the central government had committed GBP 1.7 billion in PFI credits (renamed Waste Infrastructure Credits in 2011) for 28 local authorities’ PFI waste infrastructure projects (NAO, 2014; House of Commons, 2014).
PFI waste projects require interaction not only between central and local governments but also between local authorities. Defra has encouraged cross-jurisdictional co-ordination to bring together neighbouring authorities. According to the NAO (2009b:19), “the potential benefits of joint projects are: fewer facilities needing planning permission; economies of scale in project costs; the pooling of risks; and possible operating benefits from a joined up local approach to waste management.” Although most projects have involved only a single local authority, there have been some instances of cross-jurisdictional collaboration and (as of 2008) an increasing number of authorities involved in projects under development.
Not all WIDP projects have gone smoothly. Three projects in particular have received a great deal of attention for their failures: those of Surrey, Herefordshire and Worcestershire, and Norfolk County Council. They highlight some issues of multi-level governance in the management of local PFI contracts.
The projects in Herefordshire and Worcestershire (a joint project) and in Surrey were launched in 1998 and 1999 under Defra’s predecessor, the Department for Environment, Transport and the Regions (NAO, 2014). At that time the PFI programme was still in its early stages and the approach (in retrospect) proved lax. In this case, the central government agreed to begin grant payments to local authorities when the contractors began to deliver waste management services rather than when they delivered planned assets. Because the local authorities’ PFI contracts did not require the contractors to construct all assets before receiving payment, and the Department’s contract with the councils did not allow it to unilaterally stop or alter its payments, the Department (and Defra as its successor) ended up paying GBP 213.5 million in PFI credits between 1999 and March 2014, although the main waste assets had not been delivered (House of Commons, 2014). For Herefordshire and Worcestershire, delays resulted from difficulties securing planning permission, uncertainty regarding the final market for waste processing by-product, and problems with financing (resulting from the delays) (NAO, 2014). Problems with financing for Herefordshire and Worcestershire ultimately lead to a transformation of the project such that local authorities opted to act as the sole source of funding for construction (NAO, 2014). In both cases, Defra ultimately changed its payment agreement with local authorities, reducing its funding for both Surrey and for Herefordshire and Worcestershire (NAO, 2014; House of Commons, 2014).
The third problematic waste PFI involves Norfolk County Council. In 2012, Defra agreed to GBP 91 million in PFI credits/grants for a 25-year contract to build an energy-from-waste facility (House of Commons, 2014). It agreed to the funding despite concerns about the council’s ability to secure planning permission (House of Commons, 2014). Securing planning permission did ultimately prove highly problematic. The planning application was called in for review by the Secretary of State for Communities and Local Government, and as a result the Council missed the June 2013 deadline for obtaining planning permission set out in its agreement with Defra (NAO, 2014). According to the NAO (2014:18), “when a local authority breaches the terms of its funding agreement, the Department uses [its waste infrastructure capacity model], along with the Programme team’s judgement, to decide whether the infrastructure is still needed to meet the EU targets and therefore whether it should continue to offer funding support to the contract”. With recognition that the Norfolk facility would not be necessary to meet EU targets, after discussions with the local authority about the likely impact of its decision, Defra revoked the PFI credit funding in October 2013 (NAO, 2014). With planning permission still delayed at the outset of 2014, Norfolk County Council terminated the PFI contract triggering a termination payment of approximately GBP 33.7 million to the contractor (NAO, 2014).
What went wrong? What does it imply about governance arrangements? First, the Surrey and the Herefordshire and Worcestershire projects pre-date the WIDP. Difficulties obtaining planning permission and uncertainty regarding technology are not entirely unexpected for waste infrastructure projects (NAO, 2009b). However, the early contractual arrangements between the local authority and the contractor, and between the local authority and the central government were insufficient. The NAO (2014: 20) found that over time as Defra “gained experience of the issues these projects were likely to encounter, the terms and conditions of its later funding agreements (such as the agreement with Norfolk) became stricter, giving the Department greater scope to reduce or remove funding support”. Surrey and Herefordshire and Worcestershire were not the only projects confronting difficulties delivering planned infrastructure. Five “legacy” PFI waste projects were reviewed in 2011 (including Surrey and Herefordshire and Worcestershire) and, in 2013, it was agreed that changes should be pursued to link central government payments with the delivery of the planned infrastructure (NAO, 2014). It is also worth noting that the management of the PFI credits was in regular flux. Over time, responsibility for managing and paying the grants to local authorities was “transferred from the Department for Environment, Transport and the Regions to the Department for Transport, Local Government and the Regions, then to the Office of the Deputy Prime Minister, then to the Department for Communities and Local Government and finally to the Department for Environment, Food & Rural Affairs in April 2011” (NAO, 2014: 9).
With respect to Norfolk, some conclude that Defra demonstrated poor judgement by agreeing to the PFI credits despite early concerns about planning permission, and then later by withdrawing support knowing the risk of termination payments (House of Commons, 2014). Yet blame can be shared with the local authority that failed to attend to Defra’s early concerns regarding planning permission and proceeded with a too-optimistic timetable. The impact of the EU targets in this case is interesting. The project was allowed to “fail” after Defra concluded it was not integral to meeting EU targets. This is, in some ways, consistent with Defra’s 2010 decision to withdraw provisional grant support (PFI credits) from seven local waste PFI projects in order to save money. Support was withdrawn because the projects were deemed unnecessary to achieve the 2020 EU landfill diversion targets (Defra, 2010). This raises questions about the incentive effects of the EU targets for central government support of possibly problematic local projects that could contribute to landfill targets.
Discussion and conclusions
PFI has played an integral role in delivering a great deal of social infrastructure at the local level in England. As existing literature has documented, at the outset of the PFI programme, local authorities had to confront historical underinvestment in operations and maintenance of capital assets, a poor public track record of delivering infrastructure projects on-time and on-budget, limits to their borrowing for capital expenditures, and the effect of borrowing on the Public Sector Net Debt. The PFI addressed many of these concerns. As of March 2014, there were 728 current PFI projects with a total capital value of GBP 56.6 bn. As noted earlier, much of this new infrastructure may not have occurred without private finance, and analysis suggests that PFI projects tend to outperform traditional procurement in terms of cost and schedule overruns.
PFI’s detractors paint a less rosy picture. While the initiative developed much infrastructure, it has also come with costs and challenges. As highlighted at the outset, early PFI deals were delayed by legal issues, problematic bidding procedures, and weak public sector capacity. Reforms were introduced that paved a smoother road for PFI projects going forward. 1999 saw the creation of Partnerships UK to reinforce capacity at all levels of government for PFI deals. PUK, along with PPP units introduced by central government departments, Local Partnerships, and even a local PPP unit (Leeds), facilitated project assessment, standardized contract models, and strengthened local capacity relative to the private sector. Introduction of the Project Review Group, with representation by 4ps, enhanced scrutiny of local projects prior to funding approval. The introduction of and updates to SOPC helped to standardize treatment of risk PFI projects and streamline procurement. The case of WIPD highlights the impact of improved contractual arrangements over time. Yet, despite these efforts criticisms remained: concerns regarding risk allocation, insufficient contract flexibility, a lack of transparency around contingent liabilities, perceived excessive private sector profits; and lengthy procurement timetables led to a reform and rebranding of PFI in 2012. The burden of unitary payments in a tight fiscal environment remains a concern.
What lessons regarding governance emerge from this experience? First, it is worth recalling that public private partnerships represent an alternative to traditional procurement. Well-structured governance arrangements that remove obstacles to successful project design and delivery – from legal impediments to administrative capacity constraints – help make PPPs a viable alternative. However, some multi-level governance arrangements of public private partnerships affect the incentives for PFI uptake and contribute to the success (or weaknesses) of project outcomes. Some mechanisms potentially bias local authorities toward PFI as the preferred approach to procurement. The Eurostat statistical treatment of PPPs creates incentives for all levels of government to structure deals in ways that keep projects from impacting National Accounts. Local government constraints on financing capital expenditures and the PFI credits offered by the central government (which emphasized off-budget treatment of PFI) may well have created an incentive for local governments to emphasize PFI more than they otherwise would have done. Incentive effects of governance arrangements clearly deserve ongoing attention.
Finally, with respect to administrative capacity, many local governments are likely to be at a disadvantage relative to the private sector. Clear efforts have been made to reinforce local authority (and central government) expertise through the introduction of the national PPP unit, line ministry units, 4ps/Local Partnerships, enhanced project scrutiny, and standardisation of contracts. In all likelihood, this has reduced the risk of poorly structured deals and prevented a variety of failures. On the other hand, the experience of indexing in Scotland, the problematic local waste projects, and the need for deal restructuring among English local authorities reveals the need for continued reinforcement of public sector capacity, including sufficient support once projects are operational.
References
4ps (2009), “About us”, website, archived at http://webarchive.nationalarchives.gov.uk/ 20090204152904/ http://4ps.gov.uk/PageContent.aspx?id=28&tp (accessed 24 November 2015).
Audit Scotland (2013), “Major capital investment in councils”, March 2013, Edinburgh.
BBC News (2010), “Spending Review: Cuts threaten 12,000 Scottish jobs”, 20 Oct 2010, www.bbc.com/news/uk-scotland-11576631 (accessed 4 December 2014).
Booth, L. and V. Starodubtseva (2015), “PFI: costs and benefits”, House of Commons, Briefing Paper, No. 6007, 13 May 2015.
Cabinet Office (2015), “Government creates new body to help manage and deliver major projects for UK economy”, press release, 11 November 2015, www.gov.uk/government/news/government-creates-new-body-to-help-manage-and-deliver-major-projects-for-uk-economy (accessed 6 December 2015).
Campbell, D. (2012), “NHS trust criticised for 'catalogue of mismanagement' over £411m PFI deal”, The Guardian, 29 November 2012, www.theguardian.com/society/2012/nov/29/peterborough-nhs-trust-pfi-nao (accessed 25 November 2015).
CEMR (Council of European Municipalities and Regions) (2012), “Local and Regional Government in Europe, Structures and Competences”, www.CEMR.org/img/uploads/piecesjointe/filename/ local_government_structuresandcompetences_2012_en.pdf (accessed 6 December 2015).
Clark, T., M. Elsby and S. Love (2002), “Trends in British Public Investment”, Fiscal Studies, Vol. 23, No. 3, pp. 305–342.
Corner, D. (2006), “The United Kingdom Private Finance Initiative: The Challenge of Allocating Risk”, OECD Journal on Budgeting, Vol. 6, No. 3.
Cuthbert, M. and J. Cuthbert (2011), “The effect of PFI commitments on local authority finances”, Fraser of Allander Economic Commentary, March 2011, Vol 34 No 3, pp. 53-62.
DCLG (Department for Communities and Local Government) (2010), “Local Authority PFI Projects”, Excel, as of February 2010, archived at http://webarchive.nationalarchives.gov.uk/20101012141939/ and www.communities.gov.uk/localgovernment/localgovernmentfinance/pupprivatepartnership/ (accessed 6 October 2015).
Defra (Department for Environment, Food and Rural Affairs) (2010), “Withdrawal of provisional allocation of PFI credits from projects that will now not be needed to meet the 2020 landfill diversion targets”, press release, 20 October 2010, www.gov.uk/government/news/changes-to-pfi-programme (accessed 10 December 2015).
Dockreay, A. (2015), “ESA10: EU accounting trouble for Scotland’s NPD scheme”, IJGlobal, 6 August 2015, https://ijglobal.com/articles/97334/esa10-eu-accounting-trouble-for-scotlands-npd-scheme (accessed 4 December 2015).
EC (European Commission), Economic and Financial Affairs (2015), “Graph of the week: Excessive Deficit Procedure explained”, http://ec.europa.eu/economy_finance/graphs/2014-11-10_excessive_deficit_procedure_explained_en.htm (accessed 3 December 2015).
EFA (Education Funding Agency) (2015), “Guidance: Priority School Building Programme: overview”, updated 7 August 2015, www.gov.uk/government/publications/psbp-overview/priority-school-building-programme-overview (accessed 17 December 2015).
EPEC (European PPP Expertise Centre) (2015), “Debt and deficit treatment of PPPs according to Eurostat”, webpage, The EPEC PPP Guide online, www.eib.org/epec/g2g/i-project-identification/12/125/index.htm (accessed 3 December 2015).
EPEC (2012a), “United Kingdom - England: PPP Units and Related Institutional Framework”, European PPP Expertise Centre, www.eib.org/epec/resources/publications/epec_uk_england_public_en.pdf (accessed 12 May 2015).
EPEC (2012b), “United Kingdom - Northern Ireland: PPP Units and Related Institutional Framework”, European PPP Expertise Centre, www.eib.org/epec/resources/publications/epec_uk_scotland_ public_en.pdf (accessed 12 May 2015).
EPEC (2012c), “United Kingdom - Scotland: PPP Units and Related Institutional Framework”, European PPP Expertise Centre, www.eib.org/epec/resources/publications/epec_uk_scotland_public_en.pdf (accessed 12 May 2015).
EPEC (2010), “Eurostat Treatment of Public‐Private Partnerships: Purposes, Methodology and Recent Trends”, European PPP Expertise Centre, www.eib.org/epec/resources/epec-eurostat-statistical-treatment-of-ppps.pdf (accessed 3 December 2015).
HM Treasury (2014a), “Current projects as at 31 March 2014”, Excel, www.gov.uk/government/uploads/ system/uploads/attachment_data/file/387225/current_projects_as_at_31_March_2014.xlsx (accessed 14 July 2015).
HM Treasury (2014b), “Private Finance Initiative projects: 2014 summary data”, December 2014, London.
HM Treasury (2014c), “National Infrastructure Plan 2014”, December 2014.
HM Treasury (2012), “A new approach to public private partnerships”, London, UK.
HM Treasury (2007), “Standardisation of PFI Contracts, Version 4”, March 2007, http://webarchive.nationalarchives.gov.uk/20130410173120/ and http://hm-treasury.gov.uk/d/pfi_sopc4pu101_210307.pdf (accessed 8 December 2015).
House of Commons, Committee of Public Accounts (2014), “The Department for Environment, Food and Rural Affairs: oversight of three PFI waste projects”, September 2014.
House of Commons, Treasury Committee (2011), “Private Finance Initiative”, Seventeenth Report of Session 2010–12, HC 1146, August 2011.
House of Lords (2010), “Private Finance Projects and off-balance sheet debt, Volume I: Report”, House of Lords Select Committee on Economic Affairs, 17 March 2010.
Istrate, E. and R. Puentes (2011), “Moving Forward on Public Private Partnerships: U.S. and International Experience with PPP Units”, Brookings-Rockefeller Project on State and Metropolitan Innovation, December 2011, www.brookings.edu/~/media/research/files/papers/2011/12/08 transportation istrate puentes/1208_transportation_istrate_puentes.pdf and www.brookings.edu/wp-content/uploads/2016/06/1208_transportation_istrate_puentes.pdf (accessed 3 April 2017).
LexisPSL (n.d.), “The National Infrastructure Plan“, LexisPSL Practice Note, www.lexisnexis.com/uk/lexispsl/bankingandfinance/document/391375/5CNW-YG61-F186-J05N-00000-00s (accessed 4 June 2015).
LexisPSL and Addleshaw Goddard (n.d.-a), “Introduction to the Private Finance Initiative and Public Private Partnerships“, LexisPSL Practice Note, www.lexisnexis.com/uk/lexispsl/bankingand finance/document/391290/5D5H-YVP1-F185-S3W8-00000-00 (accessed 4 June 2015).
LexisPSL and Addleshaw Goddard (n.d.-b), “PFI--UK developments and reform“, LexisPSL Practice Note, www.lexisnexis.com/uk/lexispsl/bankingandfinance/document/391290/5D5H-YVP1-F185-S4N3-00000-00 (accessed 4 June 2015).
LexisPSL and Addleshaw Goddard (n.d.-c), “UK infrastructure projects--relevant sources, government bodies and guidance“, LexisPSL Practice Note. www.lexisnexis.com/uk/lexispsl/bankingand finance/document/391290/5D5H-YVP1-F185-S4CK-00000-00 (accessed 4 June 2015).
LexisPSL and Addleshaw Goddard (n.d.-d), “Forms of Public Private Partnerships”, LexisPSL Practice Note; www.lexisnexis.com/uk/lexispsl/bankingandfinance/document/391290/5D5H-YVP1-F185-S4MR-00000-00/Forms%20of%20Public%20Private%20Partnerships (accessed 4 June 2015).
LexisPSL and Digings, L. (n.d.), “Procurement law“, LexisPSL Practice Note, www.lexisnexis.com/uk/lexispsl/bankingandfinance/document/393985/55MK-3T41-F18D-K15G-00000-00/ (accessed 4 June 2015).
LexisPSL and Laver, N. (2013), “PF2--the story so far“, LexisPSL News Analysis. www.lexisnexis.com/uk/lexispsl/bankingandfinance/document/391370/595Y-7FM1-F186-50M6-00000-00 (accessed 4 June 2015).
LexisPSL and Laver, N. (2012), “PF2--a new look for PFI?“, LexisPSL News Analysis, www.lexisnexis.com/uk/lexispsl/bankingandfinance/document/391288/576R-38H1-F186-P3NF-00000-00 (accessed 4 June 2015).
Local Partnerships (2016), “Efficiency – A commercial approach to achieve savings”, http://localpartnerships.org.uk/wp-content/uploads/2016/08/Efficiency-A-commercial-approach-to-achieve-savings.pdf (accessed 6 Feb 2017).
Local Partnerships (n.d.), “Case Study: Contract review - energy management, Newcastle & North Tyneside Street Lighting”, London, http://localpartnerships.org.uk/images/files/Case_Study_-_Newcastle__North_Tyneside_-_Energy_Management.pdf (accessed 24 Oct 2015)
NAO (National Audit Office) (2015a), “A Short Guide to the NAO’s work on local authorities”, July 2015.
NAO (2015b), “A Short Guide to the Department for Communities and Local Government”, July 2015.
NAO (2014), “Department for Environment, Food & Rural Affairs, Oversight of three PFI waste projects”, report by the Comptroller and Auditor General, HC 264 Session 2014-2015, 17 June 2014.
NAO (2011), “Lessons from PFI and other projects”, report by the Comptroller and Auditor General, HC 920 Session 2010-2012, 15 April 2011.
NAO (2010), “Financing PFI projects in the credit crisis and the Treasury’s response”, report by the Comptroller and Auditor General, HC 287 Session 2010-2011, 27 July 2010.
NAO (2009a), “Private Finance Projects”, a paper prepared for the Lords Economic Affairs Committee, October 2009.
NAO (2009b), “Department for Environment, Food & Rural Affairs, Managing the waste PFI programme”, report by the Comptroller and Auditor General, 14 January 2009.
National Records of Scotland (2014), “Population Projections for Scottish Areas (2012-based)”, Excel, www.nrscotland.gov.uk/statistics-and-data/statistics/statistics-by-theme/population/population-projections/sub-national-population-projections/2012-based/list-of-tables (accessed 12 October 2015).
Navarro-Espigares, J.L. and J.A. Martín-Segura (2011), “Public–private partnership and regional productivity in the UK”, The Service Industries Journal, 31:4, 559-580, https://doi.org/10.1080/ 02642069.2010.504303.
Northern Ireland Executive (2015), “Local government reform”, webpage, www.nidirect.gov.uk/index/information-and-services/government-citizens-and-rights/government/local-government/local-government-reform.htm (accessed 6 December 2015).
OECD (2015), “OECD Review of Public Governance of Public-Private Partnerships in the United Kingdom”, OECD, April 2015, https://www.oecd.org/governance/procurement/toolbox/search/oecd-review-public-governance-ppp-uk.pdf.
OECD (2009), OECD Economic Surveys: United Kingdom 2009, OECD Publishing, Paris, https://doi.org/10.1787/eco_surveys-gbr-2009-en
OECD, UK regional population statistics (TL2) 1992-2012, Excel, extracted from OECD.stat 12 October 2015.
ONS (Office of National Statistics) (2015), “MYE2: Population Estimates by single year of age and sex for local authorities in the UK, mid-2014”, Excel, version 25 June 2015.
ONS (2014), “Table 1: 2012-based Subnational Population Projections for Regions in England”, last updated 29 May 2014, Excel, www.ons.gov.uk/ons/rel/snpp/sub-national-population-projections/2012-based-projections/index.html (accessed 12 October 2015).
ONS (2006), “Government and public sector debt measures”, September 2006, www.ons.gov.uk/ons/guide-method/method-quality/specific/economy/public-sector-finances/government-and-public-sector-debt-measures.pdf (accessed 10 December 2015).
Partnerships Bulletin (2007), “Page Turner”, 30 August 2007, www.partnershipsbulletin.com/interviews/view/4 (accessed 24 November 2015).
Pisu, M., B. Pels and N. Bottini (2015), “Improving infrastructure in the United Kingdom”, OECD Economics Department Working Papers, No. 1244, OECD Publishing, Paris, https://doi.org/10.1787/5jrxqbqc7m0p-en.
PriceWaterhouseCoopers (PWC) (2011), “Is PFI working? Buying excellent, settling for average”, Talking Points, http://hb.betterregulation.com/external/Is%20PFI%20working%20 Buying%20excellent,%20settling%20for%20average.pdf (accessed 9 December 2015).
PUK (Partnerships UK) (2009), “What we do”, webpage, archived at http://webarchive.nationalarchives.gov.uk/20110518155402/ and www.partnershipsuk.org.uk/What-PUK-Do.aspx (accessed 10 December 2015).
Scottish Government (2015), “About Local Government in Scotland”, www.gov.scot/Topics/Government/local-government/localg (accessed 6 December 2015).
SFT (Scottish Futures Trust) (2015a), “SFTinvest”, www.scottishfuturestrust.org.uk/our-work/funding-and-finance (accessed 7 December 2015).
SFT (2015b), “Non-Profit Distributing (NPD)”, www.scottishfuturestrust.org.uk/our-work/funding-and-finance/non-profit-distributing/ (accessed 3 December 2015).
SocInvest (2012), “Reforming PFI: Lessons from Scotland”, 10 October 2012, www.socinvest.co.uk/news/3465/Reforming-PFI-Lessons-from-Scotland (accessed 3 December 2015).
StatsWales (2013), “2012-based national population projections for Wales, 2012-2037”, Excel, last updated November 2013, https://statswales.wales.gov.uk/Catalogue/Population-and-Migration/Population/Projections/National/2012-Based/PopulationProjections-by-Year-Gender (accessed 12 October 2015).
UK Office of Budget Responsibility (2015), PSF Aggregates Databank, Excel, November 2015, http://budgetresponsibility.org.uk/data/ (accessed 9 December 2015).
Vernon, P. and J. Sanders (2007), “The Move Towards Batched Projects”, in the International Comparative Legal Guide to PFI / PPP Projects 2007, Global Legal Group Ltd., London, pp. 1-6.
Welsh Government (2015a), “Unitary authorities”, http://gov.wales/topics/localgovernment/unitary-authorities/?lang=en (accessed 6 December 2015).
Welsh Government (2015b), “Wales Infrastructure Investment Plan”, webpage, updated 23 June 2015, http://gov.wales/funding/wiipindex/?lang=en (accessed 14 December 2015).
Wilson, D. and C. Game (2011), Local Government in the United Kingdom, 5th Edition, Palgrave MacMillan.
Winch, G. M. (2012), “30 Years of private finance in the United Kingdom“, in Winch, G.M., Onishi, M. and S. Schmidt (eds.) (2012), Taking Stock of PPP and PFI Around the World, Vol. Report No. 126, London: Association of Chartered Certified Accountants, pp. 117-125.
Winch, G.M., M. Onishi and S. Schmidt (eds.) (2012), Taking Stock of PPP and PFI Around the World, Vol. Report No. 126, London: Association of Chartered Certified Accountants.
Notes
← 1. Navarro-Espigares and Martín-Segura (2011) examine the relationship between PFI investments and regional productivity. They use similar data to this case study (in their case the “PFI signed projects list” published in April 2009 and last consulted by the authors in July 2009) to group the number and value of PFI projects by region and within each region by “promoting authority”. In their case promoting authorities are: local authority, health authority, and “other”. The authors do not explicitly describe how they assign projects to a “promoting authority”. As in this case study, they also examine capital value per capita and unitary charges.
← 2. Assignment to level of government has been done by the author. This case study differentiates between PPPs undertaken by devolved authorities, NHS, and local authorities in Scotland, Wales, and Northern Ireland. This approach differs from that of HM Treasury, which treats any projects occurring in Scotland, Wales, and Northern Ireland as “devolved”.
← 3. The Lloyd George Avenue and Callaghan Square PFI in Wales was reclassified from “hospitals and acute health” to “roads and highway maintenance.”
← 4. The central government stepped in March 2009 to facilitate project financing and improve market confidence with the introduction of the Infrastructure Finance Unit, which could provide loans to PFI projects on commercial terms (NAO, 2010). Only one loan was made, but an additional 35 projects were able to secure financing suggesting markets did respond favourably to its creation (NAO, 2010).
← 5. For a detailed discussion of the public governance arrangements for PPPs in the UK, see OECD (2015).
← 6. There are separate rules for defence and security procurement in the Defence and Security Procurement Directive (2009/81/EC) (LexisPSL and Digings, n.d.)
← 7. See, for example, the discussion of the sustainable investment rule and PFI in OECD (2009).
← 8. For the specific incentives created with respect to contract structure, see NAO (2009: 40-41).
← 9. For an in-depth discussion, see OECD (2015).
← 10. According to the EPEC (2012a), the first PFIs were facilitated by the Private Finance Panel (PFP), created in 1993 and staffed by (mainly private sector) personnel. The PFP was intended to encourage public and private participation in PFI and troubleshoot problems that might present hurdles to PFI roll-out. It was followed by the “PFI Taskforce” established within HM Treasury following the first government (“Bates”) review of PFI progress in 1997. A second review, undertaken in 1999, recommended that the PFI Taskforce be replaced with a permanent support entity, Partnerships UK.