Chapter 5. Improving the design of indirect taxes
Slovenia’s tax mix relies heavily on consumption taxes. The standard VAT rate is high and the reduced VAT rate, which is relatively low, applies to a large number of goods and services. As the VAT rate in neighbouring countries is lower, increasing the standard VAT rate might come at significant costs in terms of cross-border shopping. Instead Slovenia should keep its standard VAT rate at its current level. However, there is scope to address regressive distributional effects of the reduced VAT rate. Some of the products and services which are taxed at the reduced VAT rate benefit the rich more than the poor both in relative and absolute amounts. This is the case for cultural activities, hotels, restaurants, and air transport. Over time and when neighbouring countries would continue to increase their rates, there might be some scope to further increase excise duties, in particular on alcohol and tobacco.
5.1. Slovenia has a standard VAT rate above the OECD average levied on a narrow base
Slovenia raises a significant amount of revenue from consumption taxes. As discussed in Chapter 1, Slovenia’s tax structure is tilted towards consumption taxes (40% of total revenue in 2016). Among consumption taxes, Slovenia relies mainly on value-added taxes (VAT) (22.6% of total revenues) and taxes on specific goods and services (14.2% of total revenues) (Figure 5.1 Panel A). Their shares have slightly increased over time (Figure 5.1 Panel B). In this context, scope to increase revenues from consumption taxes exists but is limited.
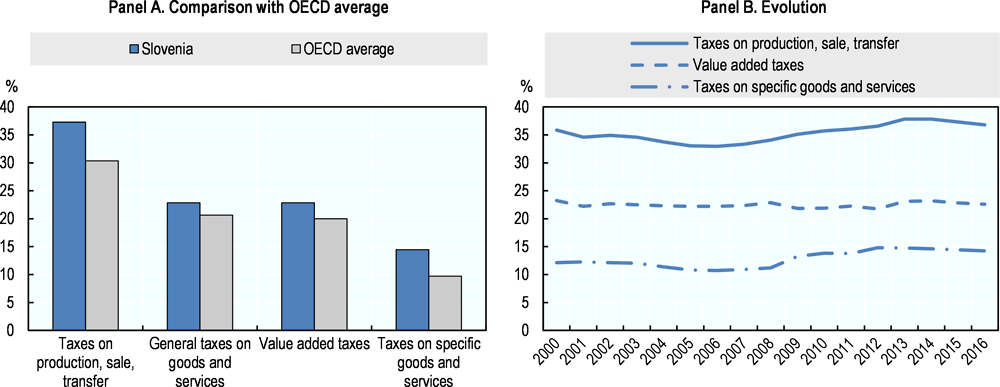
Note: Panel A: 2015 data.
Source: OECD Tax database.
Slovenia’s standard VAT rate is above both the OECD and the European Union (EU) averages. Slovenia has increased its standard VAT rate in 2014, from 20% to 22% (Figure 5.2 Panel A). It is above the OECD average (19.2%). The standard VAT rate in Slovenia also exceeds the rate in neighbouring countries such as Austria or the Slovak Republic (20%) and other South East European economies where it ranges between 17% and 20%. The rate is equal to the rate in Italy, and lower than in Hungary (27%) (Figure 5.2 Panel B). As the VAT rate is relatively high, Slovenia should not aim to raise the rate further but instead maintain it as its current level.
Slovenia’s reduced VAT rate applies to a large number of goods and services including food, non-alcoholic beverages, supply of water, medicines, hotel accommodation and restaurants. The reduced VAT rate was 8% in 2001, 8.5% in 2002 and to 9.5% in 2013. The reduced VAT rate applies to 22 categories of goods and services, similarly to the Czech Republic, but the VAT base is narrower than in Austria, Hungary, Italy, and the Slovak Republic (Table 5.1). In 2016, tax expenditures related to the VAT reduced rate amounted to EUR 745 million (Ministry of Finance of Slovenia).

Source: OECD Tax database.
5.2. Scope exists to improve distributional outcomes of the VAT system
VAT payments as a share of disposable income are regressive, on average, as the VAT burden decreases with disposable income (Figure 5.3 Panel A). These results are driven by household savings as saving rates tend to increase with income. As a result, higher income households tend to have proportionately less of their income subject to VAT in the current year and therefore pay less VAT as a proportion of income in the current year than poorer households (OECD/KIPF, 2014[1]).
VAT payments as a share of expenditure are slightly progressive as the VAT as a share of pre-tax expenditure across income deciles shows a progressive pattern on average (Figure 5.3 Panel B). This approach removes the influence of borrowing and saving. Both Slovenia and OECD averages are slightly progressive. This occurs because higher income households tend to spend a greater share of their expenditure on standard rated goods and services rather than on reduced (or exempted) items.
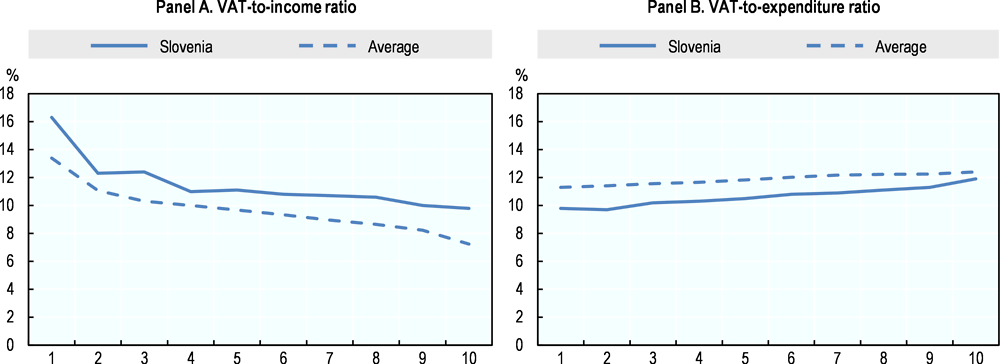
Note: The average results are a simple average for the 20 OECD countries examined in OECD/KIPF (2014).
Source: OECD/KIPF (2014[1]).
The reduced VAT rate provides significant support to richer households, but the overall effect remains progressive (Figure 5.4). While households in each decile gain from the reduced VAT rate, those in the higher income/expenditure deciles benefit more in absolute amounts. The top income decile receives a tax expenditure that is more than double (triple in the case of the top expenditure decile) that of the bottom decile. However, while these differences are large, looking at their size relative to household expenditure shows that the poor still gain proportionately more than the rich. This shows that overall reduced VAT rate do have a progressive effect in Slovenia.

Note: Solid bars present the Slovenia simple average of the household average tax expenditures across income deciles and expenditure deciles. The lines present the same results as a percentage of household expenditure.
Source: OECD/KIPF (2014[1]).
Despite being poorly targeted, reduced VAT rates have the desired progressive effect when they are introduced for the distinct purpose of supporting the poor but not necessarily in other cases:
-
Reduced rates aimed at supporting the poor (food; pharmaceutical products; water supply) have a progressive effect in Slovenia. The reduced rate on food provides the majority of support received by low-income and low-spending households. It has a progressive effect but is not well targeted at poor households, as richer households gain more from the reduced VAT rate on those goods in absolute amounts. It is similar for pharmaceutical products where the reduced rate tends to benefit the middle income/expenditure households most proportionately. Finally the aggregate tax reduction from the reduced VAT rate on water supply is relatively evenly distributed across the income/expenditure distribution. These trends are similar to what is observed on average in other OECD countries.
-
Reduced rates aimed at supporting cultural activities and social goods are regressive in Slovenia and the benefits for rich households are large. For books, cinema and museums, the aggregate tax expenditures increase substantially as income/expenditure increases, so as the tax expenditures received. The results for newspapers are more balanced: the reduced rate still has a regressive impact.
-
Finally reduced rates introduced for non-distributional and non-cultural purposes are also regressive in Slovenia (hotel, restaurant, air transport).
Given that redistribution is one of the prime rationales for having reduced VAT rates, Slovenia could reassess the merits of its reduced VAT rate for a range of products and services, and bring within the scope of the standard rate goods currently taxed at the reduced rate but of which the richer gain the most in relative and absolute amounts. This includes hotels, restaurants, air transport, books, newspapers, periodicals and cinema and museum tickets. Table 5.2 presents revenue gains simulations from removing some reduced VAT rates.
The imposition of the VAT increases poverty in Slovenia, but to a lesser extent than other EU countries on average (Thomas Alastair, to be published[2]). The conclusion that the VAT is generally not regressive does not mean that policymakers should not be concerned about its impact on poverty. On average in Slovenia the imposition of the VAT increases the poverty headcount (proportion of the population that are below the poverty line of 50% of median disposable income) by 2.7 percentage points, from 4.2% to 6.9%. This increase is below the OECD average increase (3.1 percentage points) and Slovenia remains one of the countries with the lowest poverty headcount based on net expenditure. Same trends are observed when looking at poverty gap (how much additional expenditure on average is needed to move the poor out of poverty) and poverty severity (taking into account the degree of inequality among the poor).
5.3. Excise duties can play a bigger role in financing the health system
Revenues from excise duties in Slovenia are high. In 2017, excise duties represent almost 10% of tax revenues (Ministry of Finance, 2018[3]) which ranks Slovenia among the countries with the greatest reliance on such taxes (Figure 5.5). The share of excise duties in taxation has progressively increased in recent years. In 2012, the specific excise duties were increased for cigarettes and fine tune tobacco (but the ad valorem excise rate decreased) (Krasovsky and Tesche, 2016[4]). In 2014, excise duties on alcohol and alcoholic beverages were raised by 10% and 5% for all tobacco products. However, the excise duties on cigarettes and alcoholic beverages in Slovenia remain low in comparison to other countries (Figure 5.6 Panels A and B). In contrast, excise duties on energy products are somewhat higher by international standards (Figure 5.6 Panels C and D) although the effective tax rates on gasoline for road use, for instance, remains in the range of the effective tax rates that can be found in other OECD countries (Figure 5.7). Nevertheless, excise duties on energy products collect a significant amount of tax revenues because of the important international transit traffic going through the country.

Source: OECD Revenues Statistics database.
Some OECD countries partly finance the public contribution to health care from excise duties on alcohol and tobacco (i.e. so-called sin taxes) (OECD, 2015[5]). To some extent, there is a good case for such an approach. Excise duties on alcohol and tobacco internalise some of the costs which the consumption of alcohol and tobacco imposes on society, in particular in terms of extra health expenditure that can be linked to their consumption. There are also other external costs, such as reduced labour market productivity including sick leave, which can be attributed to alcohol and tobacco consumption, although these costs are not necessarily borne by the health system but rather by employers. However strong arguments exist against earmarking of tax revenues. A significant concern is that it reduces flexibility in government budgeting. For example, if more revenue is raised in a particular year from an earmarked tax than is necessary for the related expenditure, the excess revenue cannot be used to address budget shortfalls elsewhere or to finance other budget priorities. While revenues of excise duties on alcohol and tobacco should continue to feed into the general budget, government could consider sharing (part of) its revenues with the Health Insurance Institute of Slovenia (HIIS), if such an approach would be necessary to put the financing of the HIIS on a solid footing in the future.
Excise duties on alcohol and tobacco need to be aligned with the excise duties that are levied in neighbouring countries as too high rates will result in cross-border shopping and smuggling. Recent experience with increases in excise duties in Slovenia have shown that setting rates too high may even lower the revenues collected from excise duties. Slovenia may further increase its excise duties on alcohol and tobacco in particular when neighbouring countries follow the same path.

Source: OECD Consumption tax trends.

Source: OECD (2018[6]).
5.4. Main recommendations
-
Maintain the 22% standard VAT rate
-
Broaden the VAT base
-
Bring within the scope of the standard rate goods currently taxed at the reduced VAT rate but of which the richer gain the most in relative and absolute amounts (such as hotel accommodation, restaurant food, books, admission to shows, newspapers and periodicals, passenger transport)
-
-
Increase excise duties on alcohol and tobacco, in particular when neighbouring countries increase their rates further
References
[4] Krasovsky, K. and J. Tesche (2016), “Tobacco taxation policy in Slovenia”, http://www.euro.who.int/__data/assets/pdf_file/0011/329708/Tobacco-taxation-policy-Slovenia.pdf?ua=1 (accessed on 11 April 2018).
[3] Ministry of Finance (2018), Bulletin of Government Finance, http://www.mf.gov.si/fileadmin/mf.gov.si/pageuploads/tekgib/Bilten_javnih_financ/January_2018.pdf.
[5] OECD (2015), Fiscal Sustainability of Health Systems: Bridging Health and Finance Perspectives, OECD Publishing, Paris, https://doi.org/10.1787/9789264233386-en.
[1] OECD/KIPF (2014), The Distributional Effects of Consumption Taxes in OECD Countries, OECD Tax Policy Studies, No. 22, OECD Publishing, Paris, https://doi.org/10.1787/9789264224520-en.
[2] Thomas Alastair (forthcoming), Distributional effects of the VAT in OECD countries - Update and extension, OECD.