Chapter 1. Setting the scene for tax reform in Slovenia
Slovenia enters the fifth year of economic recovery. The government has closed the budget deficit and reduced public debt. Slovenia continues to face major challenges: public debt is high, the population is ageing, labour market participation rates are low for old and young workers, long-term unemployment is high, and labour productivity is low. Without reform, the government will have to raise more tax revenues to face the rising costs of ageing, and to maintain the generous transfers system. Population ageing will not only increase public spending but, in the absence of reform, will also put tax revenues under pressure. Reforms should be considered in the context of a tax level which is above the OECD average and a tax mix which relies heavily on distortive taxes on labour. Improving the design of the tax system will also need to reform the financing of local municipalities.
1.1. After a double dip crisis Slovenia’s economy is recovering but the country continues to face major economic challenges
The international financial crisis (2008-09) followed by the Slovenian banking crisis (2013) weakened the economy but growth has now recovered. In 2018 Slovenia enters the fifth consecutive year of steady economic recovery. The growth rate was 3.1% in 2016 and 5% in 2017 (Eurostat) which contrasts with the negative growth in 2012 (-2.7%) and 2013 (-1.1%). Initially, the recovery was led by exports, but it is increasingly being supported by stronger private domestic demand underpinned by real income growth, stronger employment and rising consumer confidence (OECD, 2017[1]).
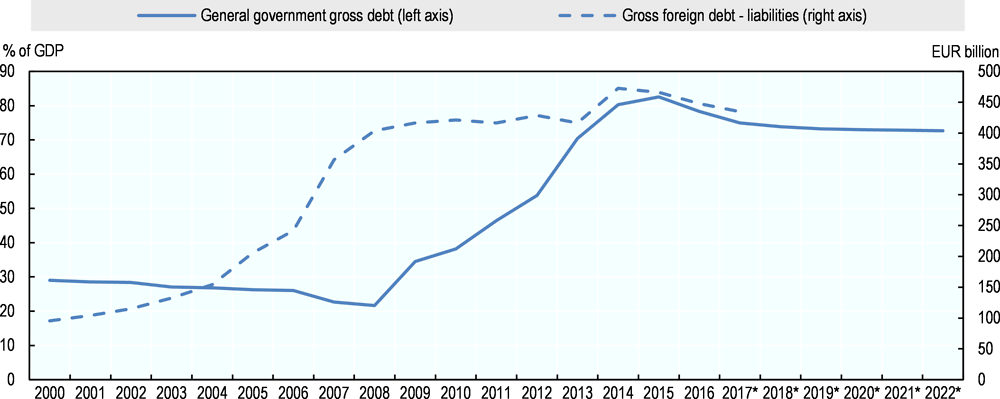
The budget deficit and the debt-to-GDP ratio have decreased since 2014. In 2017 the general government budget registered a small surplus (Ministry of Finance, 2018[2]), and Slovenia exited the European Commission’s excessive deficit procedure (Figure 1.1). A budget surplus is also expected in 2018. The debt-to-GDP ratio has quadrupled from 22% in 2008 to more than 82% of GDP in 2015, in part as a result of the banking sector bail-out in 2013, and the 2006-07 tax reform, which was not revenue neutral (Figure 1.2). More recently, the government has managed to narrow the budget deficit and the level of public debt has been falling since 2016. Privatisation has also reduced contingent liabilities1 somewhat, although state-ownership remains at an internationally high level (Ministry of Finance). The debt-to-GDP ratio had decreased by 9 percentage points from 2015 to 2017 (to 73.6% of GDP). According to the International Monetary Fund projections, public debt is expected to reach 77% of GDP in 2018 (IMF, 2017[3]). The government’s objectives for 2020 are to eliminate the structural budget deficit and to have a debt-to-GDP ratio close to 60%.
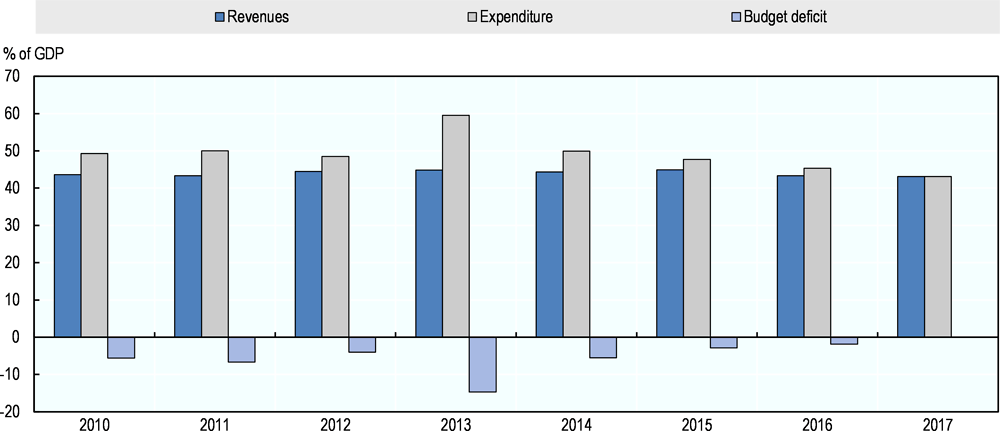
Source: Statistical office of Slovenia.
Note: * are estimates.
Source: IMF (2017); Ministry of Finance of Slovenia.
The ageing population will put more pressure on public spending. Since independence, the share of elderly people has increased and could represent a third of the population by 20602 (IMAD, 2016[4]). In 2015 the dependency ratio of older people is 27.8% of the working-age population. According to the main scenario of the EUROPOP2013, the proportion of elderly people could exceed the size of the working age population by 2060 (IMAD, 2016[4]).
The unemployment rate (6.4% in 2017) has dropped since 2013 but remains above the pre-crisis level (Figure 1.3 Panel A). Unemployment rates are relatively high for both young (13% in 2016) and old workers (6.5% in 2016). Slovenia’s unemployment trends are lower or similar to the European Union (EU) average but above OECD average. Long-term unemployment remains an issue (Figure 1.3 Panel B). Half of all jobless workers have been unemployed for more than a year (OECD, 2017[1]) and more than 40% of long-term unemployed are older than 50.
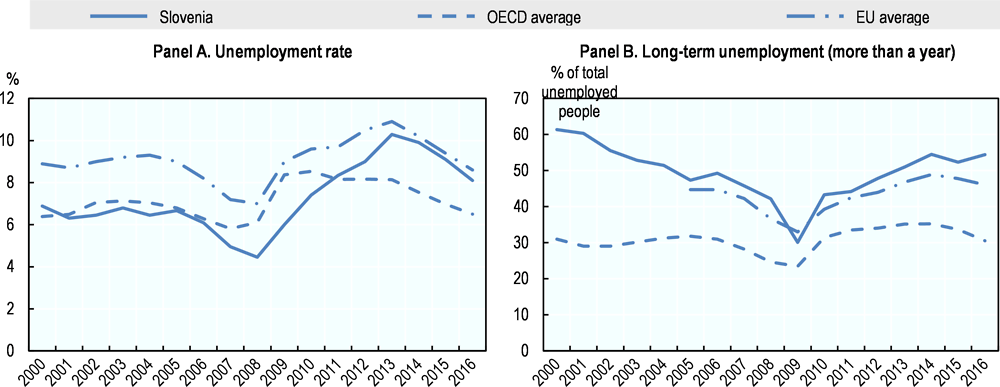
Source: OECD Labour Force Statistics database.
Slovenia lags behind more developed economies in terms of productivity. Before the global financial crisis, Slovenia experienced very strong labour productivity growth and per capita GDP growth. However, per capita GDP levels remained flat in the years after the downturn, as productivity growth slowed and labour use declined (OECD, 2017[5]). In 2015 productivity was around one fifth lower than the EU average (IMAD, 2017[6]). This reflects the impact of the crisis and the collapse of domestic demand, depressed capital investment, production factors misallocation in addition to significant regulatory and competition barriers.
1.2. Disposable income inequality is low
Market income inequality has increased in Slovenia, following international trends. The Gini coefficient for market income (before taxes and transfers) increased to 0.46 in 2015, up from 0.42 in 2008. Market income inequality in Slovenia is higher than in Poland, Hungary or the Slovak Republic, but lower than in Austria, Germany, and Italy (Figure 1.4).
Generous tax provisions and benefits lower inequality considerably. Benefits and tax reliefs for dependent children, students and low income households lower inequality. The Gini coefficient for disposable income (i.e. after taxes and transfers) fluctuates around 0.25 which places Slovenia among the most equal countries in the OECD. This reflects both the design of the tax system and the orientation of public policy towards generous transfers which support the purchasing power of low income households.

Source: OECD Income Distribution and Poverty database.
Analysis of tax record data for 2016 reveal that over 740 000 employees earn EUR 14.6 billion in gross income and pay EUR 6.8 billion in personal income tax (PIT) and social security contributions (SSCs) (Table 1.1). Employees in the bottom decile earn 2.4% of all income and pay 0.1% of all PIT and 2.0% of all PIT and SSCs combined. Those in the top decile earn 27% of all gross income in 2016 (approximately the same percentage as in deciles 1 to 5 combined), and contribute to 44% of PIT and 30% of all PIT and SSCs combined. Employees in the top 1% earn 6.5% of all income and contribute to 13% of all PIT and 7% of all PIT and SSCs.
Concentration measures suggest a relatively equal income distribution in Slovenia. The gross income earned by the top 20% of employees is 5.7 times greater than the gross income earned by the bottom 20%, as shown by the S80/S20 quintile share in Table 1.1. Similarly, the S90/S10 inter-decile range shows that gross incomes earned by the top 10% are 11.3 times greater than those earned by the bottom 10%. For disposable incomes, the two ratios are smaller at 4.6 and 8.8 respectively.
The distribution of disposable income in Slovenia is more equal than in many other European countries. According to the results of the OECD Income Distribution and Poverty database, which is based on survey data in contrast to the tax return data which is at the core of the analysis in this report3, the S80/20 ratio of disposable incomes in Slovenia is 3.7, which is similar to the Slovak Republic and the Czech Republic. However, S80/20 ratios are higher in Austria, Germany, Hungary, Italy and Poland.
Transfers reduce poverty but the share of the population with a risk of falling into poverty remains high. 24.3% of the population is at-risk-of-poverty before transfers in 2016 in Slovenia, similarly to the EU average (25.9%) (Eurostat). The share of population at-risk-of-poverty after transfers is reduced to 13.9% (17.3% for the EU average). However the elderly remain the most vulnerable population: the at-risk-of-poverty rate for people over 65 years old is above the EU average before and after social transfers (including pensions). Almost 14% of them are at a persistent risk of poverty, which is among the highest in the EU.
1.3. The tax-to-GDP ratio is relatively high and the tax mix is unbalanced
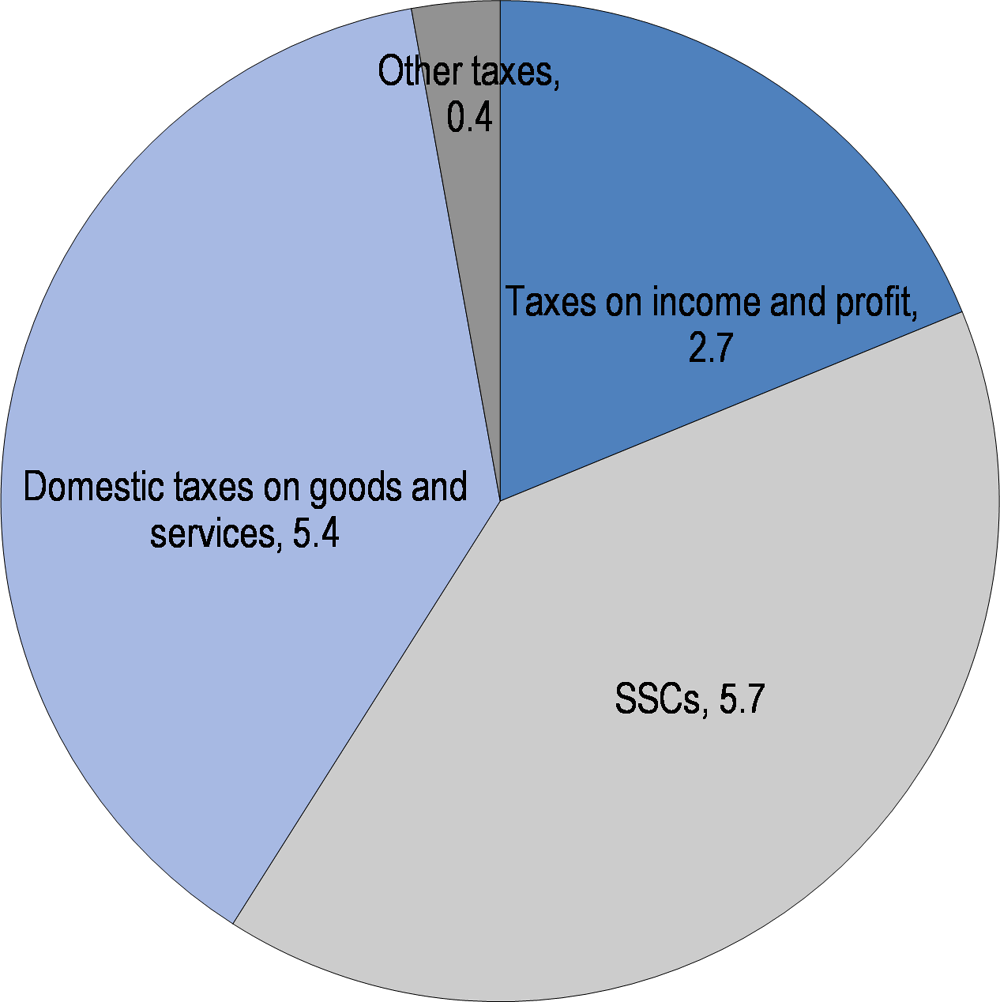
The tax-to-GDP ratio reached 37.0% in 2016, higher than the OECD average (at 34.3% of GDP) but lower than the EU average (at 40% of GDP) (Figure 1.5). Without SSCs, taxes represent 22.1% of GDP (Ministry of Finance, 2018[7]), which is lower than the OECD (25.1% in 2014) and the EU averages (26.9% in 2015) (OECD, 2016[8]) (European Union, 2017[9]). After a slight decrease in the years following independence, the tax-to-GDP ratio has remained relatively constant over time. In 2016, EUR 14.2 billion were levied in tax (35.2% of GDP) (Figure 1.6).
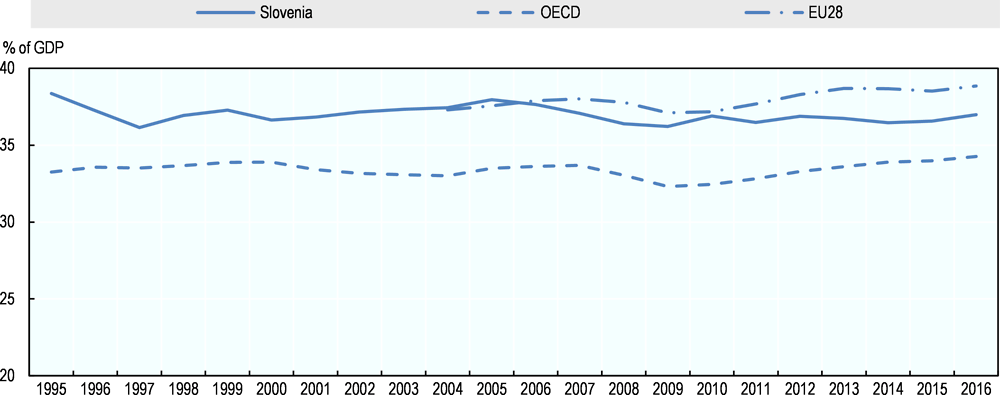
Source: OECD Revenues Statistics database.
Source: Ministry of Finance (2018[7]).
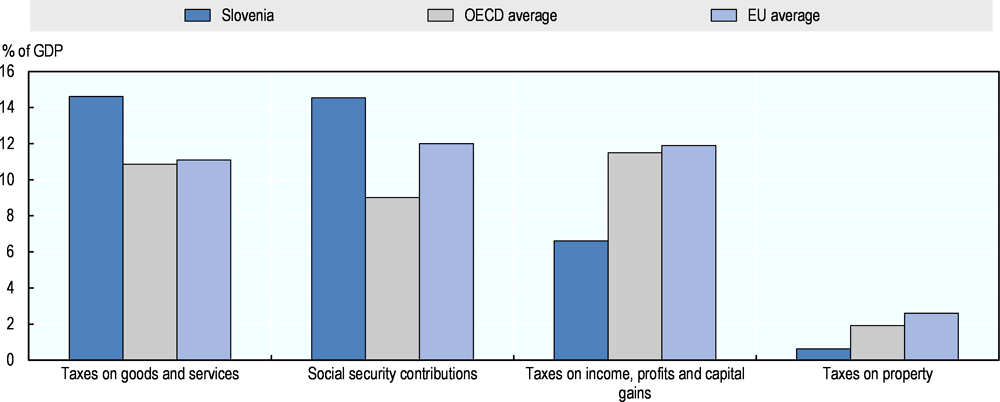
Slovenia’s tax mix diverges from the OECD average (Figure 1.7). Slovenia’s tax structure is tilted towards consumption taxes (14.6% of GDP in 2015) and SSCs (14.5% of GDP) above OECD averages (10.9% and 9% respectively) and EU averages (11.1% and 12%). Taxes on income, profits and capital gains (both of individuals and corporates) represent 6.6% of GDP (below the OECD average of 11.5%). Immovable property taxation stands at 0.6% of GDP in 2016 (1.9% for OECD countries on average). Slovenia levies high environmentally-related tax revenues (4% of GDP in 2016 compared to 1.6% in OECD countries on average in 2014). Over time Slovenia started relying progressively more on taxing goods and services, and less on taxing income, profit and capital gains. This contrasts with OECD countries that experienced an increase in income, profit and capital gains taxation since 2008.
Slovenia’s tax mix may be harmful for economic growth. Taxes can be grouped based on their potentially distortive effects on growth (OECD, 2010[10]). Less distortive taxes include consumption taxes (which are high in Slovenia), recurrent taxes on immovable property and inheritance taxes (which are low), while the corporate income tax (CIT), PIT, SSCs, and taxes on financial and capital transactions tend to be more harmful for economic growth. In Slovenia, the sum of the more distortive taxes accounts for 60% of total tax revenues in 2016.
Note: 2015 data.
Source: OECD Revenues Statistics database; European Union (2017[9]).
1.4. Government expenditure have declined but ageing-related costs might reverse this trend
Since 2010 public spending has been progressively reduced as a share of GDP. In 2010, public expenditure accounted for 46% of GDP (Figure 1.8). Public spending has been reduced to 41% of GDP in 2016 as a result of consolidation efforts, lower interest payments on public debt and less public investment (OECD, 2017[1]).
Pensions constitute the main item of government spending. Pensions amounted to 26% of total public spending in 2016 (24% in 2010), followed by salaries and social security contributions (23%), and expenditures on goods and services (14%) (Ministry of Finance, 2018[2]).
Public expenditure is expected to rise to 9% of GDP by 2050 due to the ageing population (Figure 1.9). The share of people aged 65 years and above will reach 33% by 2050 (Figure 1.11). Pensions could increase by up to 15.6% of GDP by 2050 (11.8% in 2015). Health public expenditures are forecast to reach 9.4% of GDP (5.2% in 2015) while long-term care is expected to reach 1.9% of GDP (0.9% in 2015). The ageing of the population will not only increase public spending but it will also put tax revenues under pressure, as described in Box 1.1.

Note: Other: payments to the EU budget, capital transfers, capital expenditures, other current transfers and subsidies.
Source: Ministry of Finance (2018[2]).
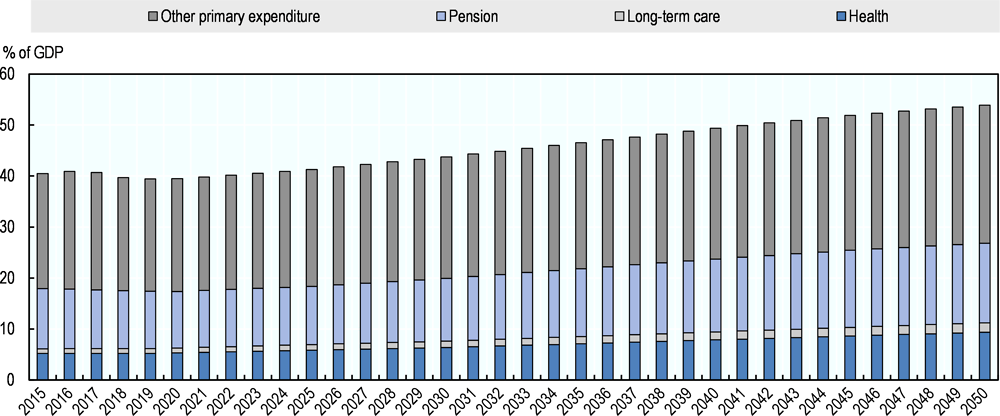
Source: Forthcoming work on Slovenia; De la Maisonneuve and Oliveira-Martins (2013) (for health and long-term care); OECD (2017 [11]) (for pensions).
The working age population currently pays the vast majority of PIT and SSCs in Slovenia. Therefore, the projected decline in this cohort, alongside a rise in older workers will have significant negative consequences for the revenues raised from PIT and SSCs in the coming decades.
The Slovenian old-age dependency ratio is set to rise sharply from 18.7% in 2016 to 25.2% in 2030 and 28.3% in 2040 (European Commission, 2017[9]). Over the same period, there is an expected decline in the working age population from 66.4% in 2016 to 61.0% in 2030 and 58.2% in 2040. Among the taxpaying population, those of working age pay 97% of all PIT, 99% of all employee SSCs and 90% of all employer SSCs (the small amounts of PIT and SSC remaining are paid by those aged over 65).
By applying the projected population changes by age group (in percentage points) to the number of taxpayers in the same age groups in the taxpayer population it is possible to estimate the PIT and SSC loss associated with ageing over the period. This assumes that population changes will correspond to the taxpaying population, that average PIT and SSCs by age group remain constant over the period and stable population growth to 2030. According to the analysis, the PIT could fall by over 9% and employer and employee SSCs by over 6% and 11% respectively by 2040 (Figure 1.10). These Exchequer declines represent 1.6% of GDP.
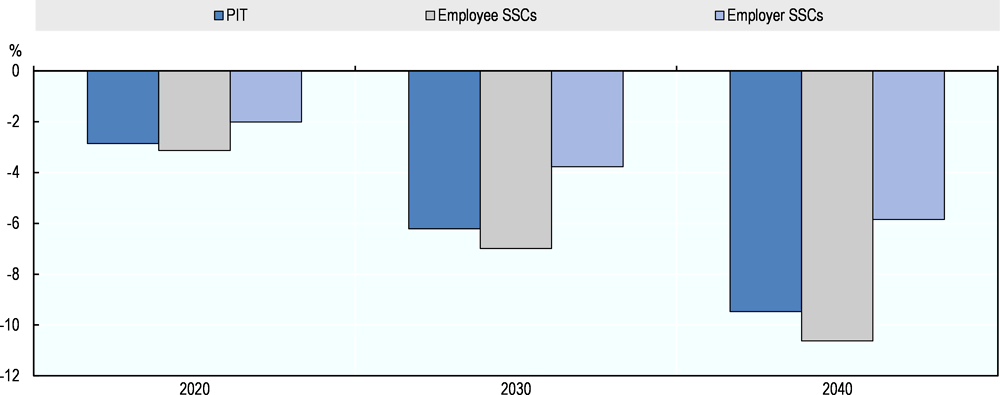
Note: The European Commission 2018 Ageing Report projects that those aged 0 – 14, 15 – 64 and 65 and over will change (in percentage points) between 2016 and 2040 by -1.3%, -8.2% and 9.6%. Note that total PIT and SSCs in microdata do not match exactly to PIT and SSCs reported by the Ministry of Finance of Slovenia. Methodological information on the microdata is available in the annex.
Source: Authors’ calculations based on Ministry of Finance of Slovenia tax records microdata; European Commission (2017[12]).

Source: OECD (2017[13]); Eurostat.

Note: Figures for 2020-2050 are projections based on the medium-fertility assumption (total fertility in all countries is assumed to converge eventually toward a level of 1.85 children per woman).
Source: United Nations database (World Population Prospects: The 2017 Revision).
1.5. Local governments rely on revenues from the personal income tax and property taxes
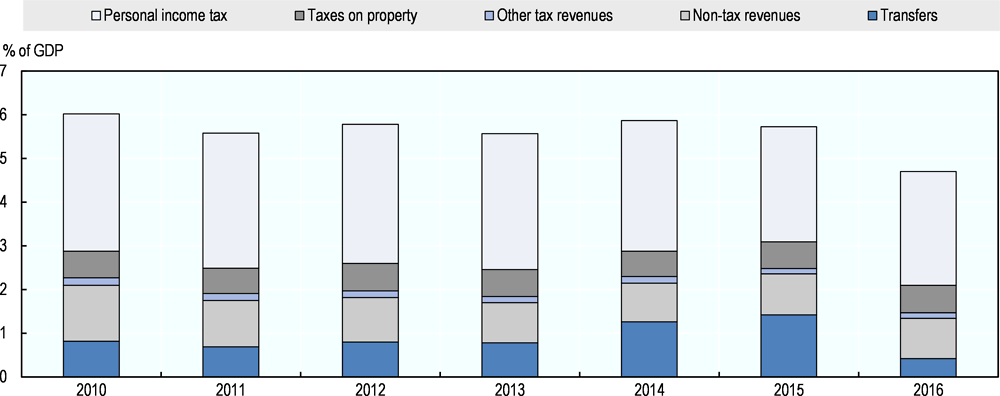
Municipalities rely heavily on tax revenues for financing. Tax revenues constitute 71% of the total revenues for local governments. Revenues from the central government’s PIT are shared with local governments. The Financing of Municipalities Act stipulates that 54% of PIT revenues collected by central government are shared with municipalities. Property tax revenues constitute 13.5% of total local revenues (Figure 1.13), which is low in international comparison. Other local tax revenues include revenues from certain taxes on goods and services and from the inheritance and gifts tax, a tax on real estate trading, the local tourist tax and a gambling tax (Ministry of Finance, 2018[2]). Non-tax revenues including local contributions, fees, fines, concession fees, revenues from assets and grants constitute 20% of local tax revenues.
Equalisation transfers to local government amount to 8.9% of total local revenues in 2016 (Ministry of Finance, 2018[2]). Municipal financing is based upon the principles of “adequate spending” and “adequate funding” (OECD, 2011[14]). The level of “adequate spending” is estimated every year through a formula which takes into account the functions devolved to municipalities and a number of demographic, geographic and development criteria, which vary across municipalities. The “adequate funding” principle aims at matching the financial resources of municipalities with the level of “adequate spending”. Each year, the Ministry of Finance determines the exact amount of PIT revenues that will be shared with each municipality, where the total amount that is shared equals 54% of total PIT revenues. If revenues from the share of PIT and own taxes are not sufficient to cover a municipality’s spending needs, the municipality can request additional funds from the central government in the form of equalisation transfers.
Revenues from local governments have dropped significantly from 6% of GDP in 2010 to 4.7% in 2016. There are two main explanations for this. First, the significant reduction in PIT revenues for municipalities in 2016 is a result of the drop in central government PIT revenues after the economic crisis; there is a two year gap between the collection of PIT revenues by central government and the sharing of those revenues with the municipalities. As a result, the impact of the crisis on municipalities has been delayed. Second, there has been a reduction in the transfers received from the European Cohesion Fund (Ministry of Finance).
Source: Ministry of Finance (2018[2]).
1.6. Slovenia faces a window of opportunity for a comprehensive tax reform
There is momentum for a fundamental tax reform in Slovenia. The business cycle was impacted by the 2008 and 2013 crisis, with the output gap4 falling to -5.5% of potential GDP in 2013 (OECD, 2017[1]) (IMF, 2017[3]). Slovenia is currently closing the output gap, (Ministry of Finance). With the annual growth rate expected to gradually converge to 1¾–2%, Slovenia could take advantage of this period of favourable economic growth to undertake tax reform.
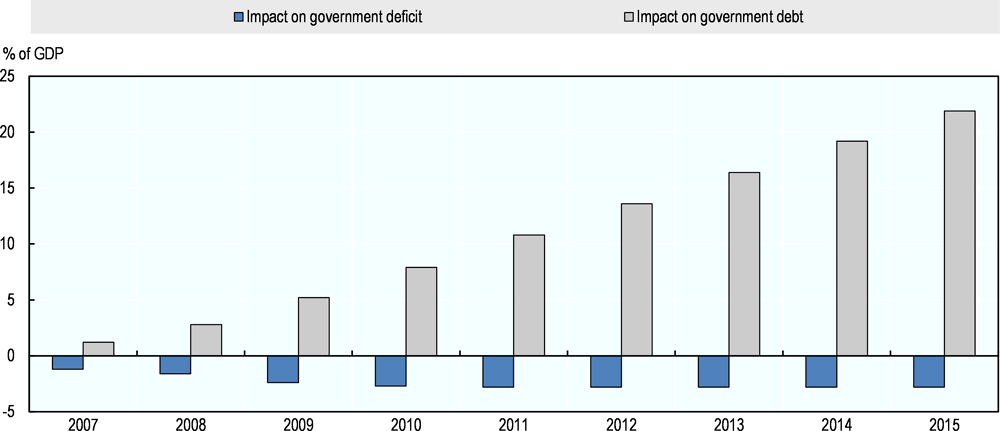
A comprehensive tax reform will have to be (at least) revenue neutral and be aligned with the country’s fiscal rule. Over the past two decades, Slovenia has undertaken a number of extensive reforms. Box 1.2 describes the most recent tax reforms in more details. Some of these reforms – in particular the comprehensive reform in 2006-07 – were not fully funded, creating significant budget deficits. The 2006-07 tax reform reduced the number of PIT brackets from 5 to 3, reduced the top PIT rate and increased the general tax allowance. The payroll tax was gradually abolished and the CIT rate was gradually reduced. The 2006-07 tax reform lowered tax revenues, resulting in an increased budget deficit and government debt (Figure 1.14).
Source: Ministry of Finance of Slovenia.
The upswing in economic activity and growth should be used to lower public debt. Compliance with both the national fiscal rule (balanced government budget in the medium-term, without long-term borrowing), and the medium-term objective of the EU fiscal framework (surplus of 0.25% of GDP5) should remain as priorities. The European Commission has recently noted that Slovenia’s medium-term objective is not planned to be achieved by 2021, which indicates that Slovenia might have to increase its tax revenues (European Commission, 2018[15]).
2005
-
After debate, decision not to implement a flat personal income tax at a rate of 20% on taxable income net of a basic tax allowance
-
Adoption of a dual income tax system with the introduction of schedular taxation of interest, dividends and capital gains at a single rate of 20% (with effect as of 1st January 2006)
-
Replacement of the grossing up mechanism used to calculate the PIT on pensions by a special pensioner allowance (tax credit)
-
Progressive tax schedule with 5 tax brackets with marginal tax rates ranging from 16% to 50%
-
Gradual abolition of the payroll tax (with effect as of 1st January 2006, and a phase out on 31st December 2008)
2007
-
Gradual reduction of the CIT rate (from 25% in 2006 to 23% in year 2007, 22% in year 2008, 21% in year 2009 and 20% in year 2010 and beyond)
-
Changes in the tax schedule for non-capital income: from 5 to 3 tax brackets (16%; 27%; 41%) with a decrease in the highest marginal tax rate from 50% to 41%
-
Increase of the general tax allowance
-
Introduction of the additional general tax allowance depending on individual income (2008)
-
Increase in the general tax allowance for taxpayers with the lowest income (2010)
2012
-
Reintroduction of the 50% PIT rate (as a temporary measure with effect as of 1st January 2013)
-
Reduction of the student personal allowance from EUR 3 228 to EUR 2 477 (with effect as of 1st January 2013)
-
Increase in the tax rate on interest; dividends and capital gains from 20% to 25% (with effect as of 1st January 2013)
-
Introduction of the schedular taxation for rental income with the rate 25% after 10% standardised cost (with effect as of 1st January 2013)
-
Introduction of the flat-tax scheme for self-employed and unincorporated business with revenues of up to EUR 50 000 with effect as of 1st January 2013 (extended in 2014 with effect as of 1st January 2015); the same regime was also introduced for micro businesses
-
Gradual decrease of the statutory CIT rate: from 20% to 18% in 2012, 17% in 2013, 16% in 2014 and 15% in 2015. However the CIT rate remained 17% from 2013 to 2016)
-
Increase of the standard VAT rate by 2 percentage points (to 22%), and the reduced VAT rate by 1 percentage point (to 9.5%) (on 1st of July 2013)
2014 (taking effect as of 1st January 2015)
-
Increase of the taxes on insurance premiums and financial services by 2 percentage points (to 8.5%)
-
Introduction of SSCs for students (2015): both employee and employer SSCs for pension and disability insurance (8.85% and 15.5%), employer SSCs for health (6.36%) and employer SSCs for injury at work (0.53%).
2016 (taking effect as of 1st January 2017)
-
Increase in the CIT rate from 17% to 19%
-
PIT schedule
-
Introduction of an additional tax bracket (34%) for income between EUR 20 400 and EUR 48 000;
-
Lowering of the second highest tax rate (from 41% to 39%) for income between EUR 48 000 to EUR 70 907;
-
Reinstatement of the 50% PIT rate as a permanent measure.
-
-
Increase in the additional general allowance threshold for low wage earners just above the minimum wage (from EUR 10 866 to EUR 11 166)
-
Reduction of the taxation on performance bonuses (13th salary): up to 70% of the average wage is exempt from the income tax (up to 100% in 2017) with effect as of 1st of January 2018)
-
Introduction of the Act on fiscal validation of receipts
2017 (taking effect as of 1st January 2018)
-
Additional general allowance: introduction of a linearly determined additional general tax relief for incomes between EUR 11 166.67 and EUR 13 316.83
-
Introduction of a special tax scheme for income from employment of posted employees abroad
-
Introduction of anti-avoidance provisions in the flat-tax scheme for the self-employed and micro business (absolute limits to expenses, rule that prevents companies from splitting-up to stay under the flat rate threshold, etc.)
-
Increase in the special personal tax allowance for the income from students' work from 70% to 100% of the general allowance.
References
[12] European Commission (2017), The 2018 Ageing Report, https://ec.europa.eu/info/sites/info/files/economy-finance/ip065_en.pdf (accessed on 11 May 2018).
[9] European Union (2017), Taxation trends in the European Union, https://doi.org/10.2778/30295.
[15] European Commission (2018), Commission staff working document, https://ec.europa.eu/info/sites/info/files/2018-european-semester-country-report-slovenia-en.pdf (accessed on 25 May 2018).
[4] IMAD (2016), “Demographic change and its economic and social consequences”, http://www.umar.gov.si/fileadmin/user_upload/publikacije/kratke_analize/Demographic_change_IMAD_May_2016.pdf (accessed on 28 February 2018).
[6] IMAD (2017), Economic Issues, http://www.umar.gov.si/fileadmin/user_upload/publikacije/izzivi/2017/EI-2017_angleska.pdf (accessed on 28 February 2018).
[3] IMF (2017), Republic of Slovenia : 2017 Article IV Consultation-Press Release; Staff Report; and Statement by the Executive Director for the Republic of Slovenia, IMF, https://www.imf.org/en/Publications/CR/Issues/2017/05/15/Republic-of-Slovenia-2017-Article-IV-Consultation-Press-Release-Staff-Report-and-Statement-44921 (accessed on 28 February 2018).
[2] Ministry of Finance (2018), Bulletin of Government Finance, http://www.mf.gov.si/fileadmin/mf.gov.si/pageuploads/tekgib/Bilten_javnih_financ/January_2018.pdf.
[7] Ministry of Finance (2018), Taxation in Slovenia 2018, Ministry of Finance.
[10] OECD (2010), Tax Policy Reform and Economic Growth, OECD Tax Policy Studies, No. 20, OECD Publishing, Paris, https://doi.org/10.1787/9789264091085-en.
[14] OECD (2011), OECD Territorial Reviews: Slovenia 2011, OECD Publishing, Paris, https://doi.org/10.1787/9789264120587-en.
[8] OECD (2016), Revenue Statistics 2016, OECD Publishing, Paris, https://doi.org/10.1787/rev_stats-2016-en-fr.
[1] OECD (2017), OECD Economic Surveys: Slovenia 2017, OECD Publishing, Paris, https://doi.org/10.1787/eco_surveys-svn-2017-en.
[5] OECD (2017), OECD Skills Strategy Diagnostic Report: Slovenia 2017, OECD Publishing, Paris, https://doi.org/10.1787/9789264287709-en.
[11] OECD (2017), Pensions at a Glance 2017: OECD and G20 Indicators, OECD Publishing, Paris, https://doi.org/10.1787/pension_glance-2017-en.
Notes
← 1. Fiscal obligations contingent on the occurrence of particular events. These obligations are not budgeted and accounted for, nor are they considered in conventional fiscal analysis.
← 2. According to the main scenario of the EUROPOP2013 (projection made by Eurostat in collaboration with national statistical offices).
← 3. Important differences between survey and tax return data exist; for example, survey data is less representative at the top of the income distribution in part due to under-reporting of income, while tax return data is typically less representative at the bottom of the income distribution as it does not fully capture taxpayers who receive benefits, inter-alia.
← 4. The output gap refers to the difference between actual and potential gross domestic product as a percentage of potential GDP.
← 5. The medium-term objective corresponds to a balanced budget to be achieved in 2020, within the stability programme horizon.