Chapter 1. Skill imbalances in Australia
Global trends like rapid technological change, increased globalisation, and demographic developments, are transforming the nature of work and the demand and supply of skills in particular. These trends have already contributed to a change in the skill profile of employment across OECD countries, and these changes are expected to continue. In this context, there is a critical need to assess current skill needs and to anticipate future skill needs.
This chapter provides an overview of skill imbalances in Australia by focusing on skill mismatches and skill shortages. It discusses the cost of skill imbalances to individuals, firms and the economy as a whole; and sets the scene for a discussion about how skill assessment and anticipation (SAA) exercises can be powerful tools in responding to them.
The skills and jobs in demand in the workplace have altered considerably in recent decades as a result of major global trends: rapid technological innovation, increased globalisation, and ageing populations, among others. These trends have led to the emergence and expansion of some sectors and occupations at the same time as others have contracted. Even within existing occupations the tasks performed by workers and the skills needed to perform them have undergone significant change. These changes contribute to imbalances between the demand and supply of skills. While some degree of skill imbalances is expected in any dynamic economy, persistent imbalances in skills can be costly for individuals, firms and the aggregate economy.
To understand skill imbalances, and to devise appropriate policy responses, high-quality information about the needs of the labour market is needed. This chapter reviews the evidence on current skills imbalances in Australia, and sets the scene for a discussion about how skill assessment and anticipation (SAA) exercises can be powerful tools to respond to them.
Note that for most of this report, the term “skills” is used in a wide sense (i.e. to include qualifications, fields of study, and cognitive and non-cognitive abilities). However, in certain parts of the report, a distinction will be made between “skills” in this wider sense and “skills” in a narrower sense, i.e. to refer to the set of competences mobilised to perform the tasks related to a job. For example, this distinction will be made in Chapter 2 to frame the recommendation that Australia develop better proxies to measure skill needs, since most of the country’s available intelligence around skill needs focuses on qualifications and occupations, rather than skills, per se.
Despite the key role that skills play in the labour market, there is little agreement as to how to define the concept. The term “skill” can refer to general cognitive and non-cognitive abilities (e.g. information-processing skills, teamwork, and problem-solving) as well as to knowledge and abilities that are specific to a particular job, occupation or sector (e.g. accounting or hair colouring) (Becker, 1962[1]). In practice, the terms skills, knowledge, abilities, competences, and education are often used interchangeably.
Source: Adapted from OECD (2017) Getting Skills Right: Skills for Jobs Indicators.
1.1. Main Findings
-
Evidence from international analyses, as well as the Department of Jobs and Small Business’ research agree that skill shortages are currently low in Australia relative to the historic trend, and on par with the global average. Similarly, the OECD Skills for Jobs database finds that while several types of skills are in shortage in Australia, the intensity of the shortages of most skills is relatively low.
-
According to the Skills for Jobs database, the most acute shortages are in knowledge of education and training, health services and mathematics and sciences. Apart from knowledge of manufacturing and production, and physical abilities like fine manipulative abilities, control movement, and physical strength, relatively few skills are in surplus. This profile of skills in shortage and surplus in Australia largely reflects global trends, like the rapid development of new technologies.
-
Over-qualification is higher in Australia compared to the OECD average (20% versus 17%), with vocational education and training (VET) graduates better matched to their jobs than graduates from higher education. To some extent, qualification mismatch in Australia is only apparent, as most workers who are over-qualified to their jobs are well-matched in terms of literacy skills. This discrepancy illustrates the low capacity of qualifications to accurately signal the quality of skills acquired.
-
While field-of-study mismatch is on par with the OECD average (33% versus 32%), the overlap between field-of-study and qualification mismatch is relatively high (40% versus 33%). To the extent that these workers must downgrade to a job that requires a lower level of qualification, they could face wage penalties of up to 20% relative to those who are well-matched.
-
Skill imbalances entail large costs for individuals, firms and the aggregate economy in terms of lower wages, lower job satisfaction, increased employee turnover, and lower productivity. Skill shortages are particularly costly for small and medium-sized enterprises, which make up 70% of employment in Australia. Gaps between the skills that job seekers have and those that employers are looking for also contribute to persistent and elevated unemployment.
-
Existing skill imbalances in Australia have both demand-side and supply-side influences. On the demand side, the end of the mining boom has been coupled with an ongoing decline in the manufacturing industry, particularly in the automotive sector. Meanwhile, there has been growth in construction and the services sector, particularly in healthcare, social services and public administration, as well as professional, scientific and technical services.
-
On the supply side, rising educational attainment has occurred in tandem with a shift away from vocational education and training (VET) and towards higher education. Australian adults also have strong literacy, numeracy, and digital problem solving-skills. However, there are pockets of labour and skills which are not being used. The long-term unemployment rate has not declined since economic activity picked up, suggesting a growing divide between the skills of the unemployed and those that employers need. Furthermore, disparities in regional unemployment rates have increased. Finally, several groups are not well-represented in the labour force: prime-aged women, mature-age workers, people with disabilities and mental health conditions, as well as indigenous persons and young people not in education, employment or training (NEET).
-
Skill assessment and anticipation exercises can help policy makers to better understand skill imbalances and their causes, in order to mitigate them through policy design.
1.2. Evidence of skill imbalances in Australia
1.2.1. Skill shortages and surpluses
Skill shortages refer to a disequilibrium condition in which the demand for a specific type of skill exceeds its supply at the prevailing market wage rate (Janankar, 2009[2]). In a practical sense, though, there is no universally-applied definition of skill shortages (Shah and Burke, 2005[3]). A commonly-used method to measure skill shortages is to survey employers about their hiring difficulties, but this is inherently subjective and results depend strongly on how the question is phrased (see Box 1.2). Other options include the analysis of job vacancy data, where long vacancy periods may signal the presence of skill shortages or employer hiring difficulties. An alternative approach is to build a composite indicator from a range of quantitative data sources (e.g. wage dynamics, unemployment growth, employment growth). A new OECD database, the Skills for Jobs database, follows this latter approach (see Box 1.2). Skill surpluses generally receive less attention than skill shortages, and arise when the supply of certain skills is higher than the demand for those skills.
Skill shortages and skill surpluses can be costly. Skill shortages hinder firm productivity by inhibiting adoption of new technology, and by causing firms to substitute unskilled workers for skilled workers (Haskel and Martin, 1993[4]). Skill surpluses also represent a lost investment in human capital, both for individuals and for the aggregate economy, as governments usually subsidise post-school education in light of expected positive externalities, e.g. knowledge spill-overs.
Skill shortages may be particularly costly to small and medium-sized enterprises, which make up 70% of employment in Australia (Department of Industry, Innovation and Science, 2011[5]). Recent findings from a study of the Riverina, an agricultural region in Australia, suggest that productivity costs from hard-to-fill vacancies are largest for younger and smaller firms in this region (Sharma, Oczkowski and Hicks, 2016[6]). Productivity costs due to skill shortages can hamper the ability of SMEs to grow. Higher productivity costs may arise from the specific challenges that SMEs face in addressing skill shortages, including cost constraints in providing training, and difficulty competing with larger firms for highly-skilled workers. Indeed, evidence from an empirical analysis based on a sample of Australian firms finds that small firms (5-19 employees) are more likely to respond to skill shortages by extending hours for their existing workforce, while larger firms (20-199 employees) are more likely to provide on-the-job training (Healy, Mavromaras and Sloane, 2015[7]).
Evidence from international analyses, as well as the Department of Jobs and Small Business’ research agree that skill shortages are currently low in Australia relative to the historic trend, and on par with the global average. That said, several occupations in the skilled trades have been in continuous shortage over the last decade. According to the OECD Skills for Jobs database, while several types of skills, knowledge areas and abilities are in shortage, the intensity of these shortages is relatively low.
International evidence
The 2016/2017 Manpower Talent Shortage Survey found that 40% of employers globally report having difficulty filling positions, an increase from the low of 31% during the global financial crisis in 2008. At 38%, the share of Australian employers reporting difficulties filling jobs is close to the global average, but is at the lowest percentage since 2007 when 61% of employers reported difficulties. The end of the commodity boom and the associated decline in demand for skilled labour is no doubt behind the reduction in hiring difficulties. The hardest jobs to fill are in skilled trades, and these have topped the list for the last ten years. Engineers, management executives, sales representatives, and IT staff are also identified as hard-to-fill positions. According to Manpower, employers complain that positions are hard to fill because candidates have a lack of experience (23% of employers report), there is a lack of available applicants (21%), or candidates lack technical skills (20%).
The Hays Global Skills Index provides another international comparison of skill shortages in national labour markets based on a range of quantitative data. The index combines data on wage pressures in the total economy and in high-skill industries and occupations, with indicators of labour market flexibility and the degree to which the qualifications of the unemployed align with employers’ needs. As with the Manpower Survey, the Hays Global Skills Index shows an average level of skill shortage pressure for Australia compared with other countries. The accompanying analysis flagged that there is evidence of significant wage pressure in high-skill industries in Australia, and rising mismatch between the skills unemployed workers possess versus those that employers are looking for.
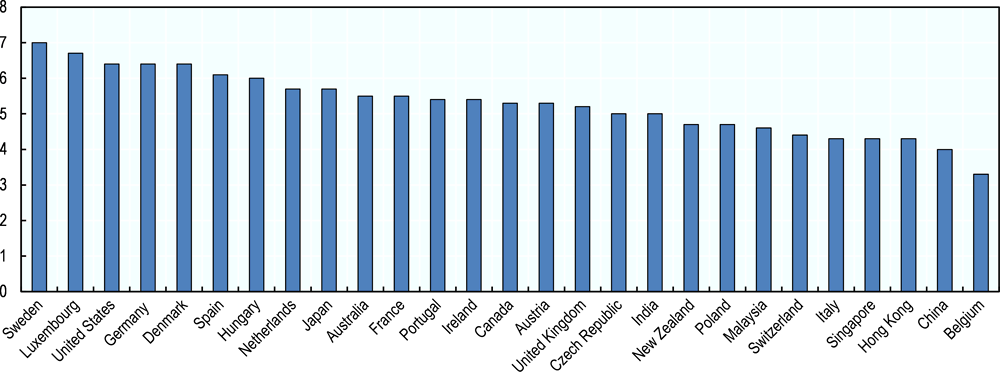
Source: The Hays Global Skills Index 2017 (www.hays-index.com).
Evidence from the Department of Jobs and Small Business’ skill shortage research
According to Australia’s official assessment (Department of Employment, 2017[8]), skill shortages were limited in 2017, although many employers reported recruitment difficulties (i.e. cases where there is an overall adequate supply of skilled workers but employers are unable to recruit suitable workers due to lack of experience, specialist skills, or mobility barriers). There were 11.1 applicants per vacancy (Figure 1.2), but 37% of vacancies went unfilled due to difficulty recruiting suitable candidates. In terms of number of occupations in shortage, the Department of Jobs and Small Business (formerly the Department of Employment) found that 46% of consistently-assessed skilled occupations1 were in national shortage in 2017, compared with 90% in 2007.2
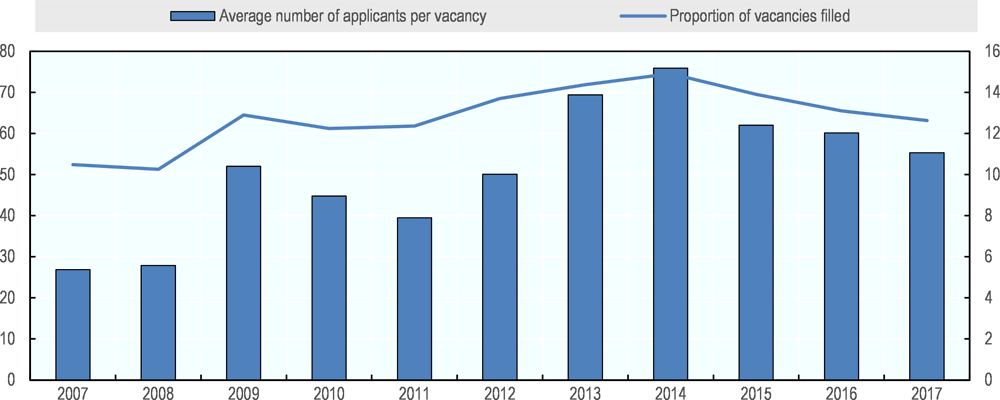
Source: Department of Jobs and Small Business (2018), “The Skilled Labour Market: A pictorial overview of trends and shortages.” Survey of Employers who have Recently Advertised.
In 2017, shortages were concentrated in technician and trades worker occupations. A number of skilled trade occupations have been in continuous national shortage over the last decade, despite the end of the commodity boom and relatively weak employment growth in these occupations relative to total employment growth. Jobs and Small Business attributes continued national shortages in the skilled trades to several factors, including low participation in VET, and relatively poor pay and working conditions in some trades occupations (Department of Employment, 2018[9]). Only a small share of applicants for skilled trade vacancies are considered suitable due to lack of experience, qualifications or skills.
Despite stronger growth in employment in professional occupations (34%) than in trades (10%) over the decade since 2007, just 13% of professional occupations were in shortage in 2017, compared with 80% in 2007. Widespread national shortages were apparent for only five professional occupations in 2017: audiologist, sonographer, veterinarian, surveyor and architect. Rising enrolment in higher education has in part contributed to softer graduate outcomes and some surplus labour activity within professional occupations.
In addition to assessing skill shortages at the national level, Jobs and Small Business also investigates differences in employer recruitment experiences for skilled occupations between states and territories, and between metropolitan and non-metropolitan regions. There are marked differences between states and territories in the share of vacancies which go unfilled (Figure 1.3, Panel A). Labour demand strengthened across the country in 2017, but the strongest demand for labour was seen in the eastern states, with elevated levels of construction activity contributing to this. Western Australia and Queensland have experienced looser conditions since the end of the mining boom. There is also variation in recruitment difficulties within states and territories. Employers in the rural and remote regions of the country tend to attract fewer applicants and fill a lower proportion of vacancies than employers in urban areas. This gap has narrowed in recent years (Figure 1.3, Panel B), likely owing at least partially to declines in labour demand in regional areas due to the end of the mining boom. In 2017, six occupations were deemed to be in shortage in rural and remote regions of the country: medical diagnostic radiographer, optometrist, hospital and retail pharmacist, physiotherapist, midwife, and radio communication technician – almost all of which are in health professions.
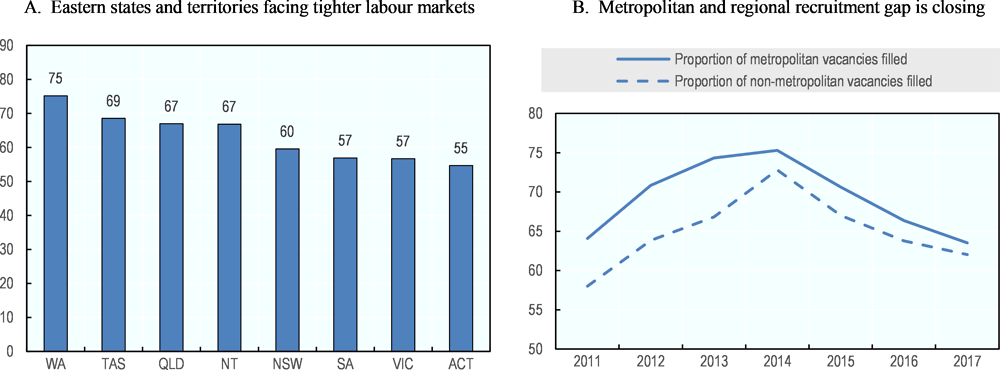
Source: Department of Jobs and Small Business (2018), “The Skilled Labour Market: A pictorial overview of trends and shortages.” Survey of Employers who have Recently Advertised.
Evidence from the OECD Skills for Jobs database
According to the OECD Skills for Jobs database (Box 1.2), many skills are in shortage in Australia, while only a few are in surplus – including knowledge of manufacturing and production, as well as physical abilities like fine manipulative abilities, control movement, and physical strength (Figure 1.5). But while several types of skills are in shortage, the intensity of the shortages of most skills is relatively low compared with other countries in the database. The most acute shortage pressure is evident in knowledge of education and training, health services and mathematics and sciences in addition to more transversal skills3 like verbal and reasoning abilities, basic process skills, systems skills and complex-problem solving skills.
Employer surveys often poll employers about their difficulty filling vacancies due to skill shortages (e.g. Manpower, Eurofound), which is a useful though imperfect measure of the degree to which skill shortages are widespread. While the employers’ perspective on skills shortages is important, it has limitations. Employers do not all interpret skill shortages in the same way, leading to inconsistency in employers’ self-reporting. Analysis shows that while many employers equate skills shortages with hard-to-fill vacancies, a substantial number do not (Green, Machin and Wilkinson, 1998[10]; Shah and Burke, 2005[3]). Some employers confuse skill gaps, i.e. the skill deficiencies of their internal workforce, with skill shortages. As a result, findings of employer surveys are often inconsistent with one another (OECD, 2017[11]).
The Skills for Jobs database, released in 2017, is an internationally-comparable index of skills in shortage and in surplus across countries. Unlike employer surveys, which can be subjective, the Skills for Jobs database relies upon quantitative information. The indicators measuring shortage and surplus are constructed using a multidimensional set of quantitative signals of skills pressure, including changes in wages, employment, unemployment, hours worked, and under-qualification (Figure 1.4).

In addition to relying on objective evidence, the Skills for Jobs database offers a portrait of which specific skills (e.g. complex problem solving, critical thinking, finger dexterity) are in demand or in surplus across countries. After first assessing shortage pressure at the occupational level (ISCO, 2-digit), a mapping from occupation to skill (using the O*NET classification) generates an assessment of shortage and surplus pressure for specific knowledge, abilities and skills. This is a departure from other international comparisons of skill shortages, which generally compare shortages across occupations, qualifications, fields of study, or by sector, but not by specific skills.
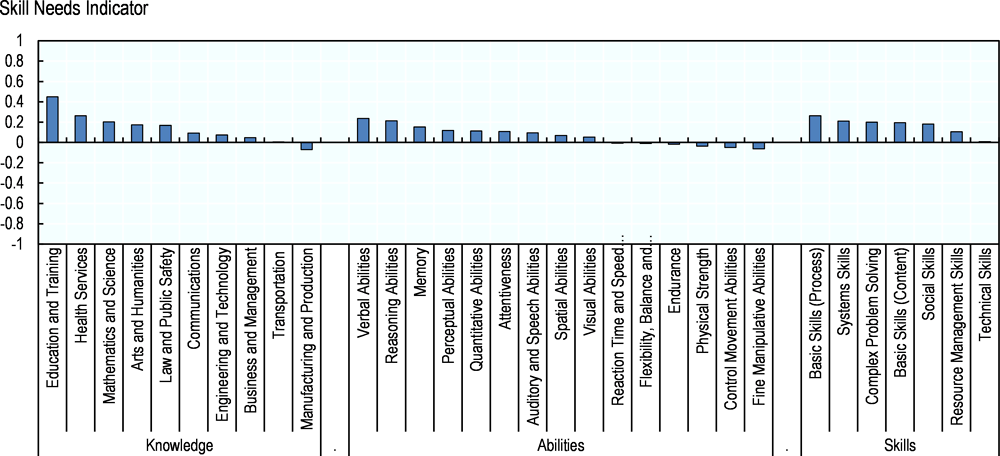
Note: Positive values indicate shortages while negative values indicate surpluses. A Skill Needs indicator value of +1 represents the maximum value across countries in the database, while a value of -1 represents the lowest value. Basic Skills (Process) refer to those skills that contribute to the more rapid acquisition of knowledge and skill across a variety of domains (e.g. critical thinking, active learning, etc.). Basic Skills (Content) refer to foundational structures needed to work with and acquire more specific skills in a variety of domains (e.g. reading comprehension, listening, writing, speaking, basic math and science).
Source: OECD Skills for Jobs database 2017.
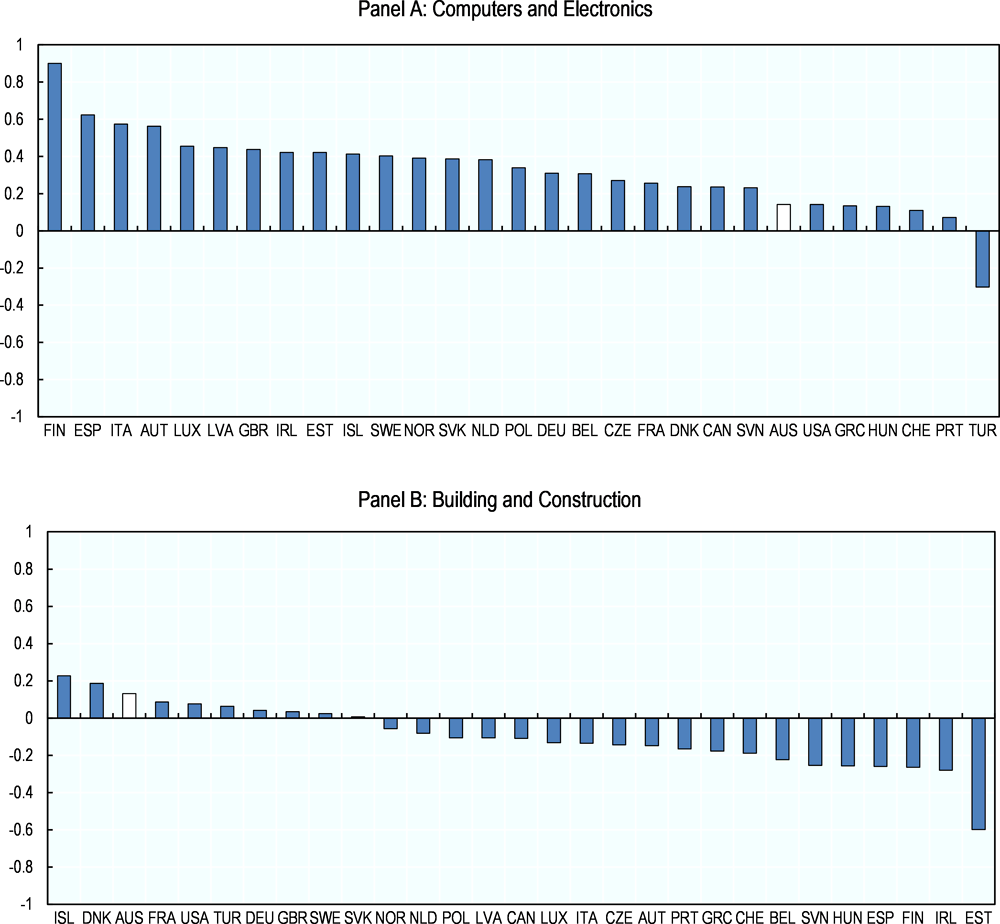
This profile of skills in shortage and surplus in Australia largely reflects global trends, like the rapid development of new technologies4 which has raised demand for skills that complement the use of these new technologies. Looking at a higher level of disaggregation than depicted in Figure 1.5, several types of technology-related knowledge are in shortage in the Skills for Jobs database across OECD countries: knowledge of computers and electronics, mathematics, physics, and engineering and technology. While these knowledge areas are also in shortage in Australia, the intensity of these shortages are smaller than in other OECD countries (see Figure 1.6, Panel A).
Shortages in technology-related knowledge are likely low in Australia due to a combination of demand- and supply-related factors. On the supply side, the OECD’s 2017 Science, Technology and Industry Scoreboard suggests that Australia has one of the lowest shares of tertiary students entering science, engineering and internet and communications technology (ICT) in the OECD area5. However, according to the PIAAC Survey of Adult Skills, Australian adults have above-average proficiency in problem-solving in technology-rich environments, with nearly 40% of Australian adults scoring in one of the top two levels. Therefore, while supply of specialised technical skills may be low, Australian adults have strong transversal skills related to the use of technology. On the demand side, the OECD’s 2017 Science, Technology and Industry scoreboard suggests that Australia performs well on some measures of technology adoption (e.g. Australia had the third highest rate of mobile penetration in the OECD in 2016), but lags behind on other indicators, including number of robots per worker, and ICT intensity of manufacturing and services jobs. Furthermore, the decline in mining activity has likely reduced the demand for engineers. Therefore, shortages in technology-related knowledge may be low due to a combination of a good supply of technology-related transversal skills, changes in industry composition, and relatively slow adoption of new technologies.
At the same time that technological progress raises demand for technology-related skills and knowledge, machines and computers change the nature of production by lowering the cost of performing routine tasks. This reduces the demand for human labour to perform these tasks. Knowledge related to manufacturing and production, an industry historically characterised by routine tasks, is in surplus in the Skills for Jobs database for all countries including Australia, which has seen several large automotive manufacturing companies shut down in recent years. But while most OECD countries also have large surpluses in knowledge related to building and construction, this is not the case in Australia (Figure 1.6, Panel B), where the construction sector is currently growing, and Jobs and Small Business expects it to be one of the largest contributors to employment growth over the next five years. Recall that Jobs and Small Business in its skill shortage research finds persistent shortages in several trades occupations, including a number of those related to construction.
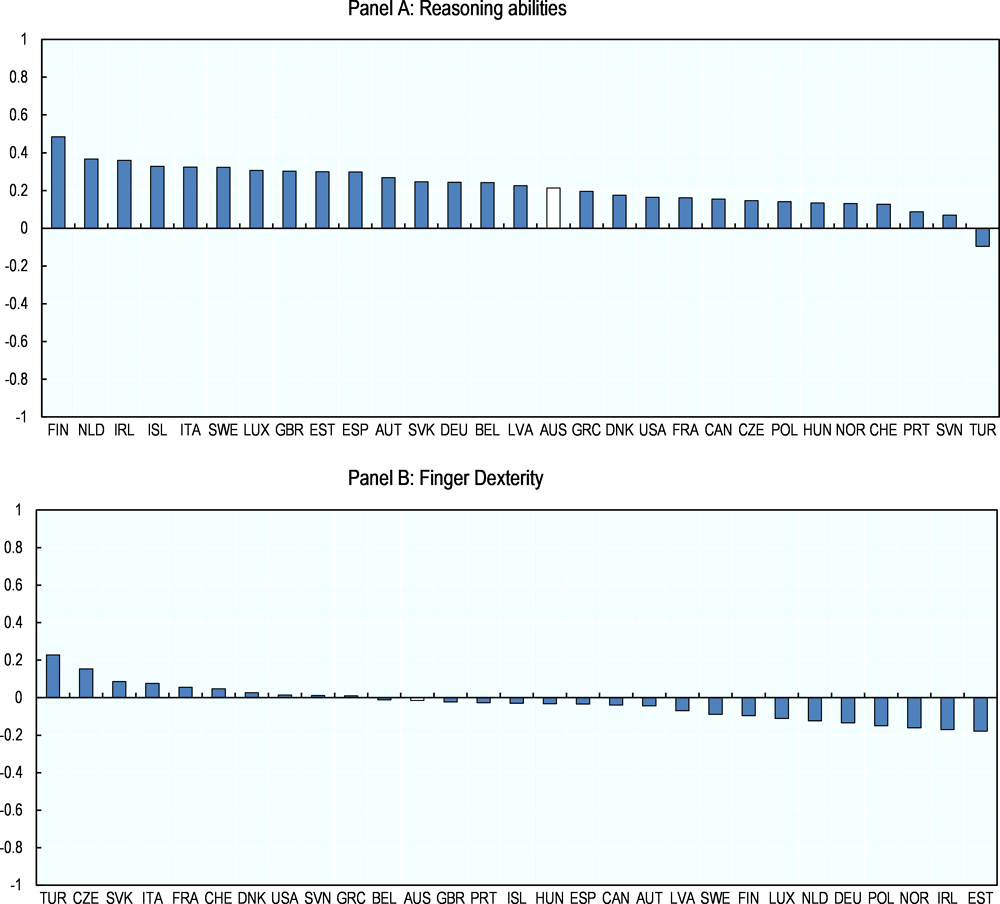
Research to understand the impact that technological change could have on jobs and the tasks that humans perform at work has come to the conclusion that manual, non-cognitive, physical tasks will decline in demand, as these tasks are more cheaply performed by machines, while more cognitive and social tasks (not yet mastered by machines) will rise in demand (Autor, Levy and Murnane, 2003[12]). These trends are already playing out in Australia, where cognitive skills (e.g. reasoning abilities and complex problem-solving skills) and social skills are in shortage, and manual and physical skills, like fine manipulative abilities and physical strength, are in surplus (Figure 1.5). But relative to other OECD countries, shortages in cognitive skills are low in Australia (e.g. reasoning abilities, see Figure 1.7, Panel A), likely owing to an already highly-skilled and educated workforce. Surpluses in physical and manual skills are also low (e.g. finger dexterity; see Figure 1.7, Panel B), owing to ongoing demand for these skills in the skilled trades and construction sector.
Note: Positive values indicate shortages while negative values indicate surpluses. A Skill Needs indicator value of +1 represents the maximum value across countries in the database, while a value of -1 represents the lowest value. Latest year of data available for Australia is 2016. All OECD countries in the database were included.
Source: OECD Skills for Jobs database 2017 (http://www.oecd.org/els/emp/skills-for-jobs-dataviz.htm).
Note: Positive values indicate shortages while negative values indicate surpluses. A Skill Needs indicator value of +1 represents the maximum value across countries in the database, while a value of -1 represents the lowest value. All OECD countries in the database were included.
Source: OECD Skills for Jobs database 2017. Latest year of data available for Australia is 2016.
1.2.2. Skills mismatch
Typically, the term “skills mismatch” refers to three different types of mismatch: field-of-study mismatch, qualification mismatch, and the more narrowly-understood skills mismatch. Qualification mismatch is when a worker has a level of educational attainment that is higher or lower than what is required by their job. Field-of-study mismatch, on the other hand, arises when a worker is employed in a field other than the one in which they specialised in at school. Finally, skills mismatch refers to when a worker’s skills (e.g. literacy, numeracy or digital problem-solving skills) exceed or fall short of those needed to carry out the daily tasks of their job. On average, across the countries that took part in the 2012 Survey of Adult Skills, 60% of Australian workers are mismatched along at least one of these dimensions (Figure 1.8).

Note: See OECD (2016), Getting Skills Right: Assessing and Anticipating Changing Skill Needs.
Source: OECD calculations based on the Survey of Adult Skills (PIAAC) 2012.
Skills mismatch entails costs for workers, firms and the aggregate economy. For individuals, over-qualification can lead to lower job satisfaction (Vieira and Cabral, 2005), costing firms heavily in terms of employee turnover. In addition to lower job satisfaction, mismatched workers also have lower wages. Over-qualified workers are shown to earn about 20% less than workers with similar qualifications who are well-matched to their jobs, while under-qualified workers earn 17% less than well-matched workers with similar qualifications (Quintini, 2011[13]).
Field-of-study mismatch can also entail large costs for individuals as well as economies, due to the underuse of specific human capital. Generally, individuals only incur wage penalties when they work in a job unrelated to their studies if they must downgrade to a job which requires a lower level of qualification (Montt, 2015[14]). In addition to costs for individuals, field-of-study mismatch can entail productivity costs for an economy, as mismatched workers may be less productive than well-matched workers because mismatched workers lack field-specific skills or may take longer to develop such skills through on-the-job training or work experience.
At the aggregate level, skills mismatch worsens labour productivity through an inefficient allocation of resources (Adalet McGowan and Andrews, 2015[15]). Similarly, aggregate level costs associated with field-of-study mismatch are estimated at up to 1% of GDP, based on a cross-country analysis, due to losses in productivity and to the sunk cost of developing skills that are not fully used in the labour market (Montt, 2015[14]). Looking at analysis specific to Australia, Mavromaras et al. (2009[16]) estimate the cost of over-skilling in Australia in 2005 to be around 2.6% of GDP, using wages as an indicator of productivity.
Qualification mismatch
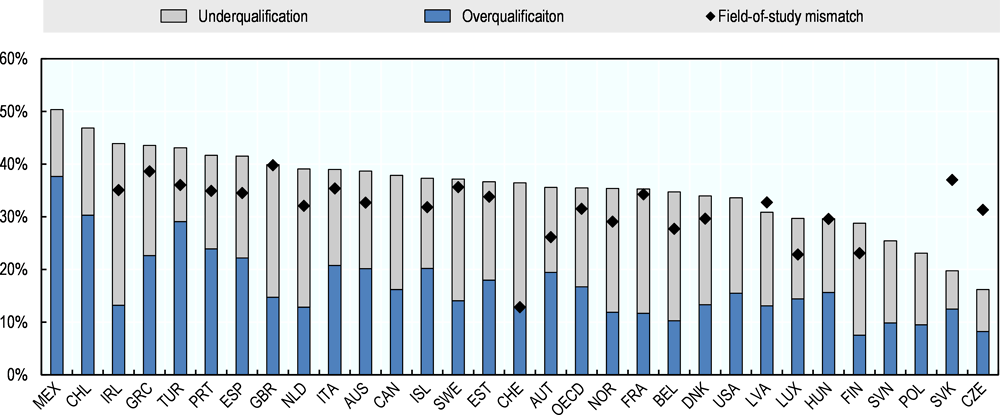
According to the 2017 Skills for Jobs database, about 35% of workers across OECD countries are mismatched by qualification. In Australia, 39% of workers are mismatched by qualification, putting the country just above the OECD average (Figure 1.9)6.
Note: Most recent year available for each country. Data for Australia are for 2016. Field-of-study mismatch is calculated for all countries at the 2-digit ISCO level. See OECD (2017), Getting Skills Right: Skills for Jobs Indicators for details on methodology.
Source: OECD Skills for Jobs database 2017. Data for Australia come from the Australian Bureau of Statistics and are based on the two-digit ANZSCO classification.
About 20% of Australian workers are over-qualified for their occupations, while about 19% are under-qualified. The rate of under-qualification is on par with the OECD average, while the rate of over-qualification is slightly above the OECD average (20% vs. 17%). Over-qualification can arise if individuals are unable to find work in their field of study, and must downgrade to a job with a lower qualification requirement in order to find work.
Research using the Household Income and Labour Dynamics in Australia (HILDA) survey data studies how qualification mismatch varies by education pathway. Mavromaras (2009) differentiates between higher education graduates, VET graduates, Year 12 school graduates and those qualified below Year 12, and finds that VET graduates are the most likely to be well-matched by qualification in their jobs.
Apparent qualification mismatch
Over-qualification can be due to employers selecting candidates with higher qualifications than necessary to do a job, under the assumption that these candidates sport a set of unobservable qualities or skills that are likely to make them better workers (e.g. more disciplined, or productive). Empirical evidence suggests that firms do indeed employ such selection techniques (Bulmahn and Krakel, 2002[17]).
While employers often use qualifications as a proxy for a set of skills, and individuals acquire qualifications as a signal to employers that they have certain skills, qualifications are an imperfect indication of skills. Indeed, there can be considerable heterogeneity in the quality of skills acquired by individuals with the same qualification. When individuals are over-qualified or under-qualified for their jobs, but well-matched in terms of the actual skills needed to do their jobs, this is known as “apparent qualification mismatch.”
Evidence from the 2012 OECD Survey of Adult Skills indicates that among those Australians who were over-qualified for their jobs, 83.4% had the right level of literacy skills for the job, while only 13.4% had a higher level of literacy skills than was required (Table 1.1). The degree of apparent mismatch varies by field of study. Apparent qualification mismatch is highest in services, health and welfare, social sciences and engineering, manufacturing and construction, where qualifications seem to be inflated relative to the underlying literacy skills of the workers.
Apparent qualification mismatch of this type points to the low capacity of qualifications to accurately signal skill quality. Of course, qualifications may more successfully signal skills other than literacy skills. For instance, a degree in social work may do a good job of signalling human empathy skills, but a poor job of signalling literacy skills.
Field-of-study mismatch
Evidence from the OECD Skills for Jobs database suggests that field-of-study mismatch is quite common across OECD countries, with 32% of workers, on average, employed in a field that is different from the one they have studied and specialised in (Figure 1.9).
While Australia’s level of field-of-study mismatch is on par with the average (33% relative to 32%), the overlap between field-of-study mismatch and over-qualification is somewhat high in Australia. About 40% of workers who are mismatched by field-of-study are also overqualified for their job, compared to an average of 33% among countries surveyed. The OECD estimates that such workers face 20% lower wages than workers who are well matched. Analysis using the HILDA Australian panel survey finds that the wage penalties for workers who are mismatched both by field of study and by qualification level may be even higher for Australian workers: 30% for men and 25% for women (Mahuteau et al., 2015[18]).
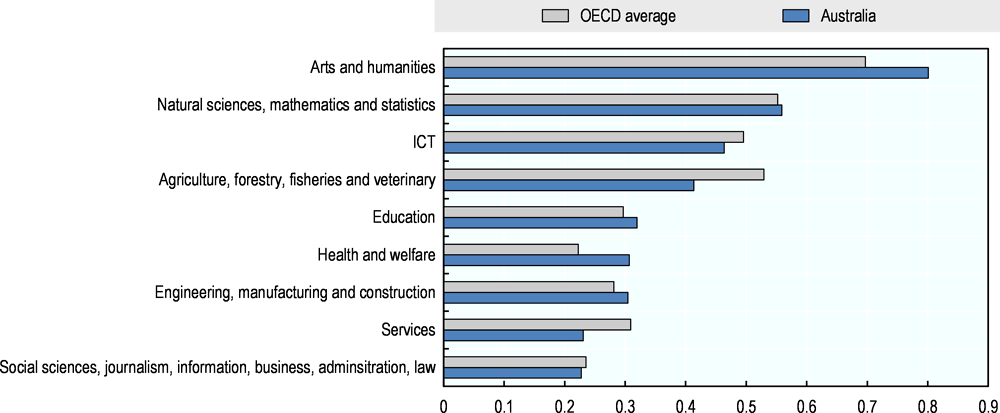
The incidence of field-of-study mismatch varies by field of study in Australia, with 80% of graduates from Arts and humanities working in a field unrelated to their studies, compared to only about a quarter of graduates from Social sciences and Services; and less than a third of graduates from programs in Engineering, manufacturing and construction; Health and welfare; and Education (Figure 1.10). Field-of-study mismatch in Arts and humanities is higher in Australia than the average (69%), which could indicate lower labour demand in these fields relatively to elsewhere, or perhaps students with these skill sets face better job prospects or higher pay in other fields.
Source: OECD Skills for Jobs database. The OECD average includes 24 OECD countries in the database.
Both field-of-study mismatch and qualification mismatch also vary by immigration status in Australia. About 30% of foreign-born tertiary-educated adults are over-qualified, compared with just over 20% of the native-born who are tertiary-educated (PIAAC, 2012). Foreign-born adults are also more likely to be mismatched by field of study: 60% work in a field other than the one in which they studied, compared with only 35% for the total population (ABS, 2015[19]). However, those adult migrants who obtained a non-school qualification after arrival in Australia had a similar level of field-of-study mismatch to the total population, suggesting that foreign credentials may not be well-recognised by employers.
1.3. Economic trends affecting the demand and supply of skills in Australia
Major global trends like rapid technological innovation, increased globalisation, and ageing populations have led to the emergence and expansion of some sectors and occupations at the same time as others have contracted. In Australia, as in other OECD countries, these trends have contributed to a change in the skill composition of employment. The share of employment in jobs at the top and bottom of the skill distribution has grown over the last decade and a half, while the share of employment in middle-skill jobs has declined (Figure 1.11).
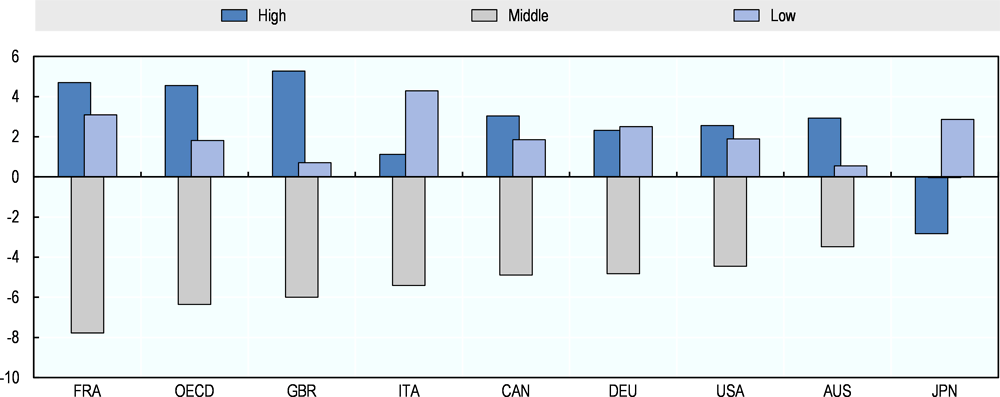
Note: High-skill occupations include jobs classified under the ISCO-88 major groups 1, 2 and 3; middle-skill occupations include those under major groups 4,7 and 8; and low-skill occupations include those in major groups 5 and 9.
Source: European Labour Force Survey for France, Great Britain, Italy and Germany; Labour force surveys for Canada (LFS), Japan (LFS), Australia (HILDA), and the United States (CPS MORG).
Economic trends suggest growing demand for labour in Australia. The country weathered the global financial crisis well thanks to a prompt monetary and fiscal stimulus response, high commodity prices along with continued robust demand for commodities from Asia, and a resilient financial system. However, the 2011 decline in commodity prices dampened labour demand and signalled the end of the mining boom, contributing to an increase in the unemployment rate from 5.1% in 2011 to 6.1% in 2015, though recent strong economic activity has started to bring the unemployment rate down and it is close to the OECD average (Figure 1.12). The end of the mining boom has been coupled with an ongoing decline in the manufacturing industry, particularly in the automotive sector. Flexible labour markets have facilitated this adjustment: employment has declined in manufacturing, while growing in the services sector, particularly in healthcare, social services and public administration, as well as professional, scientific and technical services (Figure 1.13).
Looking forward, the Department of Jobs and Small Business projects employment growth to be concentrated in four industries over the next five years to May 2022: health care and social assistance (contributing 26.4% of total projected employment growth), professional, scientific and technical services (13.3%), construction (12.7%) and education and training (12.3%). On the other hand, employment declines are anticipated for manufacturing; electricity, gas, water and waste services; and agriculture, forestry and fishing. Strong expected employment growth in the health care and social assistance sector can be attributed to the ongoing ageing of the Australian population, but also to the full implementation of the new National Disability Insurance Scheme, which is projected to require about 70,000 additional disability support care workers by 2019-20 to support increased participation (Productivity Commission, 2017[20]).

Note: Harmonised unemployment rates define the unemployed as people of working age who are without work, are available for work, and have taken specific steps to find work. The uniform application of this definition results in estimates of unemployment rates that are more internationally comparable than estimates based on national definitions of unemployment. This indicator measures the number of unemployed people as a percentage of the labour force and it is seasonally adjusted.
Source: OECD Short-Term Labour Market Statistics.

Note: Sectors are ranked in ascending order of employment change over the period 2000-2016.
Source: Australian Bureau of Statistics (2017), “Labour force, Australia, detailed, quarterly”, Table 04. Employed persons by industry – Trend, seasonally adjusted, original, Cat. No. 6291.0.55.003.
For its part, the labour supply in Australia is both highly educated and highly skilled. Australia ranks among the top ten countries in the world in the Global Talent Competitiveness Index 2017, which is testament both to its selective migration policies and responsive education system. In 2015, 43.7% of the adult population in Australia were educated at the tertiary level – one of the highest shares across OECD countries, and on par with the United States, United Kingdom and Ireland. Australian adults are also among the top-performers in literacy based on the OECD’s Survey of Adult Skills, with nearly 60% of adults performing at Level 3 or above compared to only 46% across the OECD. Numeracy performance is somewhat weaker, but still above the OECD average and on par with Canada, New Zealand and Germany (OECD, 2016[21]). Recall from the above discussion on skill shortages that while the Skills for Jobs database finds that Australia has shortages in certain skills, e.g. cognitive skills, these shortages are low relative to other countries owing to Australia’s highly-skilled and highly-qualified workforce.
In tandem with the shift towards increasing educational attainment, there has been a move away from students choosing vocational education and training (VET) after completion of secondary education, in favour of higher education. Undergraduate starts have risen by 49% between 2008 and 2016, while apprenticeship and traineeship starts have declined by 42% (Figure 1.14). For the most part, declines in apprenticeship starts are concentrated in non-trade apprenticeships, as opposed to trade apprenticeships (which only declined by 15% over this period, compared with 53% for non-trade apprenticeships), and in part reflect a 2012 reform which removed employer incentives to non-trade apprenticeships. In addition to declining enrolment in apprenticeships, completion rates in Australia are low by international standards; however, they have been trending upwards since 2010 (NCVER, 2016[22]).
Labour market outcomes of graduates provide an indicator of demand for higher-level qualifications. Adults with a tertiary education fare better on the labour market than less-educated adults, and the employment rate of adults with a tertiary education has stabilised at close to 84% since 2005. However, there are signs that the labour market outcomes of recent tertiary graduates (both VET and higher education) have weakened. Based on the Department of Education and Training’s (DET) Graduate Outcomes Survey and Graduate Careers Australia survey, the share of bachelor graduates in full-time work four months after graduation declined from 85% in 2008 to 71% in 20167. Over the same period, government-funded VET graduates saw their employment rates (whether full-time or part-time) decline from 82.2% to 73.4% (from 2008 to 2016). Government-funded VET graduates who undertook their training as part of an apprenticeship or traineeship are more likely to be employed (83.0% in 2016) compared with other government-funded VET graduates, but their outcomes have also weakened (from 90.9% in 2008 to 83.0% in 2016)8. Softening labour market outcomes for recent tertiary graduates suggests that the rising supply of such workers may have surpassed current demand. Alternatively, it could be that tertiary students are graduating without the specific skills that employers need.
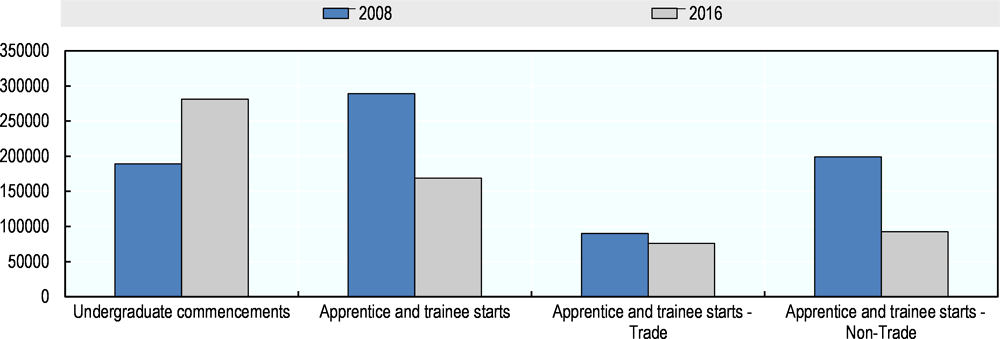
Note: Figures are for domestic students only.
Source: NCVER 2017, Historical time series of apprenticeships and traineeships in Australia, from 1963, NCVER, Adelaide; Department of Education, uCube, Enrolment Count by Commencing name, 2017.
Despite relatively low unemployment in Australia, a number of indicators suggest that challenges remain in matching the demand and supply of skills.
1.3.1. Long-term unemployment remains elevated
Australia’s unemployment rate remains above pre-crisis levels (5.6% in 2017 compared with 4.2% in 2008, Figure 1.12), and the level of long-term unemployment is also still above pre-crisis levels (Figure 1.15). Among the unemployed, 23.5% have been looking for work for a year or longer – a long-term unemployment rate that is lower than the OECD average (31.0%), but still well-above pre-crisis levels (14.9% in 2008). The risk of long-term unemployment is highest for mature-age workers followed by prime-age workers: over a third of unemployed aged 50-64 years and a quarter of those aged 30-49 years have been unemployed for more than a year (OECD, 2017[23]).
Elevated long-term unemployment can be a signal of declining efficiency in the way that labour markets match workers with jobs. Indeed, a decline in efficiency is observed by looking at the Beveridge curve (which depicts the relationship between the job vacancy rate and the unemployment rate over time; see Figure 1.16) for the period 2009-2017: for a given level of the job vacancy rate, the unemployment rate has increased over time, suggesting a deterioration in the matching of unemployed workers’ skills relative to those required by employers. The longer a person remains in unemployment, the higher the risk that their skills will depreciate or become obsolescent.

Source: OECD Labour Force Statistics.
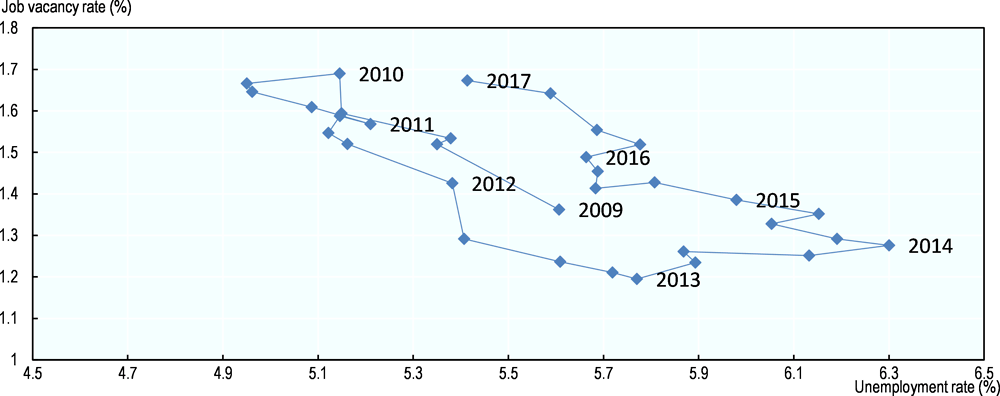
Note: The Beveridge curve shows the unemployment rate along the x-axis, and the job vacancy rate along the y-axis. The job vacancy rate is the total job vacancies posted over a given period as a share of total labour demand, measured as the sum of total employed and total job vacancies. Each point represents a quarter, and labels refer to the quarter starting in November.
Source: Australian Bureau of Statistics; Job Vacancies, Australia (A590700F); Employed, Australia (A84423043C); Unemployment rate (A84423050A).
1.3.2. Evidence of widening regional disparities in unemployment
In addition to the risks posed by long-term unemployment, another challenge in matching the demand and supply of skills arises from widening regional labour market disparities. Since 2008, the unemployment rate has risen the most in Queensland and Western Australia, in connection with declining activity in mining (Productivity Commission, 2017[24]). But the unemployment rates between states and territories are still quite small, with only a 2.4 percentage point gap between the states with the highest and lowest unemployment rates (South Australia, 6.3%; Northern Territory, 3.9%; Figure 1.17, Panel A). However, looking at a finer level of disaggregation using unemployment rates across small regions (TL3) in Australia, there has been a rising dispersion in unemployment rates between (TL3) regions since 2012 (Figure 1.17, Panel B)9. In 2016, unemployment rates by small region ranged from 16.2% in Queensland – Outback to only 2.2% in Victoria – North West.
Australians are highly mobile, with 3.3% of the total population moving across regions within Australia annually. This internal mobility rate is higher than the OECD average (2.1%).10 Such internal mobility plays a key role in facilitating adjustments from low-growth occupations, sectors and regions to higher-growth ones. But the resulting outflow of skills and labour from rural and remote regions, combined with the fact that rural and remote regions in Australia tend to be less educated (Department of Employment, 2017[25]), has led to the emergence of regional skill shortages, particularly in health professions.11

Note: Panel A: Annual averages of monthly unemployment rate data. Panel B: The absolute dispersion of unemployment rates is measured as the standard deviation of the regional unemployment rates from the national average weighted by the corresponding region’s labour force share.
Source: Panel A: Australian Bureau of Statistics, Labour force status. Panel B: OECD Regional Labour Statistics.
1.3.3. Low labour force participation of certain groups
Finally, certain groups have scope to increase their labour market participation to make better use of the existing skill supply. OECD (2017[23]) identified several groups with “untapped potential”: prime-aged women, mature-age workers, people with disabilities and mental health conditions, as well as indigenous persons and young people not in education, employment or training (NEET). For instance, since young women’s level of educational attainment now outpaces that of young men in Australia, there would be potentially large gains to the economy if women participated more in the labour market. Youth labour market conditions have improved over recent years, but the share of young adults (age 20-24) not in employment, education or training (i.e. the “NEET” rate) is still high. The NEET rate in Australia is above the OECD average (16.2% vs. 12.0% in 2016); only slightly higher than New Zealand (13.1%), Canada (14.9%), the United Kingdom (15.0%) and the United States (15.3%), but well-above Iceland (6%), the Netherlands (8.5%), and Switzerland (10.1%). Furthermore, indigenous persons in Australia face significantly lower employment rates than the non-indigenous population (48.4% versus 72.6% in 2014-1512). Not only does this have costs in terms of the well-being of indigenous persons, but it also represents an under-exploited source of labour and potential skills to address regional skill shortages, as indigenous persons are well-represented in rural and remote regions (Golebiowska, 2016[26]).
1.4. Assessing and anticipating skill needs to reduce skill imbalances
While skill imbalances are in some sense inevitable in any dynamic economy, several avenues are available to reduce their size. OECD (2016[27]) points out that the fact that there is variability across countries in the prevalence of shortages and mismatches indicates that they are sensitive to policy making and/or economic conditions.
But the success of policies to reduce skill imbalances hinges on the existence of information systems which i) assess current and future supply of and demand for skills; and ii) identify and/or anticipate skill shortages and mismatches. Skills assessment and anticipation exercises can play a fundamental role in providing adequate information to policy makers and other stakeholders in order to shape policies that lessen skill imbalances: to direct active labour market policies; to guide students’ and adults’ education and training decisions; and to facilitate the entry of migrants who have skills that are in demand. Chapter 2 provides an overview of the different types of skill assessment and anticipation exercises in place in Australia.
References
[19] ABS (2015), Qualifications and Work, Australia, Australian Bureau of Statistics, http://www.abs.gov.au/AUSSTATS/[email protected]/Latestproducts/4235.0Main%20Features12015?opendocument&tabname=Summary&prodno=4235.0&issue=2015&num=&view=.
[15] Adalet McGowan, M. and D. Andrews (2015), Labour Market Mismatch and Labour Productivity, Organisation for Economic Co-operation and Development, Paris, http://www.oecd-ilibrary.org/content/workingpaper/5js1pzx1r2kb-en, https://doi.org/10.1787/5js1pzx1r2kb-en.
[12] Autor, D., F. Levy and R. Murnane (2003), “The Skill Content of Recent Technological Change: An Empirical Exploration”, Quarterly Journal of Economics November, pp. 1279-1333.
[1] Becker, G. (1962), Investment in Human Capital: A Theoretical Analysis, The University of Chicago Press, https://doi.org/10.2307/1829103.
[17] Bulmahn, G. and M. Krakel (2002), “Overeducated Workers as an Insurance Device”, Labour, Vol. 16/2, pp. 383-402, https://doi.org/10.1111/1467-9914.00200.
[9] Department of Employment (2018), The Skilled Labour Market: A pictorial overview of trends and shortages, Department of Employment, Australian Government, http://www.employment.gov.au/skill-shortages.
[25] Department of Employment (2017), Australian Jobs 2017, Australian Government, Department of Employment.
[8] Department of Employment (2017), The Skilled Labour Market: A pictorial overview of trends and shortages 2016-17, Australian Government, Department of Employment, http://www.employment.gov.au/skill-shortages.
[5] Department of Industry, Innovation and Science (2011), Key Statistics: Australian Small Business, Australian Government.
[29] European Union (2011), Transferability of Skills across Economic Sectors: Role and Importance for Employment at European Level.
[26] Golebiowska, K. (2016), “Are Peripheral Regions Benefiting from National Policies Aimed at Attracting Skilled Migrants? Case Study of the Northern Territory of Australia”, Journal of International Migration and Integration, https://doi.org/10.1007/s12134-015-0431-3.
[10] Green, F., S. Machin and D. Wilkinson (1998), “The Meaning and Determinants of Skills Shortages”, Oxford Bulletin of Economics and Statistics, Vol. 60/2, pp. 165-187, https://doi.org/10.1111/1468-0084.00093.
[31] Gruen, D., B. Li and T. Wong (2012), “Unemployment disparity across regions”, Economic Roundup 2, https://treasury.gov.au/publication/economic-roundup-issue-2-2012-2/economic-roundup-issue-2-2012/unemployment-disparity-across-regions/.
[4] Haskel, J. and C. Martin (1993), “Do Skill Shortages Reduce Productivity? Theory and Evidence from the United Kingdom”, The Economic Journal, Vol. 103/417, p. 386, https://doi.org/10.2307/2234777.
[7] Healy, J., K. Mavromaras and P. Sloane (2015), “Adjusting to Skill Shortages in Australian SMEs”, Applied Economics, Vol. 47/24, https://doi.org/10.1080/00036846.2015.1008764.
[2] Janankar, R. (2009), “Was there a Skills Shortage in Australia?”, The Institute for the Study of Labor (IZA).
[18] Mahuteau, S. et al. (2015), “Horizontal and Vertical Educational Mismatch and Wages”, http://www.flinders.edu.au/sabs/nils-files/publications/working-papers/WP%20216%20-%20Horizontal%20and%20vertical%20educational%20mismatch%20and%20wages%20.pdf (accessed on 25 September 2017).
[16] Mavromaras, K., S. McGuinnes and Y. Fok (2009), “Assessing the Incidence and Wage Effects of Overskilling in the Australian Labour Market”, The Economic Record, Vol. 85/268, pp. 60-72.
[14] Montt, G. (2015), “The causes and consequences of field-of-study mismatch: An analysis using PIAAC”, OECD Social, Employment and Migration Working Papers, No. 167, OECD Publishing, Paris, https://doi.org/10.1787/5jrxm4dhv9r2-en.
[28] National Australia Bank (2017), Moments that Matter: Understanding Australian SMEs.
[22] NCVER (2016), Completion and attrition rates for apprentices and trainees 2016, National Centre for Vocational Education Research.
[23] OECD (2017), Connecting People with Jobs: Key Issues for Raising Labour Market Participation in Australia, Connecting People with Jobs, OECD Publishing, Paris, https://doi.org/10.1787/9789264269637-en.
[11] OECD (2017), Getting Skills Right: The OECD Skills for Jobs Indicators, OECD Publishing, Paris.
[32] OECD (2017), OECD Economic Surveys: Australia 2017, OECD Publishing, Paris, https://doi.org/10.1787/eco_surveys-aus-2017-en.
[30] OECD (2017), The Next Production Revolution: Implications for Governments and Business, OECD Publishing, Paris, https://doi.org/10.1787/9789264271036-en.
[27] OECD (2016), Getting Skills Right: Assessing and Anticipating Changing Skill Needs, Getting Skills Right, OECD Publishing, Paris, https://doi.org/10.1787/9789264252073-en.
[21] OECD (2016), Skills Matter: Further Results from the Survey of Adult Skills, OECD Publishing, Paris, https://doi.org/10.1787/9789264258051-en.
[20] Productivity Commission (2017), National Disability Insurance Scheme (NDIS) Costs, Australian Government, Productivity Commission.
[24] Productivity Commission (2017), Transitioning Regional Economies, Productivity Commission.
[13] Quintini, G. (2011), Over-Qualified or Under-Skilled, Organisation for Economic Co-operation and Development, Paris, http://www.oecd-ilibrary.org/content/workingpaper/5kg58j9d7b6d-en, https://doi.org/10.1787/5kg58j9d7b6d-en.
[3] Shah, C. and G. Burke (2005), “Skills Shortages: Concepts, Measurement, and Policy Response”, Australian Bulletin of Labour, Vol. 31/1, p. 44.
[6] Sharma, K., E. Oczkowski and J. Hicks (2016), “Skill shortages in regional Australia: A local perspective from the Riverina”, Economic Analysis and Policy, https://doi.org/10.1016/j.eap.2016.08.001.
Notes
← 1. The Department of Jobs and Small Business skill shortage research focuses on selected occupations defined in the Australia and New Zealand Standard Classification of Occupations (ANZSCO) that are skilled (i.e. require at least three years of post-school education and training). Most selected occupations are in one of three major occupation groups: managers, professionals, and technicians and trades.
← 2. This may seem like an excessively high share of occupations in shortage; however, the Department of Jobs and Small Business only assesses about 70 occupations on a consistent basis, and these are all skilled occupations, mostly in professions and trades. Therefore they are not representative of the full labour market. The Department’s methodology combines an employer survey with an assessment of other labour market information to arrive at whether an occupation is in shortage or not (see Chapter 2 for more details).
← 3. Skills are considered to be “transversal” when they are highly applicable to various occupations and sectors (European Union, 2011[27]). Transversal skills can include soft skills – those that are non-job-specific and closely connected with attitudes (e.g. teamwork, leadership, entrepreneurship), but also generic hard skills, which are technical and job-specific abilities which can be applied effectively in most jobs (e.g. digital skills, communication in foreign languages).
← 4. The OECD (2017[29]) publication, “The Next Production Revolution,” outlines some of the major technological developments likely to affect production now and into the future: from a variety of digital technologies (e.g. 3D printing, the Internet of Things, advanced robotics) and new materials (e.g. bio- or nano-based) to new processes (e.g. data-driven production, artificial intelligence, synthetic biology).
← 5. According to the OECD’s 2017 Science, Technology and Industry Scoreboard, 17.6% of tertiary students in Australia (no distinction between domestic or foreign-born) entered one of the above fields, compared with 23.4% across OECD countries. In response, Australian education policy has recently introduced a number of skill-building initiatives which favour science, technology, engineering and mathematics (STEM) fields, including a $1.1 billion National Innovation and Science Agenda which has allocated $64 million to fund early learning and school STEM initiatives (https://www.education.gov.au/support-science-technology-engineering-and-mathematics).
← 6. In the 2012 Survey of Adult Skills, qualification mismatch in Australia was assessed to be much higher than the OECD average – 42% relative to 36%. While the Survey of Adult Skills relied on a self-reported measure of qualification mismatch (i.e. asking workers whether they thought they were over- or under-qualified for their job), the Skills for Jobs database is based on a definition of “well-matched” that is equivalent to the median qualification level in a given occupation (see OECD (2017), Getting Skills Right: Skills for Jobs Indicators for methodological details).
← 7. In 2017, 71.8% of undergraduates were in full-time employment four months after completing their degree. (2017 Graduate Outcomes Survey, National Report)
← 8. National Student Outcomes Survey, which is an annual survey that covers students who are awarded a qualification, or who successfully complete part of a course and then leave the VET system.
← 9. During the mining boom, unemployment rate dispersion narrowed between regions (Gruen, Li and Wong, 2012[30]), suggesting that the mining boom drew labour from other parts of the country and helped to reduce unemployment across all regions.
← 10. Share of total population who moves across TL3 regions annually (average 2011-13). OECD Regions at a Glance 2016.
← 11. Department of Jobs and Small Business, Skill Shortage Research, 2016-2017.
← 12. Australian Bureau of Statistics; National Aboriginal and Torres Strait Islander Social Survey, Australia, 2014–15. Most recent data available.