Chapter 3. Improving infrastructure financing
Required investments in road and infrastructure in Asian countries will require governments to consider a broader range of sources of financing than have been used in the past. The public sector still bears much of the burden in financing infrastructure and is expected to continue to play a major role in future. Public revenues can be increased through improvements to tax yields generally and the implementation of taxes specifically for financing infrastructure, such as vehicle taxes and road-use charges, energy taxes and taxing project beneficiaries. Public-private partnerships and private investment in infrastructure projects are expected to continue to become more important as sources of financing. Fostering greater private involvement in infrastructure finance will require, in many countries, the development of effective governance mechanisms and of financial markets.
Introduction
The countries of Emerging Asia continue to register robust economic growth. The OECD forecasts an average growth rate of 6.3% for Southeast Asia, China, and India in 2018-22 (OECD, 2018[1]). In turn, this strong growth across the region will fuel an increasing demand for infrastructure. Indeed, the demand for infrastructure in Emerging Asia is already very large. However, the region is facing significant challenges in financing the infrastructure investments it needs in order to meet this surging demand. Moreover, countries across the region need to find funding not just for new projects, but also to improve and maintain existing infrastructure. Both of these types of investment will contribute to inclusive and sustainable growth in the region. It is necessary, therefore, for countries to secure more infrastructure financing.
Traditionally, and particularly in Emerging Asia, infrastructure financing has relied heavily on public spending, both from national governments and from lower tiers of administration. However, considering how much infrastructure funding these countries require at the moment, government revenues alone are insufficient. The private sector is also becoming a crucial part of the equation. PPPs for infrastructure construction and maintenance have gained traction of late. These partnerships between private investors and public authorities create investment opportunities for private investors, while at the same time easing the fiscal burden for the public sector. They also aim to spread credit risk, and to capitalise on the private sector’s ability to manage projects. The experiences of OECD member countries offer examples for Emerging Asia of ways of diversifying sources of funding.
In addition, considering the long duration of infrastructure projects, optimal financing depends on the type and phase of the project that is being covered. Infrastructure projects typically run through three stages: pre-construction, construction and post-construction. The latter is also sometimes referred to as the operations and maintenance phase. These stages have varying risk profiles and potential returns, and this matters a great deal in financial planning, particularly if the private sector gets involved. The differences in characteristics of each stage mean that equity-sharing arrangements with the private sector, and the stage of the project cycle at which a private partner enters it, have strong implications for its financial viability.
Ideally, projects with long gestation periods like roads, bridges and railways require long-term instruments. Securing long-term capital mitigates the credit risks associated with a mismatch between revenues and debt maturity. Moreover, the flexibility of a project's financing instruments is another key consideration. The ease with which financing can be rolled over or restructured is important, especially if there is a high degree of regulatory uncertainty hovering over an infrastructure project. Uncertainties come in the form of unexpected changes in the terms of the agreements, or sharp shifts, midway through the project cycle, in regulations, the political orientation of the government, or other socio-economic factors.
This chapter examines the different infrastructure financing options, including funding from public sector, private sector participation and effective use of PPP. It also looks into some challenges that need further attention such as taking better care to match the needs of a project with the most appropriate methods of financing, and developing infrastructure funds. This chapter outlines some of the tools used in raising public sector revenues and explores ways of involving the private sector in financing infrastructure available for Emerging Asian countries to consider.
Though beyond the scope of this chapter, infrastructure investments in emerging economies may also be financed in part or in full through international bilateral and multilateral flows of development assistance funds in addition to public and private sources of financing. Moreover, in addition to the floating of government securities on the international market, foreign borrowing can also include official development assistance (ODA) loans. Foreign grants from multilateral and bilateral partners have also been used to provide infrastructure in countries in Emerging Asia. In general terms, ODA falls into the two main categories of direct bilateral aid for developing countries, and multilateral aid from international organisations such as the World Bank, or the newly-developed Asian Infrastructure Investment Bank. Bilateral aid consists of co-operation in terms of finance and investment (ODA loans and private-sector investment finance), and grants (grant aid and technical cooperation).
Funding from the public sector
The public sector bears much of the burden in financing infrastructure. In 2017, the Asian Development Bank (ADB) estimated that the public sector accounted for roughly 90% of the infrastructure spending in Asia based on recent data (from 2010-14), albeit with considerable variations across regions and industries.1 Moreover, the public sector's share of infrastructure financing in emerging economies – including those in Asia – is generally higher than in developed economies (Inderst, 2016[2]).2 This section discusses various financing options of public sector, including: mobilising tax revenue through i) fuel and carbon taxes, ii) vehicle and road user charges, and iii) land value capture tools.
Tax and non-tax revenues, as well as bonds from governments and state-owned enterprises, are the primary sources of financing for the public sector. In addition to general resources from the budget, experience both in OECD member countries and those in the region in question here, shows that a combination of specific infrastructure-related taxes can help to fund infrastructure. These include taxes on fuel and vehicles, road-use charges, and land-value capture tools. These revenues may either be earmarked for infrastructure investment or directed into the general budget.
Countries in Emerging Asia still have considerable scope to improve their tax collection capacity, which can be pursued through improvements in tax administration and using alternative revenue sources, such as taxing fuel and vehicles. The ratio of tax to gross domestic product (GDP) in countries in Emerging Asia is much lower than in the member countries of the OECD. In 2015, for example, the tax-to-GDP ratios in Indonesia, Malaysia, the Philippines and Singapore respectively stood at 11.8%, 15.3%, 17% and 13.6%. This was well below the OECD average of 34.3%, and also below recent ratios of 32% in Japan and 25.3% in Korea (OECD, 2017[3]).
Taxing fuel
Energy-related taxes can play an important role in financing infrastructure investments. Some countries dedicate fuel tax to funding infrastructure, notably for building and maintaining roads. Meanwhile, some other countries collate fuel tax with other excise taxes, from which road funding then comes. Countries like Switzerland and the United Kingdom apply both a carbon tax, which is directly linked to the level of CO2 emissions, and an excise duty on fuels used for vehicles or heating.
In the United Kingdom, there is an excise duty of 0.5795 pounds (GBP) per litre on petrol, diesel, biodiesel and bioethanol, and of GBP 0.3161 per kilogram on liquid petroleum gas. Fuel duty also applies if people wish to use heating fuels or natural gas as fuel for vehicles. Furthermore, a charge of GBP 0.2470 per kilogram is imposed on natural gas. Moreover, fuel oil used for non-road use (i.e. heating) is charged at GBP 0.1070 or GBP 0.1114 per litre, depending on the type of fuel. In 2012, the United Kingdom’s direct taxation of motoring, excluding value-added tax (VAT), raised GBP 30.7 billion. Of this sum, GBP 24.8 billion came from fuel duty, and GBP 5.9 billion came from vehicle excise duty (Bayliss, 2014[4]). The UK government levies fuel taxes nationwide, depositing them into the treasury department’s general consolidated fund. In recent years, the central government has allocated around 50% of its funding to capital improvements in the rail network, including the Crossrail project in the London area (Eno, 2014[5]). Indeed, the United Kingdom has one of the highest rates of fuel tax in the whole of the European Union, when expressed as a share of the end-consumer price. This is particularly the case for diesel (Figure 3.1).
Meanwhile, Iceland and Sweden also charge duties on petroleum and electricity. Indeed, Iceland charges a general excise tax of 23.86 krona (ISK) per litre on petroleum products. It also applies a special excise tax – which it keeps for road maintenance – to transport fuels, with rates of ISK 38.55 per litre for gasoline, and ISK 54.88 per litre for diesel, as of April 2012 (OECD, 2013[6]). Gasoline tax is also one of the main sources of revenue in Germany. The revenues from Germany's gasoline tax flow into the country’s general fund.
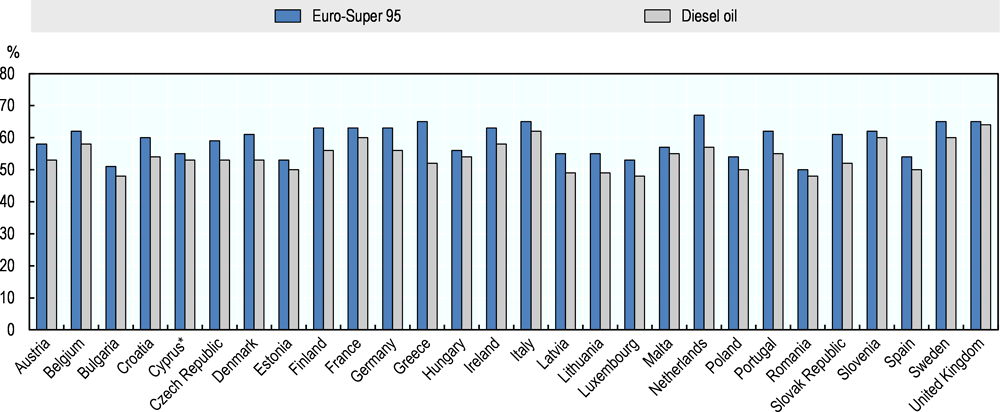
Note: EU Weighted Average = 62% (Euro-Super 95), 57% (Diesel Oil).
* The information in this document with reference to “Cyprus” relates to the southern part of the Island. There is no single authority representing both Turkish and Greek Cypriot people on the Island. Turkey recognises the Turkish Republic of Northern Cyprus (TRNC). Until a lasting and equitable solution is found within the context of the United Nations, Turkey shall preserve its position concerning the “Cyprus issue”.
* The Republic of Cyprus is recognised by all members of the United Nations with the exception of Turkey. The information in this document relates to the area under the effective control of the Government of the Republic of Cyprus.
Source: EU (2018[7]), The European Commission’s Oil Bulletin.
Earmarked fuel taxes may be used to raise revenues specifically for infrastructure investment. For instance, Japan has previously implemented a system of earmarking tax revenues – particularly from gasoline and vehicle-related taxes – for road construction. However, the Japanese government abolished the earmarked taxation system in 2008. In 2009, Japan incorporated into the general account all of the tax revenues it had previously earmarked. Having made this change, the Japanese government then switched to covering road-development expenditure from the general account. Switzerland, however, does use earmarked taxation, particularly when it comes to revenues from the country's petroleum tax surcharge. Indeed, Switzerland earmarks this, together with half of the revenues from the petroleum tax itself, to finance transport infrastructure. The United States, meanwhile, provides an example of earmarking tax revenues from road transport for specific use in the transport sector, particularly for highways. Over the past 20 years, the US system of earmarked taxes has been able to fund sufficient growth in highway spending and capacity, and some improvements in service (OECD/ITF, 2008[8]).
Fuel taxes are also used in Emerging Asia. For instance, China implemented a reform of fuel taxation in 2009. Before making this change, China had maintained its roads through the road-maintenance fees that local governments collected from road users. However, there had been some issues about this approach, including local governments charging different fees, the continuing prevalence of environmental issues such as pollution, and concerns about the quickly rising demand for oil. In order to address these issues, the country significantly increased the rate of the consumption tax on oil products. There is also a fixed amount of fuel tax per litre that manufacturers and importers of oil products have to pay. Moreover, it is the central government that collects these taxes, thereby increasing the efficiency of their eventual allocation, as well as equalising levels across the country. China uses this new tax arrangement as a substitute for the road-maintenance fees and other road-use surcharges that it has abolished. The country also uses these revenues to make up for certain toll revenues, having removed some toll authorisations on class II highways and provided subsidies for grain producers and the poor in order to enhance public welfare. Having implemented these reforms to its fuel-tax system, China now manages the financing for its road sector centrally. In so doing, it draws on resources from fuel taxation, from a tax on the purchase of new vehicles, and from central-government budgets. However, there is a room for improvement about roles and responsibilities of local government agencies, or that it should create an independent administrative body for national roads and funding to manage its national road programme.
Energy-related taxes are often applied not only to generate revenue for infrastructure, but also due to environmental considerations. One example of this is applying a carbon tax – a tax directly linked to the level of CO2 emissions, and often expressed as a value per tonne of CO2 equivalent – alongside other taxes on energy products (OECD, 2013[9]). Some OECD countries, such as Australia, Canada, Denmark, Finland, Iceland, Ireland, Norway, Slovenia, Sweden, Switzerland, and the United Kingdom, have explicit carbon taxes. In OECD countries, the effective tax rates on carbon range from around EUR 2.8 per tonne of CO2 in Mexico to EUR 107.3 per tonne in Switzerland. The simple average for all OECD countries stands at EUR 52 per tonne of CO2, while the weighted average is EUR 27 per tonne (OECD, 2013[9]).3 However, the concern about using a carbon tax usually relates to consumers. This is because a carbon tax can translate into higher prices for electricity, gasoline, home-heating fuels, and other fossil-fuel sources of energy.
Vehicle use taxes and road-use charges
Taxes on vehicles are an important source of tax revenue for most governments in OECD countries (OECD, 2014[10]). Taxes and charges on vehicles include taxes on the purchase of a vehicle (including VAT and retail sales taxes), a one-off levy on the registration of motor vehicles, periodic taxes payable in connection with the ownership or use of a vehicle, and also a number of other taxes and charges, such as insurance taxes, road tolls, and congestion charges, in addition to taxes on fuels. Indeed, countries including the United Kingdom, Sweden, Germany and Italy tax the ownership of vehicles at higher rates if they emit more CO2. Moreover, some countries – including the United Kingdom and Germany – also have road-use charges, with local authorities usually charging these fees. Charges can take several different forms, such as tolls, a heavy-vehicle fee, congestion charges, or a motorway vignette. Some Asian countries have also implemented use charges to raise revenue.
One of the most common ways of raising this kind of tax revenue can be to base vehicle tax on carbon-dioxide emissions. Direct taxation of motoring in the United Kingdom, for example, includes vehicle excise duty (VED), an ownership tax on every registered, mechanically propelled vehicle. For cars, the level of carbon dioxide that they emit helps to determine the tax rate their owner will pay. The first-year rate varies depending on the level of emissions, ranging from no charge at all for vehicles that emit less than 100g of CO2 per kilometre, to GBP 2 000 for vehicles that emit more than 255 grams of CO2 per kilometre. After the first year, there is a flat standard rate of GBP 140, except for zero-emission cars. Moreover, owners of cars whose initial purchase price exceeds GBP 40 000 also pay an additional GBP 310 per year (based on the new VED system, for cars registered from 1 April 2017).
In Germany, for cars registered from 1 July 2009, the motor vehicle tax is also based on CO2 emissions. For cars registered after 31 December 2013, this CO2 tax stands simply at EUR 2 for every gram per kilometre emitted above 95 g/km, while cars with CO2 emissions below 95 g/km are exempt from this tax. Additionally, drivers of vehicles with petrol engines have to pay a base amount of EUR 2 for every 100 cubic centimetres (cc) of engine size. On the other hand, drivers of vehicles with diesel engines have to pay EUR 9.50 for every 100 cc.
Sweden introduced vehicle tax in 1922 in order to pay for road maintenance. According to Sweden's tax agency, there were 6.9 million vehicles subject to vehicle tax in 2014, including 4.6 million passenger cars, 593 000 lorries, and 1 045 000 trailers. The country now taxes a wide range of vehicles according to how much pollution they create. The tax rates include a basic rate of 360 kronor (SEK), plus SEK 20 for each gram of CO2 the vehicle emits over 117 g/km. If the vehicle uses diesel, this sum is multiplied by 2.33. For vehicles that use alternative fuels, the basic rate is the same, but each extra gram costs less, at SEK 10 (OECD, 2014[10]).
In Italy, where the registration tax is calculated according to the type of vehicle, the power of the engine, and the weight and number of seats, as well as the pollution that the vehicle emits. The rates are EUR 151 for a car with an engine over 53 kilowatts, and EUR 3.5 per kilowatt for lower-powered engines. In addition, motorists have to pay an annual ownership tax ranging from EUR 2.58 to EUR 4.95 per kilowatt, depending on the engine's capacity and emissions. There is also a surtax of EUR 20 for each extra kilowatt in excess of 185 kilowatts in engine power. This surtax falls by 40% five years after the vehicle's construction, by 70% after ten years, and by 85% after fifteen years (OECD, 2014[10]).
In Switzerland, a performance-related heavy vehicle fee (HVF) is levied at the federal level. The basis for determining this tax is a mixture of emission levels, total weight, and the number of kilometres driven in Switzerland. It applies to all vehicles and trailers that are over 3.5 tonnes, used for the carriage of goods, licensed in Switzerland or abroad, and that drive on Switzerland’s public road network.
Japan charges owners a national motor-vehicle tonnage tax, both at the time of registration, and also after periodic compulsory inspections. For a new non-business passenger car, the tax rate is 12 300 yen (JPY) per 500 kilograms. After an initial period of three years following registration, a compulsory inspection is undertaken every two years. Up to the fifth inspection, the owner must pay JPY 8 200 per 500 kilograms of the vehicle's weight. Moreover, the tax rate for acquiring a car is 5% of the purchase price for non-business users, and 3% for business users. However, the government plans to phase out this tax, once the rate of the consumption tax raises to 10%, from 8%.
In many cases, sub-national governments collect road user fees in order to finance infrastructure investment and to manage congestion at the same time. Some countries, including Sweden and the United Kingdom, apply road user charges – another form of direct motoring taxation – at the level of city government. In 2006, Stockholm introduced a congestion tax to help finance a ring road around the city of Stockholm. The Swedish city of Gothenburg followed suit, introducing its own congestion tax in 2013. In the United Kingdom, meanwhile, the London congestion charge requires drivers to pay to enter the charging zone between 7:00 a.m. and 6:00 p.m., Monday to Friday. The congestion charge is GBP 11.50 per day, or GBP 10.50 if using the automated payment system. In 2008, the London congestion charge generated net annual revenues of GBP 137 million, 82% of which went into bus improvements, and with a further 9% financing roads and bridges and another 9% providing funding for road safety, pedestrian and cycling facilities, borough plans, and environmental improvements (FHWA, 2010[11]). The London congestion charge also helps to fund Transport for London, a local government organisation responsible for most aspects of London's transport system (Eno, 2014[5]). A number of cities around the world apply congestion charges (Table 3.1). In Osaka Prefecture, Japan, a car acquisition tax contributed JPY 193.4 billion, or 1.3% of prefectural taxes, in the fiscal year of 2013. Meanwhile, a tax on deliveries of light oil contributed JPY 943.1 billion, or 6.4% of the prefecture's total tax revenue.
Road-user charges are also applied in the form of a motorway vignette, as is the case in Switzerland. All users of the Swiss motorways, including motor vehicles and trailers up to a total weight of 3.5 tonnes each, and motor vehicles and trailers with a total weight of over 3.5 tonnes each that are not subject to the heavy vehicle charge, are taxed. In 2016, the price of the Swiss motorway vignette was CHF 40. Failure to correctly acquire and set up the vignette led to a fine of CHF 200.
Vehicle taxes and road-user charges have been also implemented in some countries in Emerging Asia. For example, Singapore applies registration fees and excise duties for car ownership, a system of road tax for cars, a special tax on diesel cars, and a road-tax surcharge for vehicles over ten years old. In January 2018, Singapore also rolled out a new vehicle emissions scheme. The country first implemented its congestion-charging and road-pricing system in 1975, in the form of an area license system. This scheme charged drivers a flat rate for unlimited entries into the city’s central area. In 1998, Singapore replaced this with an electronic road-pricing system. The implementation of this new system cost about 200 million dollars (SGD), half of which was allocated to the free installation of in-vehicle units. Users then inserted a card into the unit to make a payment while passing through the gantries. In 2003, the system raised annual revenue of approximately SGD 80 million, and its annual cost in terms of operations and maintenance was around SGD 16 million. In 2009, the system collected SGD 149 million, and SGD 159 million in 2010. The revenue generated from the system goes into the government’s consolidated fund to pay for government expenditures, including the construction and maintenance of roads, and public transport.
In its 2016 budget, India planned to introduce a so-called infrastructure cess, which is similar to an excise duty. The rate was to be 1% for small cars no longer than four metres, with an engine capacity no greater than 1 200 cc, and that use petrol, LPG, or compressed natural gas. This rate rises to 2.5% for diesel cars that are four metres long or less and have an engine capacity no greater than 1 500 cc. For cars with higher engine capacities, the rate rises further, to 4%. In addition, India planned a further 1% luxury tax on cars costing over a million Indian rupees (IND).
Capturing increases in land value to help pay for infrastructure
Finding ways to capture some of the value that new infrastructure creates along its path – such as increased real estate value – can help to fund transport infrastructure projects. Tax increment financing (TIF) is one example of a tool that can capture such increases in land value. Its usual application is to allow local authorities to fund regeneration projects. It starts with a new development project that is expected to attract new businesses and, in turn, to boost locally-collected business taxes. The local authorities will then source funds for a specific infrastructure project against the predicted additional tax revenues, with or without a private-sector partner. The TIF tool is, however, often considered risky. Even though high demand for property and high land values in large cities make it feasible to apply TIF, it is not a scheme that would work for all cities, especially not smaller ones.
In the United States, TIF was first introduced in California in the 1950s, and its use has expanded significantly since the 1970s. Almost all US states now have legislation in place allowing them to use TIF to promote urban renewal. New York City is deploying its first TIF scheme to fund an extension of subway line seven to the west side of Manhattan. The project is a key part of the Hudson Yards development programme. The city is financing the Hudson Yards subway line extension through the issuance of bonds to be repaid by future tax revenues from the anticipated increases in the value of land and property.
The United Kingdom is another country that applies TIF at the local level. By using TIF, local authorities can raise finance from the Public Works Loan Board to fund infrastructure projects, with the private-sector partner funding the subsequent commercial development. The local authorities will then use the increased business rates from the resulting development to repay the debt. One example is the Nine Elms redevelopment project in London, the first project in the United Kingdom to be funded through the TIF tool. In a first step, the Greater London Authority (GLA) takes out a loan of up to GBP 1 billion to fund the Northern Line underground network extension project, with a repayment guarantee provided by the UK government. Loan repayments will be paid back partly through future growth in business rates revenue within the Nine Elms Enterprise Zone. In addition, a community infrastructure levy, and revenues from so-called “Section 106” agreements (private agreements between local authorities and developers), will also be used to pay back the loan. A case-study analysis of the Northern Line extension project, found that the advantages of TIF appear to exceed the associated disadvantages, though it should be applied wisely since it is considered as a new tool in the United Kingdom (Roukouni et al., 2014[13]).
Another good example of using specific taxes to fund infrastructure comes from the Japanese city of Fukuoka, which applies a city planning tax, a spa tax, and a business-office tax. Firstly, the city authorities collect the city-planning tax from owners of land and property within designated urban areas in Fukuoka. This amount collected goes into city-planning projects such as building streets, bridges, parks, and sewerage, and also into land-readjustment projects. Secondly, the city authorities collect a spa tax from users of mineral spring baths. This covers the costs and expenses of building facilities for environmental sanitation, mineral-springs management, tourism, and fire-control, and also promoting tourism. Thirdly, there is a business-office tax whose purpose is to cover the costs of projects to manage and improve the urban environment. The base for this tax extends to corporations or individuals who operate businesses in Fukuoka with a total office-floor area of at least 1 000 square metres, or at least 100 employees.
Similarly, Osaka's municipal tax system applies a fixed-asset/city-planning tax, and a business-facility tax. The first of these is imposed on owners of fixed assets, including land, housing, and depreciable property. Additionally, those who pay taxes related to land and housing also pay a city-planning tax, which helps to finance city-planning projects. The base of Osaka's other special-purpose tax – the business-facility tax – extends to corporate or individual operating businesses in general. In 2015, the city-planning tax contributed JPY 1.2 trillion, or 6% of the total municipal taxes in Japan (MIC, 2015[14]).
Private sector participation in infrastructure financing
The large infrastructure gap in Emerging Asia requires the use of new approaches to financing. The public sector will remain as the primary source of credit in the near term. Nonetheless, maximising private participation will be vital in closing the financing gap. The private sector can participate in infrastructure financing by investing in infrastructure projects and by participating in PPP projects. Institutional investors such as banks, pension funds and insurance companies are the largest source of private sector capital. Evidently, banking sectors and local capital markets in the region are generally still maturing in terms of depth, human resource expertise, and regulations. While Asian economies have arguably broadened their offshore capital market linkages over the years, factors such as low credit ratings for foreign currency debt, exchange rate risks, and the cost of compliance with the requirements of offshore markets, also hamper cross-border capital-raising activities.
This section will discuss the potential and challenges to increase private sector participation in infrastructure financing, including: i) deepening capital pooling mechanism in particular, infrastructure bonds, and ii) developing capital market, after the brief overview of recent trends of financing from the private sector.
Financing from private sector increases in the region, though varies between countries
From 2007 to 2016, the private sector invested almost USD 353 billion in infrastructure in Emerging Asia.4 The outlay during this period exceeded by more than 60% the USD 217 billion injection from 1997 to 2006 in current prices. Still, the amount actually fell as a proportion of GDP – from 0.8% to 0.3%. In the ten years running up to 2016, roughly USD 118.9 billion was allotted to transport projects, of which land transport accounted for USD 108.1 billion.5 On both counts, investment levels were substantially higher than in the preceding decade, by factors of 2.1 and 3.1 respectively. The number of projects with private sector participation also rose, from 1 038 projects in 1997-2006 to 1 594 projects in 2007-16, according to the World Bank PPI database. Transport was the focus of 399 projects in the most recent decade. Of these, 340 dealt with land transport in particular (Table 3.2).
The extent of private ownership in publicly awarded projects in Emerging Asia from 2007 to 2016 is comparable to that of Europe and Central Asia, Latin America, and sub-Saharan Africa.6 As regards ownership in transport projects, the private sector's share in Emerging Asia is lower than in Latin America, but higher than in Europe, Central Asia, sub-Saharan Africa, the Middle East, and North Africa. Meanwhile, private ownership in land transport projects in the region is middling relative to other geographic clusters, with projects in the Middle East, North Africa and Latin America either fully, or almost fully, privately owned.
From 2007 to 2016 in Emerging Asia, the sub-category of land transport accounted for more than 85% of transport projects, and more than 90% of investment pledges. Country-level data show that India hosted most of these projects, i.e. about 85.6% of the total projects in the region, and almost 70% of the commitments for Emerging Asia. Meanwhile, about 8.5% of the projects, and 24% of the investment commitments, were in China, with ASEAN accounting for the remainder. Between 1997-2006 and 2007-16, project count in India grew by 157.5%, while investment pledges rose more than nine-fold. In China, the project count slid by 65.9%, but pledges increased by 57.5%. In Southeast Asia, meanwhile, project count and investments decreased by 28.6% and 21.2%, respectively, even though Indonesia and the Philippines recorded increased activity.
The ratio of investment commitments to project count helps to delineate the scale of infrastructure projects in which the private sector can participate. Generally speaking, it appears that private-sector involvement in China is limited to infrastructure projects with smaller overall values than is the case in India and Southeast Asia (Table 3.3). Compared to the period from 1997 to 2006, project involvement and total investment commitments in current prices broadened from 2007 to 2016 in India and all ASEAN economies except Malaysia although holding the level of prices constant shows that investment commitment in Emerging Asian countries fell between the two periods with the exception of Cambodia, Lao PDR and Thailand. The bulk of these projects and investment commitments in the most recent decade were in the Philippines, Indonesia, Thailand and Lao PDR. Nonetheless, the picture changes if transport projects are isolated. In this case, average investment per project from 2007 to 2016 is much higher in China compared with India and Southeast Asia. The scale of average project investment for transport projects in China has more than doubled from the previous decade. Data for China show that the private sector infuses more capital into each land transport project than it does into transport projects generally.
Investing in infrastructure through various channels
In terms of investment channels, market participants can either invest in equity, debt or hybrid instruments (Table 3.4). As discussed in the subsequent paragraphs, debt financing like bank loans and bond issuance is the most common mechanism to support infrastructure projects in many countries including those in Emerging Asia. Capital placement in fund pools like infrastructure funds, when available, is also used to attract investors who prefer to expose themselves only indirectly to corporations and special-purpose vehicles (SPV) that are working on infrastructure projects (OECD, 2015[16]). Alternatively, Islamic financing options have likewise been utilised and appear to have considerable potential to contribute to infrastructure financing in Emerging Asia in the coming years (Box 3.1).
In terms of risk management, the financing practice in recent years has tilted towards project financing as opposed to corporate financing, mainly due to considerations of credit flexibility and credit risk. As an aside, raising capital through corporate-listed equity, corporate-listed bonds, or corporate loans is referred to as corporate financing, whereas raising capital through SPV equity sales, SPV bond floats, and SPV bank loans, is referred to as project financing. This is preferred because corporations are generally not inclined to hold obligations on their balance sheets that will only start to pay out after several years, but this is a typical characteristic of an infrastructure investment. And while financial products such as bullet bonds, which only pay at maturity, are available to corporates, there is still a very limited market for these instruments in Emerging Asia.
Islamic financing vehicles are increasingly becoming an important source of infrastructure financing in some parts of the region. Although the issuance of Sukuk, or so-called Islamic bonds, remains modest, representing less than 1% of the USD 102.3 trillion of outstanding global bonds, Fitch Ratings expected it to grow by 26% in 2017. As of August 2016, Malaysia was the hub for around 41% of Sukuk issuances for infrastructural and corporate investments, and has issued 61% of the world’s Sukuk in support of infrastructure development (S&P Global Ratings, 2016[17]). Indonesia trails behind with 26% of all the issuances. Sharia-compliant private-equity funds, although still largely underdeveloped, are also being explored as a potential source of capital.
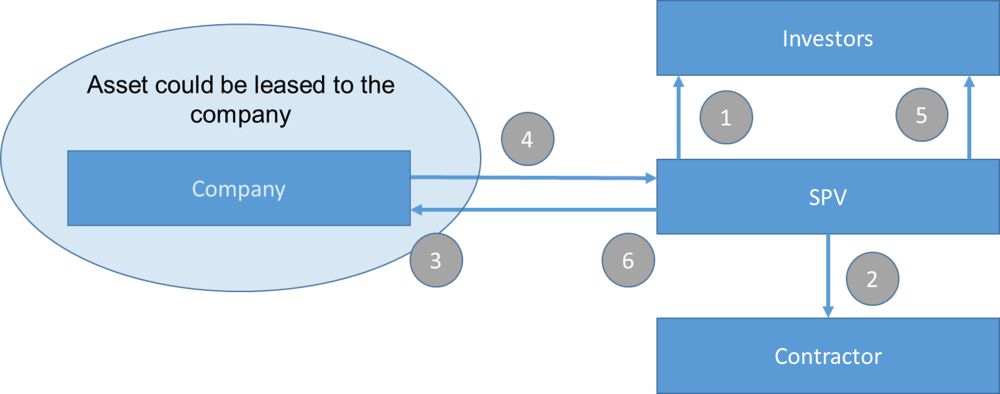
In general, Sukuks have underlying assets from which income is generated. For infrastructure use, one mode is the Istisna’a Sukuk, which is “a contract of sale of specified items to be manufactured or constructed, with an obligation on the part of the manufacturer or builder (contractor) to deliver them to the customer upon completion” (Reda, 2017[18]) (Figure 3.2).
Note:
1. The Issuer (SPV) issues Sukuk to raise funds from investors.
2. SPV uses the proceeds to pay the contractor under the Istisna'a contract to build and deliver the project.
3. SPV sells the assets to the company under another Istisna'a contract.
4. The company makes periodic payments.
5. SPV distributes payments to investors.
6. Upon completion, the asset is delivered to the company.
Source: Abdelkafi, R. and H. Bedoui (2016[19]), “Challenges in infrastructure financing through sukuk issuance”, http://www.irti.org/English/Research/Documents/WP/449.pdf.
However, Abdelkafi and Bedoui (2016[19]) argued that structuring Sukuk for infrastructure presents a number of challenges, particularly for developing countries. Aside from complying with Sharia law, other concerns include the payment of benefits, the tradability of Sukuk during the design and the construction phases of the project, and coming up with a pipeline of bankable projects that take into account an array of risks. Even in Istisna’a, the authors noted that differentiating the ownership of the infrastructure project and the ownership of the land where the project is constructed, can be a problem in the absence of well-founded Islamic securitisation statutes.
Developing infrastructure bonds
Specific-purpose borrowing – the issuance of debt instruments such as bonds to finance a particular project, where the income that the investment generates can then repay the debt – has commonly been used to finance infrastructure in some OECD countries, particularly in North America. Revenue bonds are one of the main sources of debt financing for public infrastructure in the United States and Canada (Chan et al., 2009[20]). Public sector borrowing at the sub-national level, which has been used in many OECD countries – is another potential tool to explore in Emerging Asian countries. In the United States, municipal bonds are largely used to fund infrastructure projects including schools, hospitals and transport infrastructure. Although some countries in Emerging Asia, such as the Philippines and India, have already started using municipal bonds, the potential to further explore this tool in the region is still large.
The issuance of infrastructure bonds in Emerging Asia has generally picked up since early 2000, especially in China and Malaysia, although a pullback in issuance has been apparent of late (ADB, 2016[21]). Bond floats markedly increased between 2010 and 2012. Ehlers, Packer and Remolona (2014[22]) posited that the improvement in financial-market confidence beginning in 2009, and the increased interest of investors in bond markets in emerging economies, contributed to the rise in the use of bonds to finance infrastructure projects. Notably, between 2009 and 2013, infrastructure bonds in China soared to over three times the value of outstanding syndicated infrastructure loans in the country, which likely related to the large scale growth stimulus intended to spur the economy.
Issuances have generally slowed down in many economies since 2012-13, presumably due to the ongoing structural reforms in some countries (i.e. reducing growth reliance on investment in favour of consumption in China). A marginal deterioration in growth prospects and banking sector health as well as political certainty in other countries in the region may also have contributed to this. By end-2015, outstanding infrastructure bonds in Asia stood at roughly 5% of GDP (ADB, 2016[21]), about half as big as in Europe, indicative of the relative underdevelopment of the region’s capital markets (Figure 3.3).
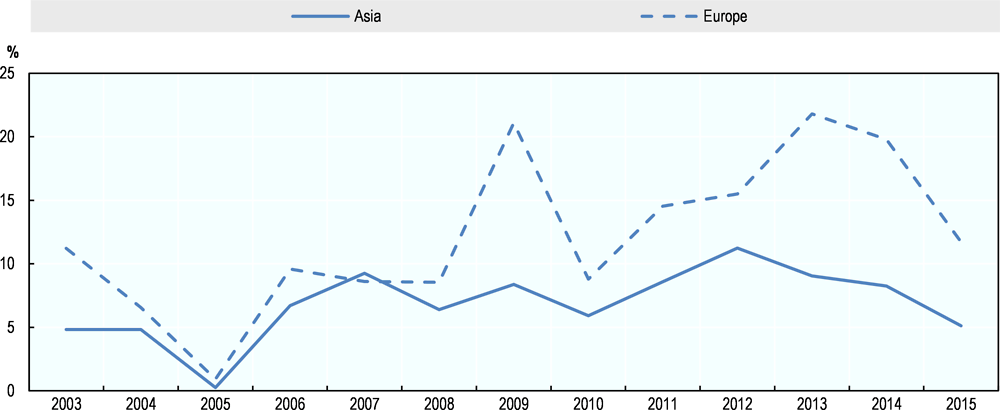
Note: Simple average values for the gross domestic product of all economies in each region are used.
Source: ADB (2016[21]), Asia Bond Monitor, https://www.adb.org/publications/series/asia-bond-monitor.
Developing capital markets
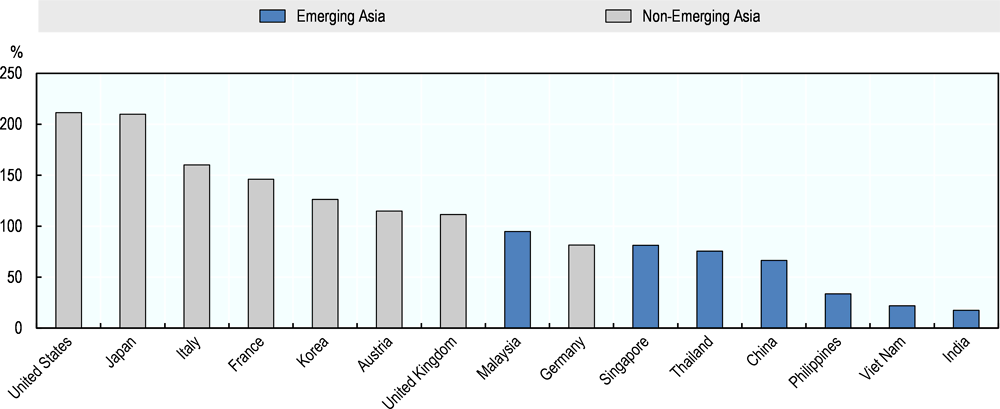
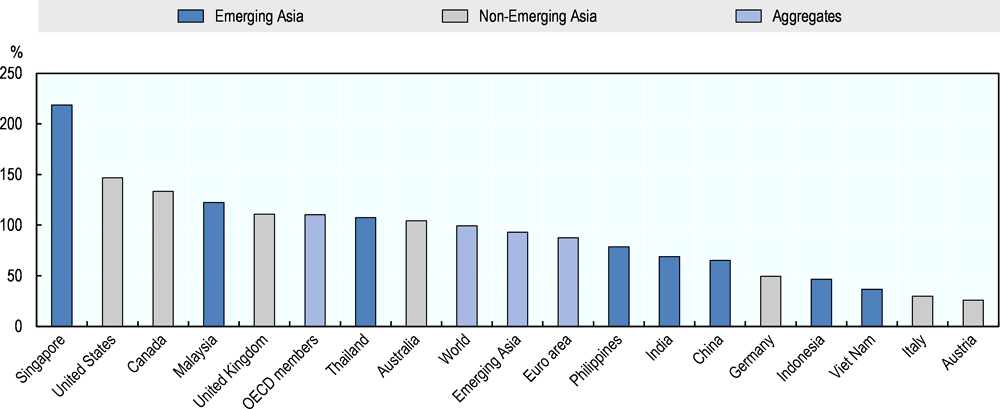
Increasing the private sector's participation in infrastructure investment in Emerging Asia means developing financial markets, as countries in the region generally tend to be bank-centric. In terms of the bank-lending-to-GDP ratio, a number of economies in Emerging Asia stand above the average levels for the OECD and the world. Such countries include China, Singapore, Malaysia, Viet Nam and Thailand (Figure 3.4). In terms of outstanding local currency bonds, the depth of markets in countries in Emerging Asia relative to the size of their economies is shallower than in OECD countries such as Japan and Korea (Figure 3.5). In terms of the ratio of equity market capitalisation to GDP, Singapore, Malaysia and, to a certain extent, Thailand, have markets that are just as developed as many advanced economies. Still, despite the substantial increase in capital placements over the years, the other economies in Emerging Asia appear to lag behind in this respect (Figure 3.6).
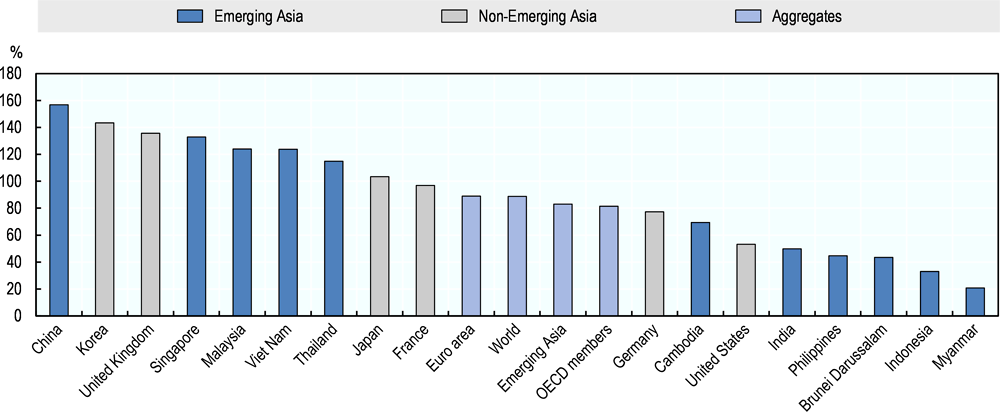
Source: World Bank (2018[23]), World Development Indicators (database).
Source: OECD Development Centre calculations based on data from the European Central Bank, the US Securities Industry and Financial Markets Association, and the IMF; ADB AsianBondsOnline.
Source: OECD Development Centre calculations based on data of World Federation of Exchanges and IMF. Aggregates were taken from World Bank World Development Indicators Database.
A comparison of the assets under management of non-bank financial institutions (NBFIs), and the assets of deposit-taking institutions, indirectly implies that households' savings preferences have been gradually shifting towards the services of NBFIs and away from banks. Based on the World Bank's Global Financial Development database, the ratio of bank assets to NBFI assets has shrunk from more than 5.0 in 2000 to below 1.7 in 2015 in the developing countries in East Asia and the Pacific. The same trend can be observed in the developing countries in Latin America and the Caribbean, even if the ratio there still stood at over 6.5 in 2015. Openness among households to invest in fund pools, insurance policies, and other products outside of traditional deposits can be a catalyst in developing Asia’s capital markets in the coming years.
As it stands, syndicated loans have remained as the primary funding mechanism for infrastructure both in Emerging Asia just like in advanced economies, even if bonds have been used with increased frequency in recent years. The PPP Center of the Philippines, for instance, commented in 2017 that while bonds and equity have been used to bankroll some PPP infrastructure projects, domestic capital markets have not been a significant source of PPP infrastructure finance. Data show that about PHP 67 billion (14%) of the almost PHP 488 billion raised on the local stock exchange between 2013 and 2016 was for infrastructure projects while PHP 115 billion, or 18% of the outstanding PHP 646 billion of non-government bonds at year-end 2016 was for energy, telecommunications and toll roads.
Nonetheless in the process of developing the capital markets and harnessing a fund pool for big ticket projects, it is equally important that oversight is not compromised. In the case of infrastructure, mechanisms that reduce the likelihood that projects end up contributing to financial-market risk have to be enhanced. These mechanisms are partly related to the efficiency of capital use, the strength of due-diligence frameworks, and regulatory stability. To this end, the OECD provides a useful set of governance guidelines that may be applicable in certain country contexts (Table 3.5).
Using PPPs effectively
An important feature of PPPs is that, in addition to bringing in capital from the private sector, the involvement of private partners can also make infrastructure projects more efficient. Agreements to proceed with an infrastructure project in the form of a PPP usually take the form either of a build-operate/maintain-and-transfer (BOT) deal, a design-build-and-operate/maintain (DBO) arrangement, a design-build-finance-and-operate (DBFO) plan, or a build-own-and-operate/maintain (BOO) contract. In DBO models, the private partner does the work from the design stage through to operations, but the public sector finances the pre-construction and construction costs. In this model, private contractors usually receive transfers of funding in tranches, according to the outcomes they deliver. Given this set-up, the financing risk that the private partners in DBO-type contracts take on is minimal (World Bank, 2016[25]). In the other models, however, private sector partners take on a greater degree of financial risk, reflecting the need to secure financing for a project cycle that stretches over a longer period of time – from either the pre-construction or the construction phase right through to the post-construction phase. A variety of external and project-specific risks face public and private partners (Table 3.6). Among other factors, these risks differ according to whether the base infrastructure already exists and the government intends to privatise it – in which case it is akin to a brownfield investment – or if everything has to be built up from scratch, in the manner of a greenfield investment (ASIFMA/ICMA, 2016[26]).
The investor can recover part of the costs of building the infrastructure, or of operating and maintaining it, by charging its users a cost of service. For example, operators may collect fees at toll barriers on roads, or charge users to access the water network. The fee is usually subject to regulations – such as caps on price, revenue or rate of return – in order to encourage efficient and fair charges. The regulatory asset base model is one of the methods that regulators can use in setting price or revenue caps in order to calculate the efficient cost of service provision. In the price-cap model, the regulator sets prices and then indexes them, usually against factors such as inflation, and may then also adjust for assumed improvements in efficiency. For example, toll roads collect user fees to recover construction costs, or to fund their maintenance. Nevertheless this means that the owner is exposed to demand risk. Prices are reviewed periodically – every one to five years, for example. That said, while the use of user fees in the region is well-documented, data on the amount this mechanism generates, and the scope it covers in financing infrastructure, are very scant.
Public-private partnerships have a long history, even if they have not gained traction in Emerging Asia as they did in Europe early in their development. Despite a number of countries seeking to lay the legal and administrative groundwork for PPPs in the 1990s, factors such as institutional weakness, inadequate capital markets, and a lack of technical expertise, took away from the attractiveness of such deals. However, over the past decade or so, governments in Emerging Asia have been more aggressive in creating business environments suitable for PPPs. Moreover, listed infrastructure funds are also becoming more common in the region (Box 3.2).
Inderst (2016[2]) estimated that the market capitalisation of infrastructure companies across Asia is roughly 2-2.5% of GDP – roughly half of the global average of around 4% of GDP. Likewise, listed infrastructure funds are not as common in Asia as they are in the OECD countries. The Macquarie International Infrastructure Fund (MIIF) was one such facility that focuses on infrastructure in Emerging Asia, particularly in China. However, the fund wound down in 2012, after being set up and listed on the Singapore Exchange (SGX) only a few years earlier, in 2005. Observations that the share price did not adequately reflect the value of MIIF’s infrastructure businesses, and that MIIF’s did not have the most appropriate structure to reflect the value of its businesses underpinned the divestment decision. By the time divestments began in December 2012, the group net asset value of the fund stood at a little less than SGD 830 million (USD 678.3 million), according to the MIIF annual report in 2013. Divestments, and a subsequent delisting from SGX, were completed in late 2015.
A similar vehicle was recently launched in India, and listed on the Bombay Stock Exchange. The IRB InvIT Fund, which hit the market in May 2017, became India’s first infrastructure-investment trust fund (InvIT). The fund attracted more than IND 50 billion in equity investments (USD 782 million), and was oversubscribed by a factor of 8.6 (Oberoi, 2017[27]). The initial public offering of the IRB InvIT fund was possible in part thanks to the Securities and Exchange Board of India's implementation of regulations on infrastructure investments. Other infrastructure developers in India are expected to follow suit in the next few quarters. Apart from the two aforementioned funds, there do not appear to be any other notable listed funds dedicated to infrastructure financing in Emerging Asia at the moment.
Unlisted infrastructure funds seem to attract the interest of investors in the region more than listed funds. Between 2008 and May 2015, around 79 Asia-focused funds raised more than USD 24.6 billion in new capital, or roughly USD 3.3 billion a year (Preqin, 2015[28]). Combined, China; Chinese Taipei; and Hong Kong, China were the focus of ten of these funds, which raised over USD 5.3 billion during the period. The economies in Association of Southeast Asian Nations (ASEAN) were the beneficiaries of 13 funds, accumulating roughly USD 4.5 billion. Meanwhile, South Asia was the focus of another 13 funds that raised USD 3.8 billion – mostly bankrolling projects in India. Japan and Korea were the recipients of 28 funds that pooled more than USD 6 billion in capital over the period. The other 15 funds that attracted over USD 5 billion in roughly seven-and-a-half years focused on other parts of the region.
Deducing from the data of Preqin, the annual amount of fundraising in Asia has been increasing over the past few years. From about USD 5.2 billion in 2013, it declined to USD 4.3 billion in 2014, but has gone up since then to USD 6.6 billion in 2015 and to USD 7.6 billion in 2016. However, putting these numbers into global perspective suggests that infrastructure funds in Asia are still at a nascent stage. Asia’s average of USD 5.9 billion between 2013 and 2016 is only about a third of the averages of Europe (USD 18.1 billion) and North America (USD 19.5 billion). That the biggest institutional investors are not domiciled in the region is a challenge in fundraising.
The Philippines, which has used PPPs as a mode of infrastructure procurement and financing, offers useful examples of how such infrastructure projects can be implemented in the region, and also points to some of the challenges. The Philippines adheres to the basic tenets of creating an enabling environment for PPPs. The first of these is to have a long-term policy and vision for the role of PPPs in infrastructure investment. The second is to have an appropriate legal and regulatory framework, including procurement rules and dispute-resolution mechanisms. The third tenet has been to build up institutional capacity – through the PPP Center – for shepherding projects along. Fourthly, there has been financial support, thanks to the establishment of a viability gap fund, and a so-called Project Development and Monitoring Facility (PDMF).
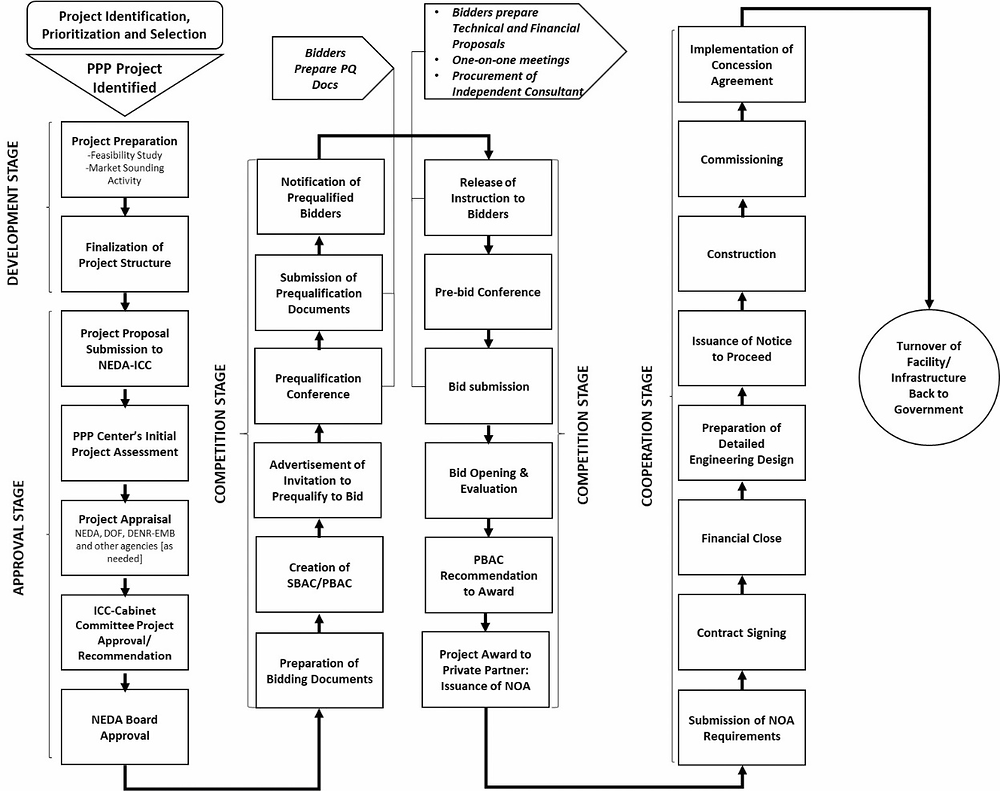
Source: PPP Center (2015[29]), “PPP Project Cycle”, https://ppp.gov.ph/?infographics=ppp-project-cycle.
The creation of the PPP Center by way of Executive Order No. 8 as a central coordinating and monitoring unit for all PPP projects has boosted their use in the procurement and financing of infrastructure. The PPP mode of infrastructure procurement follows clear processes and procedures (Figure 3.7).
The weak capacity of government agencies to process PPPs is one of the problems that have caused delays in the tendering process. To address this, the PPP Center is pushing ahead with capacity-building activities, as do the units of government that implement projects, and the agencies that provide oversight. Moreover, to improve the monitoring of quality-at-entry and implementation, and as mentioned briefly above, the country set up the PDMF to provide support with project development and monitoring. The PDMF is a revolving fund for the preparation both of pre-feasibility and feasibility studies, and of tender documents for PPP projects. It also provides assistance with regard to the bidding process.
The PPP Center has issued several policy circulars to improve the PPP process. Policy Circular 03-2015 aims to institutionalise best practices in the PPP procurement process and in project implementation across government. These best practices include the following:
-
Sounding out the market to assess the private sector’s ability to assume risks through a PPP contract.
-
One-on-one meetings with pre-qualified bidders to clarify any questions, comments, or concerns they may have, and to discuss the key terms and conditions of the draft PPP agreement.
-
Conflict-management planning to ensure full disclosure of all of the firm’s clients that are participating in a particular PPP project.
-
Control testing to determine the bidder’s compliance with the nationality requirement for PPP projects whose operation requires a public-utility franchise.
-
The appointment of an independent consultant or engineer to ensure the successful and timely delivery of projects through the provision of efficient, fair, and transparent technical services to the contracting parties.
-
A virtual data room to allow the implementing agencies to manage bidders' information requirements during the project-tender process in an efficient and timely manner.
The Philippines has also started to provide viability-gap funding for PPP projects for which user charges would not be sufficient to ensure their commercial viability. The PPP Center issued Policy Circular No. 04-2015 to institutionalise viability-gap funding for PPP projects. This financial support is only available for solicited, concession-based PPP projects. It takes the form of a cash subsidy – a contribution of the government to the project. One of the PPP characteristics currently seen in the region is that more of the weight of risk is put on the public side compared to the private side, suggesting that further participation of private sector in risks sharing will be needed in the long term.
Another policy in the Philippines sets out to assess PPP projects' value for money (Policy Circular No. 09A-2016) by institutionalising value-for-money analysis in all PPP projects. The circular enjoins implementing agencies to apply this analysis at the project-development stage, in order to assess the appropriateness of making projects into PPPs, and to assess whether they will provide better value for money than the traditional procurement option. Meanwhile, Policy Circular 05B-2017, a very recent initiative, concerns the appointment of probity advisors for PPP procurement. The probity advisor acts as an independent observer and critic on all aspects of the procurement process, from the very beginning up to the signing of a contract with the selected bidder.
Development of infrastructure funds
In order to ensure the efficient administration of earmarked taxes, fees, and other non-tax revenues (such as proceeds from privatisation or mineral extraction), many OECD countries have infrastructure funds. These are seen as the most practical way of keeping earmarked revenues separate, and to save them for special expenditures (OECD, 2013[30]).
In Switzerland, revenues from different sources are deposited in three infrastructure funds. The most important of these funding instruments is the Special Financing of Road Traffic (SFRT) Fund. Switzerland introduced this fund in 1958 in order to finance the construction of the country's motorway network. Its main sources of funds are the petroleum tax and the motorway vignette. Furthermore, the SFRT fund contributes to the two additional Swiss transport funds that have been introduced more recently. The first of these is the Major Railway Projects Fund, which dates from 1998, and which funds major extensions to the railway network. Secondly, there is also the “Infrastructure Fund”, which dates from 2008, and funds works to complete the motorway network and eliminate motorway bottlenecks, in addition to metropolitan road and rail transport projects. The railway projects fund also receives inflows from the heavy vehicle fee, as well as a small share of VAT (OECD, 2012[31]).
One of the advantages of the Swiss infrastructure funding system is that it guarantees reliable, long-term financing for transport infrastructure, unaffected by the imponderables of the budget process. This system has supported a range of ambitious transport infrastructure projects in Switzerland (OECD, 2011[32]).
Among the countries of Emerging Asia, Thailand and the Philippines make use of infrastructure funds, while, at a regional level, ASEAN Member States have access to the ASEAN Infrastructure Fund (Box 3.3). In December 2015, the Thai government approved the Thailand Future Fund (TFF) and slated it for launch as soon as possible, raising 100 billion baht (THB) (USD 2.8 billion) of initial capital for infrastructure projects. The plan is to list the TFF on the Thai stock exchange, with the finance ministry and the country's Vayupak Fund contributing THB 10 billion of seed capital. The fund will expect participation from domestic and foreign investors on a long-term basis. Several institutional investors have shown interest in investing in the TFF, including sovereign wealth funds (SWFs) from foreign countries.
Initial expectations are for the AIF to provide loans of up to USD 300 million a year, having a lending commitment through 2020 of up to USD 4 billion. The AIF was incorporated in April 2012, with equity contributions from nine ASEAN members (Brunei Darussalam, Cambodia, Indonesia, Lao PDR, Malaysia, the Philippines, Singapore, Thailand and Viet Nam) plus the ADB. For example, the Philippines’ initial equity contribution was USD 15 million (Table 3.7).
AIF became operational in 2013. The first project that it funded was the 500 kilovolt Power Transmission Crossing Project between Java and Bali in Indonesia, in December 2013. The funding was distributed as follows: the AIF contributed USD 25 million, the ADB contributed USD 224 million, and the Indonesian government contributed USD 161 million (ASEAN, 2013[33]). AIF targets six infrastructure projects annually, to be selected according to economic and financial criteria and the impact they will have in terms of poverty reduction (Llanto, Navarro and Ortiz, 2016[34]).
SWFs are increasingly investing in infrastructure. In 2016, they amounted to 62% of investment made in infrastructure globally and 48% of infrastructure investment made in Asia. Furthermore, SWFs’ investment account for 95% of energy and 86% transportation investments (Preqin, 2016[36]). Advanced economies offer secure revenues but attention is also paid to emerging markets. For instance, the third largest SWF by assets under management, the Abu Dhabi Investment Authority (ADIA), agreed in October 2017 to invest USD 1 billion in India’s National Investment and Infrastructure Fund (NIIF) set in 2015. This made possible the recent investment of NIIF in partnership with DP World to India’s port infrastructure.
Emerging Asian SWFs are also investing in infrastructure elsewhere in the region. Singapore’s two SWFs are good examples. Established in 1974, Temasek Holdings’ asset amount to USD 197 billion as of March 2017. More than half of its portfolio is invested in Asia (excluding Japan and Korea), and in terms of sectors, 17% of assets are put into transportation and industrials. One of its investment themes involves infrastructure investments to growing economies including Emerging Asia, which could explain the active talks with NIIF for investments in India’s infrastructure. The Government Investment Company (GIC) Private Limited, established in 1981, is the eighth largest SWF by assets under management with a capital of USD 359 billion. It increased its exposure to infrastructure assets in emerging markets by investing in IFC Global Infrastructure Fund in 2013. Recently, it has invested in renewable energy in India, the Philippines and Japan. Other SWFs are also investing in infrastructure in the region to different extents, including China Investment Corporation (CIC) which is the second largest SWF with assets worth USD 900 billion, Khazanah Nasional Berhad of Malaysia worth USD 38.7 billion and State Capital Investment Corporation of Viet Nam worth USD 500 million as of February 2018 (SWFI, 2018[37]).
The Philippines Investment Alliance for Infrastructure (PINAI) fund is a private-equity fund co-financed by pension funds and the ADB. It is a closed-end fund with a time horizon of ten years, and it dedicates its activities to equity investment in infrastructure in the Philippines. The government came up with the concept of this fund with the aim of attracting and facilitating institutional investment. It had its first and final close in July 2012, raising PHP 26 billion (around USD 625 million). PINAI is managed by Macquarie Infrastructure and Real Assets. More precisely, its financial investors are: the Philippines’ state-owned pension fund for government employees (the Government Service Insurance System, or GSIS), the Dutch pension fund asset manager Algemene Pensioen Groep, the Macquarie Group, and the ADB. The GSIS, contributed the largest equity share at 64%. The fund's overall structure is a combination of direct investors (GSIS and APG), and a pooling vehicle known by the acronym MIHP (Figure 3.8). One of the unique aspects of the PINAI fund is the close relationship between its manager and the investors, since the number of parties involved are small. The investors also have a good understanding of the market and investment climate.
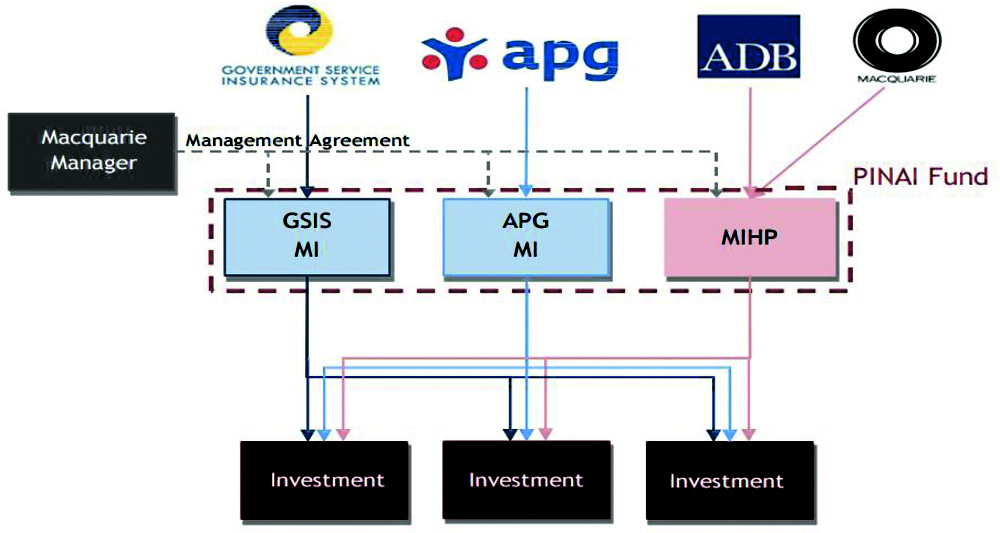
Source: OECD (2014[38]), “Pooling of institutional investors' capital: selected case studies in unlisted equity infrastructure”, https://www.oecd.org/finance/OECD-Pooling-Institutional-Investors-Capital-Unlisted-Equity-Infrastructure.pdf.
The PINAI fund seeks to invest in a portfolio of greenfield and brownfield infrastructure projects in the Philippines, notably in ports and airports, mass transit systems, rail and roads, water and waste, utilities, power generation and transmission, renewable energy, gas distribution, and telecommunication infrastructure projects. The fund's target is to invest between USD 50 million and USD 125 million in each project. In 2015, PINAI invested in solar plants acquiring majority stakes in San Carlos Solar Energy Inc., (SaCaSol) inaugurated in 2014 with a capacity of 45 megawatts, and in Negros Island Solar Power (islaSol) launched in 2016 with a capacity of 80 megawatts.
References
[19] Abdelkafi, R. and H. Bedoui (2016), “Challenges in infrastructure financing through sukuk issuance”, No. 2016-3, Islamic Research and Teaching Institute, http://www.irti.org/English/Research/Documents/WP/449.pdf.
[21] ADB (2016), Asia Bond Monitor, Asian Development Bank, Manila, https://www.adb.org/publications/series/asia-bond-monitor.
[35] ADB (2011), Proposed equity contribution and administration of ASEAN Infrastructure Fund, Asian Development Bank, Manila, https://www.adb.org/sites/default/files/project-document/61053/45097-001-reg-rrp.pdf.
[12] Amelsfort, D. (2015), Introduction to congestion charging: a guide for practitioners in developing cities, Asian Development Bank, Manila, https://www.adb.org/sites/default/files/publication/159940/introduction-congestion-charging.pdf.
[33] ASEAN (2013), ASEAN infrastructure fund grants first US$25 million loan to Indonesia, ASEAN Briefing, Jakarta, https://www.aseanbriefing.com/news/2013/12/10/asean-infrastructure-fund-grants-first-us25-million-loan-indonesia.html.
[26] ASIFMA/ICMA (2016), Guide to Infrastructure Financing in Asia, Asia Securities Industry & Financial Markets Association/ International Capital Market Association, http://www.asifma.org/uploadedfiles/asifma%20icma%20guiding%20to%20infrastructure%20financing%20in%20asia.pdf.
[4] Bayliss, D. (2014), Public expenditure, taxes and subsidies: Land transport in Great Britain, Royal Automobile Club Foundation, London, https://www.racfoundation.org/wp-content/uploads/2017/11/Transport_finances_Bayliss_October_2014_final.pdf.
[20] Chan, C. et al. (2009), “Public infrastructure financing: An international perspective”, Productivity Commission Staff Working Paper, Productivity Commission of Australia, http://www.pc.gov.au/research/supporting/public-infrastructure-financing.
[22] Ehlers, T., F. Packer and E. Remolona (2014), “Infrastructure and corporate bond markets in Asia”, in RBA Annual Conference Volume 2014: Financial Flows and Infrastructure Financing, Reserve Bank of Australia, http://www.rba.gov.au/publications/confs/2014/pdf/ehlers-packer-remolona.pdf.
[5] Eno (2014), How we pay for transportation: The life and death of the Highway Trust Fund, Eno Center for Transportation, Washington D.C., https://www.enotrans.org/wp-content/uploads/2015/09/Highway-Trust-Fund.pdf.
[7] EU (2018), The European Commission’s Oil Bulletin, https://data.europa.eu/euodp/data/dataset/eu-oil-bulletin.
[11] FHWA (2010), Reducing congestion and funding transportation using road pricing in Europe and Singapore, Federal Highway Administration, Washington D.C., https://international.fhwa.dot.gov/pubs/pl10030/pl10030.pdf.
[2] Inderst, G. (2016), “Infrastructure investment, private finance, and institutional investors: Asia from a global perspective”, Asian Development Bank Institute, Tokyo, https://www.adb.org/sites/default/files/publication/179166/adbi-wp555.pdf.
[34] Llanto, G., A. Navarro and M. Ortiz (2016), “Infrastructure financing, public-private partnerships and development in the Asia-Pacific region”, Asia-Pacific Development Journal, Vol. 22/2, https://doi.org/10.18356/8bb4209e-en.
[14] MIC (2015), White paper on local public finance 2015, Ministry of Internal Affairs and Communications, Tokyo, http://www.soumu.go.jp/iken/zaisei/27data/chihouzaisei_2015_en.pdf.
[27] Oberoi, R. (2017), First ever InvIT listing: IRB InvIT debuts with small premium at Rs 103.25 on BSE, The Economic Times, https://economictimes.indiatimes.com/markets/stocks/news/irb-invit-fund-lists-at-rs-103-25-on-bse/articleshow/58728276.cms.
[1] OECD (2018), Economic Outlook for Southeast Asia, China and India 2018: Fostering Growth through Digitalisation, OECD Publishing, Paris, https://doi.org/10.1787/9789264286184-en.
[3] OECD (2017), Revenue Statistics in Asian Countries 2017: Trends in Indonesia, Japan, Kazakhstan, Korea, Malaysia, the Philippines and Singapore, OECD Publishing, Paris, https://doi.org/10.1787/9789264278943-en.
[16] OECD (2015), Infrastructure financing instruments and incentives, OECD Publishing, Paris, http://www.oecd.org/finance/private-pensions/Infrastructure-Financing-Instruments-and-Incentives.pdf.
[24] OECD (2015), Towards a framework for the governance of infrastructure, OECD Publishing, Paris, http://www.oecd.org/gov/budgeting/Towards-a-Framework-for-the-Governance-of-Infrastructure.pdf.
[10] OECD (2014), Consumption Tax Trends 2014: VAT/GST and excise rates, trends and policy issues, OECD Publishing, Paris, https://doi.org/10.1787/ctt-2014-en.
[38] OECD (2014), Pooling of institutional investors' capital: selected case studies in unlisted equity infrastructure, OECD Publishing, Paris, https://www.oecd.org/finance/OECD-Pooling-Institutional-Investors-Capital-Unlisted-Equity-Infrastructure.pdf.
[30] OECD (2013), “Budgeting in Luxembourg: Analysis and recommendations”, in OECD Journal on Budgeting, OECD Publishing, Paris, https://doi.org/10.1787/16812336.
[9] OECD (2013), “Climate and carbon aligning prices and policies”, OECD Environment Policy Papers, No. 1, OECD Publishing, Paris, https://doi.org/10.1787/23097841.
[6] OECD (2013), Taxing Energy Use: A Graphical Analysis, OECD Publishing, Paris, https://doi.org/10.1787/9789264183933-en.
[31] OECD (2012), Strategic Transport Infrastructure Needs to 2030, OECD Publishing, Paris, https://doi.org/10.1787/9789264114425-en.
[32] OECD (2011), Transcontinental infrastructure needs to 2030/2050, OECD Publishing, Paris, http://www.oecd.org/futures/infrastructureto2030/48641605.pdf.
[8] OECD/ITF (2008), Transport Infrastructure Investment: Options for Efficiency, OECD Publishing, Paris, https://doi.org/10.1787/9789282101568-en.
[29] PPP Center (2015), PPP project cycle, https://ppp.gov.ph/?infographics=ppp-project-cycle.
[36] Preqin (2016), Sovereign wealth funds investing in infrastructure, http://docs.preqin.com/newsletters/ra/Preqin-RASL-May-16-Feature-Article.pdf.
[28] Preqin (2015), Preqin special report: Asian infrastructure, http://docs.preqin.com/reports/Preqin-Special-Report-Asian-Infrastructure-June-2015.pdf.
[18] Reda, M. (2017), Islamic Commercial Law: Contemporariness, Normativeness and Competence, Brill Publishers.
[13] Roukouni, A. et al. (2014), Is Tax Increment Financing the most effective tool to support urban investment? The case of London Northern Line Extension, http://www.regionalstudies.org/.
[17] S&P Global Ratings (2016), Islamic finance outlook 2017, Standard & Poor's, New York, https://www.spratings.com/en_US/topic/-/render/topic-detail/the-positive-outlook-for-islamic-finance.
[37] SWFI (2018), Sovereign wealth fund rankings, Sovereign Wealth Fund Institute, https://www.swfinstitute.org/sovereign-wealth-fund-rankings/.
[23] World Bank (2018), World Development Indicators (database), https://data.worldbank.org/products/wdi.
[15] World Bank (2017), Private Participation in Infrastructure (database), World Bank, Washington D.C., https://ppi.worldbank.org/data.
[25] World Bank (2016), Types of Public-private partnership agreements, World Bank, Washington D.C., https://ppp.worldbank.org/public-private-partnership/agreements.
Notes
← 1. The report is unclear whether explicit and implicit infrastructure project guarantees were incorporated in the calculation. Country-level definitions of infrastructure and reported expenditure on infrastructure tend to differ.
← 2. Citing Wagenvoort et. al. (2010), Inderst noted that the public-to-private share in infrastructure financing in the member states of the European Union that joined before the enlargement of 2004 is 1:2, while it is 1:1 in the new member states. In the United Kingdom, calculations from HM Treasury in 2014 show the private share to be around 70%. Meanwhile, Inderst reported that, in Asia, the share of the public sector in the total burden of infrastructure investment stood at 90% in the Philippines, 80% in Thailand, 65% in Indonesia, and 50% in Malaysia. Inderst cited figures from Goldman Sachs in 2013.
← 3. Tax rates are as of 1 April 2012 (except for Australia, for which they are as of 1 July 2012).
← 4. The extent of private-sector involvement in infrastructure financing is just as difficult to pin down with accuracy. The World Bank's PPI database of private participation in infrastructure (World Bank, 2017) provides extensive information on private-sector investments in infrastructure that governments have agreed to, although this information is not exhaustive. The database features projects that are fully funded by private equity, and also those for which there was as public contribution. It covers 139 low- and middle-income countries, including 10 from Emerging Asia, and more than over 6 400 infrastructure projects in energy, telecommunications, transport, and water and sewerage sectors since 1990 (Brunei Darussalam and Singapore are seen as advanced economies). The dataset from the custom query option was used, since it is more updated than the Stata version, which only contains data up to the end of 2015 (as of 30 June 2017). For some projects, there is no information on investment levels and it is not explicitly stated that investment levels have been adjusted for exchange rates and/or inflation.
← 5. Land transportation covers sub-sectors labelled under the following headings: “ports, railways”; “railways”; “railways, roads”; and “roads”. The annual data are based on financial closure, the definition of which can be found on the webpage of the PPI database, https://ppi.worldbank.org/methodology/ppi-methodology.
← 6. Emerging Asia is a subset of the East Asia and Pacific and South Asia regions combined, as defined in the dataset. Projects in South Asia that were covered are mostly in India.