Chapter 4. Decentralisation in Ukraine’s Transport Sector: A case study
This chapter explores the prospects for decentralisation in Ukraine’s transport sector. It provides an overview of the state and importance of transport infrastructure in Ukraine’s economy, and of the governance structures supporting it. Urban public transport systems are discussed, particularly with respect to financial and managerial capacity, regulations and standards, and how better mobility data and new technologies can support a more innovative approach to public transport provision in Ukraine. The chapter also highlights the importance of improved logistics performance and strengthened co-operation between ports and port-cities. It concludes with a series of recommendations to carry forward progress in decentralisation within the sector.
The statistical data for Israel are supplied by and under the responsibility of the relevant Israeli authorities. The use of such data by the OECD is without prejudice to the status of the Golan Heights, East Jerusalem and Israeli settlements in the West Bank under the terms of international law.
Introduction
Transport networks are interwoven in the fabric of the economy. When designed effectively, they can be a motor for productivity, integration in global value chains and improved quality of life for citizens. The transport sector plays a fundamental role in Ukraine’s development trajectory and ability to achieve growth, reduce inequalities and create jobs. At the same time, there is growing awareness of the negative externalities that transport may generate: congestion, pollution, and bottlenecks in trade and mobility created by outdated and inefficient infrastructure.
As mentioned in Chapter 1, urban agglomerations are driving Ukraine’s growth. Kyiv, as well as some cities in Central and Western Ukraine, are experiencing population surges that will require infrastructure and adjustments to transport services to accommodate new arrivals. Meanwhile, smaller villages and remote areas will need to contend with changes in demand resulting from an ageing and declining population. To meet these opposing challenges, international experience can help Ukraine in designing and implementing transport policies that yield economic, environmental and social benefits for the entire population.
As part of its decentralisation agenda, Ukraine has included sector decentralisation as a second stage of the process. While the focus of most discussion to date has been on decentralisation in the education, health and social sectors, decentralisation of the transport sector is also being discussed. This chapter presents key challenges faced by the sector, along with good practice case studies and a series of policy solutions to support decentralised development in Ukraine’s transport sector. The analysis was conducted through a combination of interviews during fact-finding missions to Ukraine and secondary sources.
The state of transport infrastructure in Ukraine
The transport sector plays a crucial role in Ukraine’s economy. In 2016, transport and storage accounted for 6.8% of gross value added and 6.1% of the employed population (compared with 4.4% and 4.9% in OECD member countries in 20141). Ukraine’s economy is highly transport-intensive: it took almost 6 tonne-kilometres of freight to produce USD 1 of GDP in 2005, more than ten times the EU average (World Bank, 2010). This is the result of a heavy reliance on the production and export of commodities such as metals, iron ore and grain.
Chronic underinvestment in Ukraine’s transport sector has led to insufficient modernisation of legacy infrastructure inherited from the Soviet Union, high wear and tear, and increasing gaps between transport infrastructure supply and demand (Foundation for Effective Governance, 2011). Investment in fixed assets in the transport industry (excluding pipeline transport) declined to 0.2% of GDP in 2016 (Figure 4.1). Preparations for the Euro-2012 UEFA football championship (co-hosted by Ukraine and Poland) boosted infrastructure spending in 2011-12: for instance, the Ukrainian railway monopoly invested in new rolling stock and introduced a faster railway service between Kyiv, Lviv and Kharkiv. With the exception of 2012, however, Ukraine’s investment in inland infrastructure as a share of GDP has lagged below the OECD average in recent years. The annexation of Crimea in early 2014 and the ensuing conflict in the eastern regions of Donetsk and Luhansk had a significant impact on the sector, with the loss of a number of strategic transport assets (roads, railways, sea ports and airport infrastructure) and important markets. Investment in transport infrastructure was further hampered by fiscal constraints resulting from a significant increase in military expenditures and social programmes to assist internally displaced persons (IDPs).
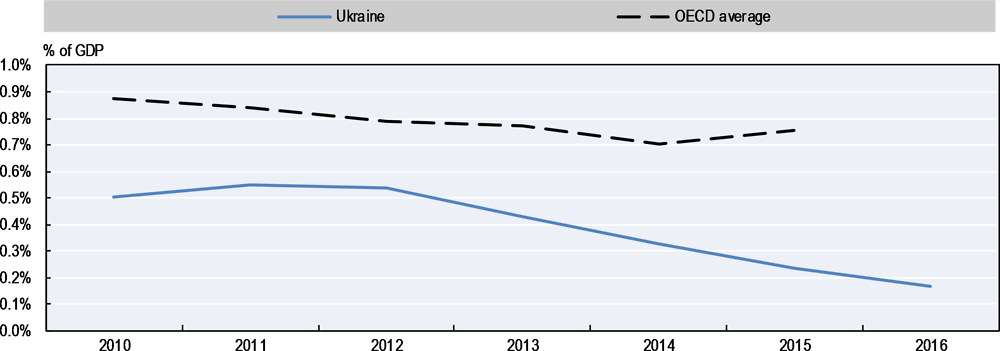
* The share of GDP needed for investment in transport infrastructure depends on a number of factors, such as the quality and age of existing infrastructure, maturity of the transport system, geography of the country, and transport-intensity of its productive sector. Caution is therefore required when comparing investment data between countries.
Source: State Statistics Service of Ukraine (2015), “Transport and communication in Ukraine”; OECD (2017a), Infrastructure investment (indicator), https://data.oecd.org/transport/infrastructure-investment.htm (accessed 30 January 2018).
Underinvestment in transport infrastructure across Ukraine’s regions and cities can be a constraint on future economic growth. Meanwhile, upgrading the transport infrastructure could help to bridge the connectivity gap between urban and rural territories. OECD research highlights that the impact of infrastructure investment depends on how well it is managed and co-ordinated with other aspects of regional development policy, such as education and workforce training (OECD, 2016b). The literature on the impact of infrastructure investment on economic performance suggests that the government should prioritise subsectors where infrastructure is the poorest (i.e. in Ukraine, the road sector), as returns on infrastructure investment are higher where current endowments are lower (UNECE, 2016).
Ukraine’s road density (277 km of roads per 1 000 km2) is low compared to most OECD countries (OECD average: 1 516 km/1 000 km2). The Executive Opinion Survey conducted for the World Economic Forum’s Global Competitiveness Report reveals that road infrastructure is perceived as the most problematic area: Ukraine ranks 134th out of 138 countries on the perceived quality of its roads, with a score of 2.4 out of 7 (World Economic Forum, 2016).2 The perceived quality of road infrastructure is lower than in all OECD countries. In contrast, the railway network is the second most extensive in Europe (excluding the Russian Federation). Railway density (37.2 km2) is higher than in many large OECD countries, including Turkey and the United States. As a result, the perceived quality of railway infrastructure (4 out of 7) is higher than that of many OECD countries, suggesting that railways are more reliable than roads (Figure 4.2).
Since the early 2000s, road traffic (both freight and passenger) has risen rapidly along with the number of motor vehicles. However, road development and repair have lagged behind traffic growth – 50% of the roads do not meet national roughness standards, and 40% do not meet national road strength standards. As a consequence, the average speed
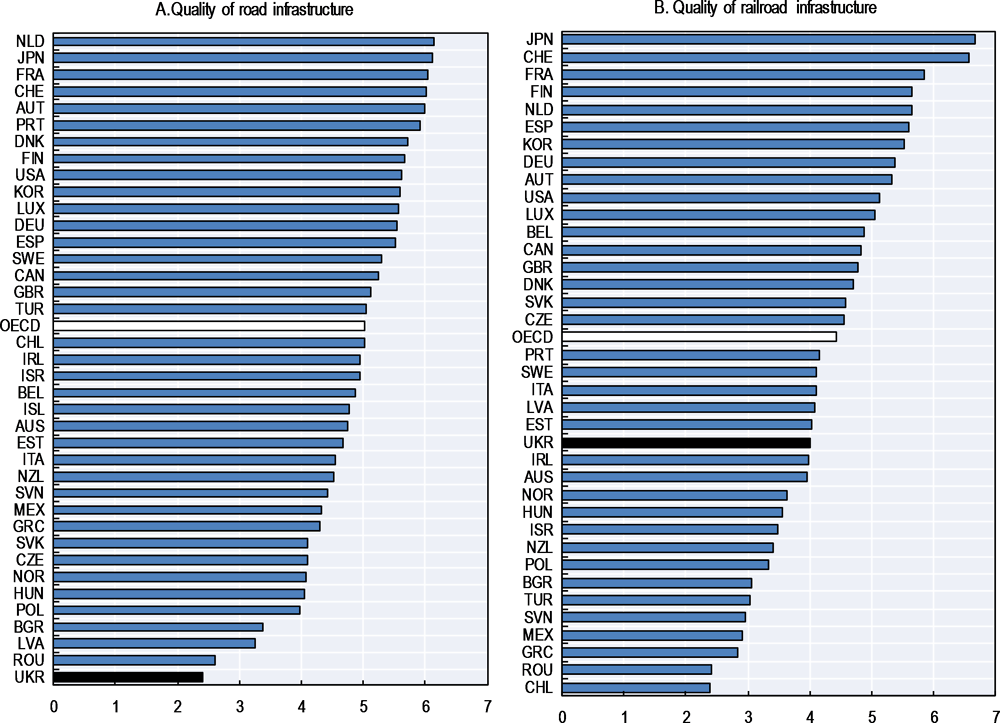
* The Global Competitiveness Report’s Executive Opinion Survey asks business executives to evaluate, on a scale from 1 to 7, one particular aspect of their operating environment (in this case the quality – extensiveness and condition – of road and railroad infrastructure).
Source: World Economic Forum (2016), The Global Competitiveness Report 2016-2017, https://www.weforum.org/reports/the-global-competitiveness-report-2016-2017-1.
on highways is one-third to one-half of what it is in Western Europe (Ukraine Transport Policy Note, 2016). The poor quality of roads also contributes to car accidents and fatalities: in 2013, the fatality rate per 100 000 inhabitants reached 11.3, well above the OECD average of 6.8.3 The quality of roads and the density of support infrastructure (such as gas stations) differ significantly across regions: road infrastructure indicators (Table 4.A.1 in Annex 4.A) and a regional executive opinion survey suggest that the best roads are found in Kyiv and Kyiv oblast, Poltava and Kharkiv. By contrast, agricultural regions, mainly in Western and Central Ukraine, have some of the country’s worst roads. Among regions hosting large urban agglomerations, the road network is particularly poor in Dnipropetrovsk and Lviv oblasts. On the positive side, survey data from the third annual Ukrainian Municipal Survey suggest some improvement in the perceived quality of roads in Ukraine’s largest cities between 2015 and 2017.
The railway system is the backbone of long-distance freight transport, accounting for 58% of freight turnover all over Ukraine in 2015.4 The railway system is crucial for the transport of Ukraine’s exports such as grain and steel to the Black Sea ports, and for the supply of intermediate products (coal, coke, iron ore and fertilisers) to industrial facilities and farms. As a result, Ukrainian railroads have high freight traffic intensity but lower traffic speed than in Western Europe. Ukraine’s railway infrastructure requires considerable modernisation. Single tracks in many parts of the network mean that passenger trains and freight shipments are using the same railways, decreasing considerably the average speed of passenger trains. The average age of locomotives and passenger cars owned by the national railway company (Ukrzaliznytsia) is above 40 years (Ukraine Transport Policy Note, 2016; Foundation for Effective Governance, 2011).
The Global Competitiveness Report also assesses the perceived quality of sea port and air transport infrastructure. The perceived quality of port infrastructure (3.1 out of 7) and air transport infrastructure (3.7 out of 7) is somewhat better than the perceived quality of road infrastructure, but still below the levels in nearly all OECD countries (Figure 4.3).
An overwhelming majority (80%) of the infrastructure in Ukraine’s 13 sea ports5 is either obsolete or in a depreciated state. For instance, 11% of berths are not functional. Ukraine has a fairly limited number of deep water facilities and restricted depths at approach channels; this sets technical limitations on many modern large ships (Ukraine Transport Policy Note, 2016). Increased grain exports put pressures on limited port capacity, pointing to the need to build new grain silos and adapt existing storage capacities. The lack of multimodal logistics infrastructure and the underdevelopment of container facilities raise the cost of container shipments. Overall, this highlights the need to modernise Ukraine’s port infrastructure, including strategic state assets such as berths, aquatic areas and moorage walls.
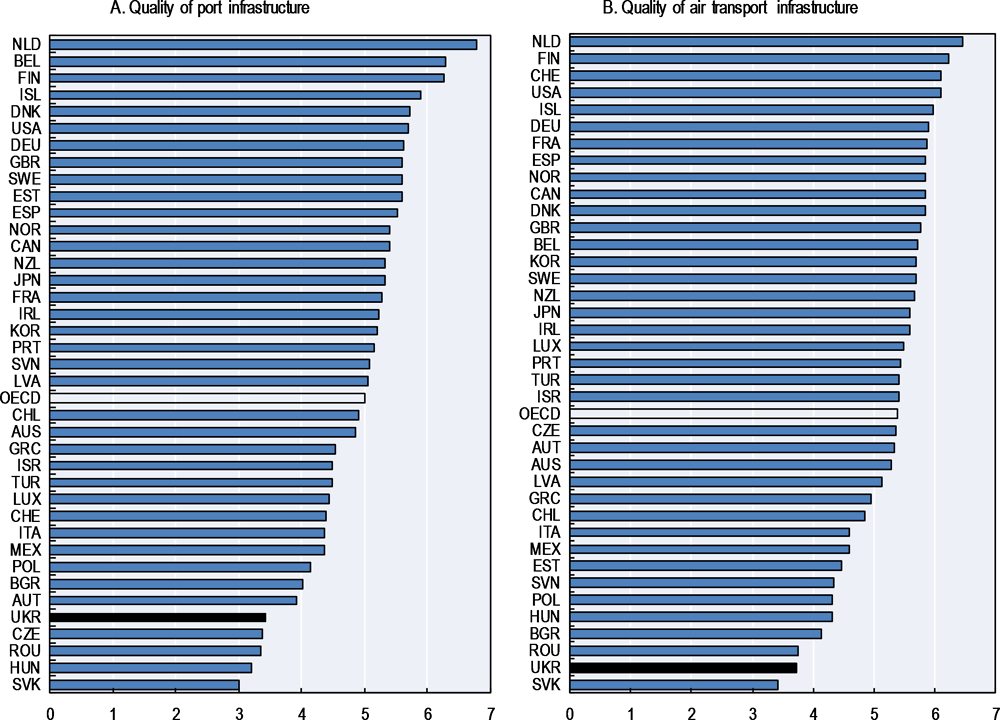
* The Global Competitiveness Report’s Executive Opinion Survey asks business executives to evaluate, on a scale from 1 to 7, one particular aspect of their operating environment (in this case the quality – extensiveness and condition – of sea port and air transport infrastructure).
Source: World Economic Forum (2016), The Global Competitiveness Report 2016-2017, https://www.weforum.org/reports/the-global-competitiveness-report-2016-2017-1.
Air passenger traffic is dominated by international routes: in 2016, international passengers accounted for 90% of total air passengers in Ukraine. The domestic share of passenger traffic is thus rather low for a country of Ukraine’s size,6 but this can be explained by relatively low income per capita, obsolete infrastructure in many regional airports and the well-developed internal railway network, which provides a high degree of connectivity between major urban centres. The two airports in the Kyiv agglomeration (Boryspil and Kyiv’s Zhuliany Airport) accounted for 75.6% of all air passengers in 2016. After a strong contraction in 2014-15, the aviation industry demonstrated a positive dynamic in 2016, with the number of air passengers (5.7 million) exceeding the level of 2013 (5.2 million).
However, underinvestment in state-owned infrastructure hampers the development of air transport. In terms of infrastructure, there is a stark contrast between airports whose airfield (light strip, taxiway strip, ramp, etc.) benefited from state investments as part of the budget for the Euro-2012 UEFA football championship and those that did not. The first group includes all state-owned airports (Kyiv’s Boryspil and Lviv’s Halytskyi) as well as Kharkiv Airport, which is an example of a successful public-private partnership (PPP) in transport infrastructure to finance the construction of a new passenger terminal. Most other airports are under municipal (sometimes oblast) ownership and have obsolete infrastructure (outdated and worn out air strips). Dnipro, the only major airport with declining air passenger numbers in 2016, has experienced repeated flight interruptions owing to security problems related to the light strip. In most cases, local authorities as owners of airport infrastructure lack the necessary funding to invest in airfield repair and modernisation, and therefore lobby the central government to obtain the necessary funds. The State Programme for Airport Development until 2023, adopted in February 2016, would substantially reform airport management.7 All airfields would be transferred to a newly created state-owned enterprise with an enhanced capacity to attract funding (for instance, from international financial institutions) and therefore to invest in airfield modernisation (Cabinet of Ministers of Ukraine, 2016).
Strengthening governance and co-ordination in the transport sector
When implemented correctly, decentralisation can be an effective policy tool to strengthen governance, transparency and accountability at local levels. An analysis of the governance and institutional design of Ukraine’s transport sector reveals that a number of the essential preconditions for decentralisation are missing.8 For instance, governance structures are overly centralised, with significant fragmentation in the allocation of responsibilities across entities. There is a need to strengthen subnational fiscal autonomy to invest in transport infrastructure, better align responsibilities with revenues, and build managerial and operational capacities at local levels. Effective mechanisms for co-ordination are also lacking, leading to difficulties in managing joint responsibilities across levels of government, between neighbouring jurisdictions and amongst entities with differing responsibilities in transport. A new transport strategy was developed with the aim of addressing some of these issues; the government should now turn its attention towards implementation.
Centralised governance and fragmented responsibilities impede transport sector development
In spite of recent advances in the decentralisation reform, the governance of Ukraine’s transport sector remains highly centralised at state and regional levels. Figure 4.4 depicts the evolution of budget expenditures in the transport sector, divided across different levels of government. Total transport sector funding amounted to UAH 29.2 billion (EUR 882 million) in 2016, or 3.5% of the overall Ukrainian budget. This represents a marked decrease from 2015, when transport accounted for 4.6% of budget expenditures. Notably, the share of the central administration in total transport spending has fallen substantially, from 74% in 2015 to 52% in 2016. Much of this decline was absorbed by regional (oblast) administrations (including Kyiv city) and cities of regional subordination, whose combined share in transport expenditures rose from 20% in 2015 to 37% in 2016. The remaining funds were spent by district (rayon) administrations (0.5%), cities of district subordination (1.8%), townships (1.5%), villages (5.3%) and unified territorial communities (UTCs) (1.3%) (Ministry of Finance, 2017). The contribution of the UTCs to transport expenditure can be expected to increase steadily over time, as further progress is achieved in municipal amalgamations, fiscal decentralisation and greater allocation of responsibilities to local levels.

Notes: “Regions” includes regional (oblast) administrations and Kyiv city administration. “Districts” includes cities of regional subordination and district (rayon) administrations. “Townships and villages” includes cities of district subordination, townships and villages. The data predominantly reflect spending on roads, which accounted for 92% of budget expenditures on transport in 2014 and 2015, and 86% in 2016.
Source: Ministry of Finance of Ukraine (2017), “Budget of Ukraine – 2016”, https://www.minfin.gov.ua/uploads/redactor/files/Budget%20of%20Ukraine%202016.pdf (accessed 13 February 2018).
Road infrastructure is a critical priority for the government, accounting for 86% of total budget expenditures on transport in 2016. It is worth noting that approximately 69% of paved roads in Ukraine are classified as local roads, yet subnational administrations accounted for just 40% of spending on roads. This reflects the limited capacity of local authorities to ensure local road operations and maintenance (Figure 4.A.1 in Annex 4.A shows significant variation in transport expenditure across regions). In the framework of the road decentralisation, the maintenance and operations of most state roads will be transferred to the regional level in 2018, and the state road agency Ukravtodor will focus on motorways of national significance (around 50 000 km out of 170 000 km of state roads). A new national road fund is being set up (partly financed by a fuel excise tax) to finance road maintenance and repairs: 35% of the fund will accrue to the regions. The reform aims to bring the road management system closer to EU standards and improve the funding of road operations and maintenance (Ukraine Transport Policy Note, 2016).
Transport and road networks are shaped by the spatial distribution of population and socio-economic activities such as jobs, education, healthcare, retail and services. Transport policy in turn influences outcomes across a broad range of policy domains, including economic growth, environmental outcomes, housing, land use, spatial planning, social equity, trade and regional development. As such, new laws and regulations relating to transport infrastructure and mobility should be developed in consultation with the relevant line ministries (e.g. Ministries of Economic Development and Trade, Finance, Ecology and Natural Resources, Infrastructure, and Regional Development). This can lead to a more balanced approach to decentralisation across sectors; improved policy coherence; and reduced chances for duplication, waste and loss of accountability. Figure 4.5 illustrates the institutional structure of road transport authorities in Ukraine. The management of the extensive network of state roads is currently centralised under Ukravtodor and its 25 regional branches. At present, there are no inter-ministerial working groups or official mechanisms for cross-ministerial co-ordination on transport policy in place.

Source: Ministry of Infrastructure (2015).
The scale of urban public transport often extends beyond the administrative boundaries of cities, creating significant obstacles to the co-ordination of transport policy across municipalities. A top-down approach to the development of transport plans prevents local governments from developing dynamic responses to spatial expansion and changing mobility patterns in urban areas. In this respect, the ongoing decentralisation reform and voluntary municipal amalgamations are helping to build scale and capacity at the local level, allowing for the provision of higher quality and more affordable public services. Fiscal decentralisation is providing a strong stimulus for urban transport infrastructure and services, by allowing autonomous and empowered local administrations to generate sustainable sources of income and improve the efficiency of public expenditures. For instance, there have been reports of UTCs undertaking repair and maintenance of local roads at one-fifth the cost quoted by the state and regional road agencies (OECD interviews, 2017).
In large metropolitan areas such as Kyiv, effective planning of public transport services is hampered by inadequate co-ordination between the central government, oblast and city administrations, subsidiary organisations, and neighbouring municipalities. Figure 4.6 illustrates the main institutional structures responsible for urban public transport provision in Kyiv city. Within the city administration, there is limited co-ordination on transport policy between departments responsible for areas such as transport infrastructure, construction and housing, urban development, land use and spatial planning. Additionally, there are few to no incentives in place to encourage co-operation and collaboration across administrations. Formal mechanisms for co-ordination between the Kyiv oblast administration, the Kyiv city administration and municipal companies (such as Kyivpastrans, which operates most of Kyiv’s public transport services, and Kyivskiy Metropoliten, which operates the Kyiv metro system) are non-existent or limited at best.

Source: Kyiv City State Administration (2018a), “Structure” (in Ukrainian), https://kyivcity.gov.ua/content/26_struktura.html (accessed 31 January 2018); Kyiv City State Administration (2018b), “Subordinated enterprises” (in Ukrainian), https://kyivcity.gov.ua/files/2017/12/22/Pidporyadkovani-DTI-KMDA-pidpryiemstva.pdf (accessed 31 January 2018).
A renewed focus on implementing the transport strategy is needed
The Ukraine Transport Strategy 2030 was released by the Ministry of Infrastructure in January 2017. The strategy was designed with financial support from the EU, within the framework of a project supporting Ukraine’s implementation of the EU Association Agreement. It reflects certain core underlying principles of effective transport policy – in particular, the need to align transport policy priorities with the country’s broader economic, social and environmental objectives, rather than focusing exclusively on infrastructure development. For instance, low-income areas of urban agglomerations often have poor access to public transport networks. Limiting the integration of low-income segments of the population with local labour markets is counterproductive and only serves to exacerbate inequalities. The strategy also reflects the need to support the development of less carbon and space-intensive modes of transport, such as walking, cycling, trains and buses. Priority is given to maintenance and upgrading of existing infrastructure, before undertaking new and potentially costly construction projects. Striking an effective balance between infrastructure maintenance and new construction investment is essential – the overall cost of preserving a poorly maintained road can be anywhere from three to seven times more than the cost of preserving a properly maintained one (OECD/ECLAC, 2012).
The transport strategy also reflects the need for Ukraine to adopt a multi-modal approach, focusing on building the capacity of various transport modes to improve connectivity, mobility and accessibility. For example, transport interchange locations on the periphery of Kyiv are under increasing pressure to cope with large volumes of passengers transferring between different modes of transport. With significant future population growth forecast in the towns and villages surrounding Kyiv, this problem is only expected to get worse. Improving the integration between different transport modes should help to improve mobility and alleviate congestion. Moreover, Ukraine’s public transport systems require significant modernisation of the infrastructure, governance and administration in order to meet the rapidly evolving needs of the population. Demand management measures such as congestion charges and investment in alternative modes of transport can also help to improve fiscal sustainability and reduce the need for additional expenditures on infrastructure and new rolling stock.
Moving forward, effective implementation of the transport strategy will be essential. Transport strategies can be useful tools to structure and co-ordinate interventions relating to the sector. It is vital to develop realistic targets and milestones, ensuring that transport master plans are fiscally constrained and therefore likely to be fully funded. For instance, the transport strategy estimates annual road investment needs to be about UAH 35-40 billion (EUR 1.1-1.2 billion), which is significantly higher than the current level of spending on roads (UAH 25 billion in 2016). Enhancing subnational fiscal autonomy and leveraging new sources of funding such as road user charges can help to bridge the financing gap. Ukraine should also develop mechanisms for co-ordination of transport policy across regions, particularly with regard to improving logistics performance and interregional connectivity.
Strong co-ordination mechanisms are essential to support the transition to a decentralised transport sector
Improving connectivity and the performance of Ukraine’s transport sector requires a strong institutional framework and clear mechanisms for the design and implementation of transport policies at national and subnational levels. Well-defined national policy frameworks can help to improve local transport planning and strengthen local capacities to invest in urban mobility.
Given the complexity of existing institutional structures, urban transport development in metropolitan areas requires effective co-ordination within administrations (across departments) and across different levels of government. City administrations could work more closely with municipal companies and private transport operators to establish an integrated public transport system that enhances mobility and connectivity for all citizens and is based on sustainable and environmentally friendly technologies. In the Kyiv agglomeration, co-ordination with the municipalities surrounding Kyiv city is essential, as many of their residents make frequent trips to the city to access employment and services. Land-use planning and housing developments in these areas can have significant implications for infrastructure and transport needs within Kyiv city. The lack of co-ordination reflects the need for a holistic approach with a strong mandate and clear instructions on how to align activities around urban transport development.
Better co-operation and co-ordination can help to manage some of the problems arising from the unclear attribution of responsibilities across levels of government. For example, the legal environment does not clarify how responsibilities for financing and undertaking road maintenance should be allocated at local levels. As a result, the blurred nature of responsibilities between the UTCs and district (rayon) administrations hinders the development of strategic long-term investments in roads and transport infrastructure.
Inter-municipal co-operation (IMC) on public transport provision remains in its infancy in Ukraine. IMC is particularly important in rural areas, where high levels of territorial fragmentation continue to generate excessive co-ordination costs. Municipal amalgamations can act as a strong force to encourage horizontal co-operation on transport development. In places where amalgamation is not politically feasible, co-operation is somewhat less forthcoming, particularly between the UTCs and non-amalgamated communities (OECD interviews). The Ministry of Regional Development’s website lists a total of 133 ongoing IMC projects.9 Three of these relate to transport service projects and 16 are road repair and maintenance projects. To better support municipalities in transport provision, the government should consider expanding IMC agreements between the UTCs and non-amalgamated communities. IMC is an effective policy tool to develop mobility solutions across administrative boundaries, and can even act as a precursor to amalgamation by helping to better integrate isolated populations with neighbouring localities. Box 4.1 outlines some examples from Poland’s experience in developing IMC for public transport provision.
Upper Silesia
The decentralisation reforms introduced in Poland’s transport sector in the 1990s created significant problems for Upper Silesia, an old mining and industrial region with large commuting flows between residential towns and places of work. As no state or regional budget financing was provided, municipalities had to make a financial contribution to the Public Transport Municipal Association of Upper Silesian Industrial District, calculated as a fixed percentage of their total income. There was widespread disagreement on the size of the percentage contribution, as smaller communes were unable to afford more than half of the proposed level, and ultimately threatened to leave the union. In the late 1990s and early 2000s, the quality of public transport deteriorated significantly because responsibilities had been transferred to the association. As a result public transport was no longer politically important for mayors.
A new model was introduced in 2007, with contributions calculated based on the individual deficit of a given bus line. A municipality’s contribution is now calculated based on the number of passengers (from representative passenger counting) multiplied by an average income per passenger (uniform across the network) minus real costs. The deficit is split between the municipalities, based on the number of vehicle-kilometres within the territory of the commune. While the new model is far from perfect, it has created more of a customer service-oriented system.
Gdynia
The city of Gdynia established its own public transport authority (ZKM Gdynia) in 1992. ZKM Gdynia developed a unified transportation network by setting up contracts with several surrounding communes, including inter- and intra-communal bus lines. Each contract states the required frequencies and quality levels, is tendered to an operator separately, and is settled with the partner commune separately. While associations were a popular mechanism for inter-municipal co-operation (IMC) in the 1990s, the contract model became widespread in Poland in the 2000s. The network provides passengers with the option to buy a single ticket for the entire network, and to get unified information on public transport in the area.
Lessons from Poland’s experience with inter-municipal co-operation in public transport
-
Unions and agreements are both effective tools to achieve IMC. The law should allow local authorities to freely create unions and agreements adapted to their needs.
-
IMC in public transport is significantly more complicated than for the management of roads, and typically requires contracts to be signed rather than civil law agreements.
-
Creating a union should not imply that local authorities are absolved of their political responsibilities.
-
A union has two types of customers: its members, who require a tailor-made offer, and end-users, who require a mass offer. The union should try to serve both customers as best it can.
-
Integration of ticketing does not necessarily imply full integration of management.
Source: Wolański, M. (2017), “Inter-municipal co-operation as a tool to foster road infrastructure development and efficient public transport service delivery”.
Modernising urban public transport systems
Ukraine has one of the highest urbanisation rates in Europe, with 70% of the population living in urban areas. Demographic trends such as ageing, rural decline, interregional migration and population growth in urban and peri-urban areas are reshaping the demand for transport services. Across the country, legacy public transport systems inherited from Soviet times are in a dilapidated state, and after years of underinvestment, public transport services struggle to cater to complex and evolving travel demand patterns.
With a population of 2.9 million and a surface area of 835 km2, Kyiv is the seventh largest city in Europe. Its population has been on an upward trend for the past 15 years, and rates of private car ownership and use have risen in tandem. To combat air pollution, congestion and other negative side effects associated with population growth and increasing car ownership, Kyiv needs to develop a fast, cost-effective, sustainable and multi-modal mobility system for all citizens, including those that live in low-income areas with fewer connections to transport services and employment opportunities.
Kyiv’s public transport network is dense compared with other European cities, with 94% of the population living within 400 metres of a transit stop (Oh and Nunez, 2016). The underground metro system is old but very efficient, moving 45% of passengers (or 1.4 million passengers per day) in 2017. Buses are the second most popular means of public transportation, accounting for 28% of passenger transport (849 300 passengers per day). The trolleybus system is relatively modern and transported 15% of passengers in 2017. The remaining passengers were transported by tram (11%) and the city’s electric train (0.6%) (Kyiv Department of Statistics, 2018).
In Kyiv, as in many other parts of Ukraine, a lack of resources for maintenance and investment in transport infrastructure leads to poor quality service and limited enforcement of traffic regulations; environmental standards constrain mobility; and strong market power of incumbent operators creates barriers to entry and deters competition.
Ukraine needs to strengthen financial and managerial capacity at local levels
Local governments lack the financial capacity to invest adequately in the maintenance and renewal of urban public transport infrastructure. Low density in rural areas is a particularly challenging issue, leading to weak physical and operational integration of transport networks. A number of UTCs reported difficulties in organising efficient school bus routes across a group of newly amalgamated communities. This issue is compounded by the limited operational and managerial capacity at local levels. Traditionally, transport policy and spatial planning were not undertaken by municipal authorities in Ukraine, and were only partially undertaken by regional administrations (OECD interviews, 2017).
Ensuring that local administrations have sufficient funding and adequate capacities to manage local roads, particularly in small towns and rural areas, should be a central part of the road decentralisation agenda. Ukraine’s road investment needs are estimated at UAH 35-40 billion (EUR 1-1.15 billion) per annum, and the State Road Fund will cover approximately one-third of financing needs in the short term (Ministry of Infrastructure, 2017). To bridge the financing gap, the government should consider developing toll roads and leveraging road user charges, parking fees and speed enforcement charges. Figure 4.7 demonstrates significant variation across regions in transport tax revenues. Overall, per capita revenues from transport-related taxes and charges are extremely low, ranging from UAH 0.6 (EUR 0.02) in Luhansk to UAH 40.43 (EUR 1.23) in Kyiv city in 2016. The extent to which regions leverage personal transport tax, legal persons’ transport tax and parking charges as sources of financing also varies substantially across regions. In large urban agglomerations, taxes and charges should reflect the costs of negative externalities, such as congestion and pollution. Establishing additional off-street parking capacity can also help to alleviate congestion in high-density traffic zones.
Public transport in Ukraine is highly affordable when compared with cities in OECD member countries, after accounting for relative differences in incomes. Figure 4.8 shows a positive correlation between public transport fares and GDP per capita in cities around the world. In spite of reforms to ticketing and fares introduced in 2014-15, prices in Kyiv remain relatively low. Low public transport fares (in USD terms) can partly be attributed to the sharp depreciation of the hryvnia that began in 2014 as a result of the Donbas conflict, and the fact that ticket prices have not increased by a commensurate amount. However, it is worth noting that about 50% of passengers are eligible for generous fare discounts and exemptions; as such, public transport affordability is even greater than the level illustrated in the graph. Current fares are UAH 5 (EUR 0.15) for the Kyiv metro; UAH 4-7 (EUR 0.12-0.21) for Kyivpastrans buses, trolleybuses and the city electric train; and UAH 5-7 (EUR 0.15-0.21) for private minibus (marshrutka) services.
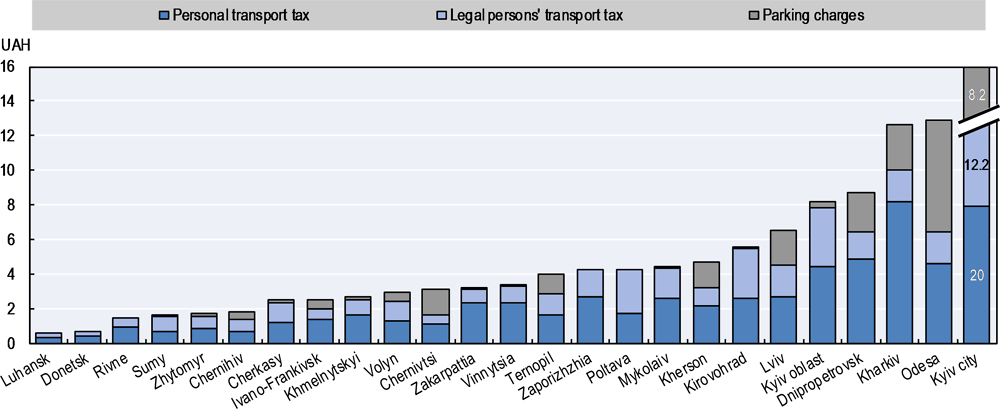
Source: Ministry of Finance (2017), “Budget of Ukraine – 2016”, https://www.minfin.gov.ua/uploads/redactor/files/Budget%20of%20Ukraine%202016.pdf (accessed 13 February 2018).

Notes: The average cost of public transport (bus, tram, metro) in 2015 is based on the price of a single ticket for a journey of approximately ten kilometres or at least ten stops. City GDP per capita data are for 2013, or 2012 when 2013 data were not available. With the exception of Istanbul, Kyiv and Moscow, city GDP per capita data are from OECD (2018), which uses the functional urban area (FUA) methodology to compare indicators across cities.
Sources: Statista (2018), “Average cost for public transport (bus, tram or metro) in selected cities around the world in 2015 (in U.S. dollars)”, https://www.statista.com/statistics/275438/public-transport-cost-cities (accessed 7 February 2018); OECD (2018), “Metropolitan areas”, OECD Regional Statistics (database), https://doi.org/10.1787/data-00531-en (accessed 8 February 2018); State Statistics Service of Ukraine (2018), “Gross regional product (2004-2015)”, https://ukrstat.org/en/operativ/operativ2008/vvp/vrp/vrp2015_e.zip (accessed 8 February 2018).
While low fares are often desirable from the point of view of citizens, they should be appropriately balanced with fare discounts and exemptions in order to ensure the sustainability financing of public transport services. As a result, city administrations spend a significant portion of their budgets on public transport. Over the past five years, the Kyiv city administration spent about 6% of its total budget on operating subsidies. High subsidies are inefficient policy tools and result in less available funds for other areas, such as maintenance, inspections, upgrading of infrastructure and replacement of rolling stock.
The introduction of zonal fare systems setting public transport costs based on the distance travelled can help to put public transport financing on a more sustainable footing. Currently, discounts are not available for trips using multiple modes of transportation, and greater fare integration is recommended. Regular testing through stated and revealed preference surveys can help to better understand the views of citizens and the impact of fare increases on demand for public transport, commuting patterns and equity. Care should be taken when increasing public transport fares, in order to mitigate the impact on low-income populations and avoid creating incentives for increased private car usage.
Transport creates access, which provides economic benefits to other sectors of society such as real estate, corporations, etc. This value is often never returned to the transport sector, which remains responsible for incurring the costs of infrastructure and service provision without any return beyond farebox revenues. This is one domain where Ukraine has the opportunity to leapfrog and reorganise the financing channels that support transport.
Value capture taxes can help cities to raise revenues to finance the construction and maintenance of transportation infrastructure. The base for a development-based land value capture tax is calculated from the increase in property values arising from the development of public transportation infrastructure. However, it can only be applied when the increase in property value can be unambiguously attributed to the new infrastructure development. Land value capture schemes require strong institutional capacities in local governments, and have been successfully implemented in a number of large cities, including Delhi; Hong Kong, China; London; New York City; São Paulo; and Tokyo (GCEC, 2016). Implementing taxes on additional valuations of real estate due to improved access, and establishing corporate contributions in exchange for the benefit of improved accessibility for their employees, has a direct impact on the productivity and competitiveness of cities and urban areas. Box 4.2 outlines the French experience in introducing a value capture mechanism for local firms.
Better enforcement of parking rules, traffic regulations and environmental standards can improve mobility
Buses, trolleybuses and trams operating in congested urban areas suffer from low operating speeds due to a lack of priority and segregation from congested street sections. Poor enforcement of parking controls and traffic regulations often results in further bottlenecks caused by parked vehicles (Oh and Nunez, 2016).
In France the “Versement Transport” (VT) is a local tax levied on firms with more than 11 employees. The VT represents a percentage rate of the payroll, which is determined at the discretion of the local authorities with a ceiling imposed by law. For the Île-de-France region, the percentage rate has been capped at 2.95% in Paris, and stands at 2.12%, 2.01% and 1.6% in other parts of the region. In the other regions of France the rate is capped at 1.95% for touristic towns with 100 000 inhabitants or more, and 1.05% for touristic towns and villages with 10 000 to 100 000 inhabitants. This has been a very effective source of funding to modernise public transport networks. In 2014, the VT generated EUR 3.6 billion in revenues, accounting for 65% of the budget of the transport authority of Île-de-France and nearly 40% of the total public transport financing for France. In addition, employers reimburse 50% of the cost of a transit pass, providing extra incentives for employees to use public transport. This scheme has been applied in the Île-de-France region since the 1980s, but since 2009, it has been compulsory for all urban areas with public transport services and extended to bike rental services.
Source: URSSAF (n.d.), “Le versement transport et le versement transport additionnel”, https://www.urssaf.fr/portail/home/employeur/calculer-les-cotisations/les-taux-de-cotisations/le-versement-transport-et-le-ver.html; Île de France mobilités (2018), Les recettes de fonctionnement, https://www.iledefrance-mobilites.fr/les-recettes-de-fonctionnement/.
Public transport often competes with privately owned minibus services (marshrutka), which offer high levels of connectivity and convenience. This results in inefficient service duplication, with fewer revenues for local administrations to recover the costs of public transport provision. Unlicensed marshrutka operators often operate minibus services without formal permission from city administrations. Vehicles tend to be outdated, as private operators face little pressure to invest in new vehicles and use existing vehicles for as long as possible in order to maximise profits. Another practice commonly observed is that licensed bus drivers operating routes that originate in neighbouring municipalities will violate regulations by picking up passengers within the city boundaries – reflecting the lack of co-ordination across jurisdictions on public transport provision. This is compounded by the limited capacity in city administrations to undertake inspections, impose appropriate sanctions, and encourage operators to conform to performance standards and regulations. Inspection teams are often understaffed, and do not have adequate supervision and enforcement powers. Non-compliance with standards and regulations is tolerated by the city administrations, police and the National Inspectorate for Public Transport, which is responsible for the regulation of transport operators (Oh and Nunez, 2016).
Road safety is another hurdle to improved mobility, particularly in urban areas. Official statistics reported 3 410 fatalities in road traffic accidents across Ukraine in 2016, or 80 deaths per million inhabitants, compared with an average of 51 road deaths per million inhabitants in the EU (ETSC, 2018). This situation creates strong incentives for private car use, leading to increased congestion and air pollution in dense urban areas. Due to low levels of disposable income and car ownership, walking nonetheless remains highly common as a means of travel, particularly for localised trips in residential suburban areas to access education, social and medical services. The government could do more to encourage non-polluting modes of transport, by better enforcing vehicle and emissions standards and improving the infrastructure for walking and cycling.
Establishing strong environmental and emissions standards for public transport would require the retirement of some outdated vehicles (in particular the marshrutkii, many of which are at or below Euro II emissions standards). This could help to reduce emissions and air pollution, not only through the implementation of better performance standards, but also through further optimisation and greater efficiency in public transport networks. It could also reduce inefficient competition with official public transport routes. These actions should be accompanied with measures to minimise the losses incurred by employees of marshrutka services, through retraining schemes or programmes to facilitate access to new employment opportunities.
Strong market power of incumbent operators deters competition
The rights to operate public transport services (e.g. bus routes) are typically held by municipal enterprises. In Kyiv, the city administration identifies a route that requires a bus service and opens up a competitive tendering process to prospective operators. In spite of the formal regulatory processes and structures in place, incumbent providers are the only applicants for 90% of tenders for existing routes (Oh and Nunez, 2016). This reflects the high risk and lack of a competitive environment for new entrants.
The government should work to stimulate a competitive environment for the provision of transport services, by allowing for city administrations to franchise routes and attract private operators that adhere to standards and regulations. The experience of Lublin, Poland, can be instructive in this regard. The city was struggling with unfair competition between private companies and municipal buses. To improve efficiency and financial sustainability, the local government announced a tender and employed the small private operators as sub-contractors of the municipal transport company. In the United Kingdom, the city of Oxford dealt with high levels of competition between bus operators by establishing stringent quality requirements for buses to enter the city. Another option is to give exclusive rights to one operator and charge a fee for giving the operator a monopoly on the provision of local public transport services. The Lithuanian experience of setting minimum fees for minibuses and taxi companies could also be a useful model for Ukraine.
A logistics observatory based on detailed mobility data can strengthen project evaluation
Incorporating commuter flows and travel cost data into sophisticated transport models would allow for more detailed analysis of transport flows and help to monitor the impact of any changes implemented in public transport systems. Changes in mobility patterns can have profound impacts on the financial position of public transport networks. In London, a decline in passenger numbers caused by greater numbers of people working from home or using ride-hailing apps has contributed significantly to the burgeoning operational deficit of Transport for London. Scheduled to reach GBP 968 million in 2018-19, the deficit has led Transport for London to defer critical infrastructure upgrades on the Northern and Jubilee lines of the London Underground (Financial Times, 2018). Revisions to public transport networks should be integrated with strategic land-use planning, housing and other relevant place-based policies. Detailed data on commuter flows are essential for this, and currently lacking in Ukraine.
Further social research and consultations with local populations and relevant stakeholders are needed to take account of their views when making changes to public transport networks. In particular, it is important to ensure that citizens’ needs are taken into account, that new routes enjoy high levels of use and that low-income segments of the population are not disadvantaged by new developments.
Local administrations should undertake detailed cost-benefit analysis and feasibility studies before investing in new infrastructure, public transport or mass transit routes. The analysis would allow for more informed policy making and a strong, evidence-based business case for prioritising potential investments in local public transport.
New technologies can help to generate innovative mobility solutions
The advent of smart technologies, big data and mobile information platforms is revolutionising the provision of transport services across the globe. In recent years, the efficiency of transport has been bolstered by advances in computer-assisted scheduling, routing and dispatching, as well as the growing use of mobile applications that make services more accessible to users. With high passenger and vehicle densities, urban areas are a fertile ground for the development of innovative mobility solutions such as car-sharing and ride-sharing services. However, these developments are not unique to urban areas, and a number of schemes have been found to work well in rural areas too.
Increasingly, OECD countries are making use of big data to improve public transport planning, traffic operations and safety. The growing availability of near real-time data can help to better understand and model commuter behaviour; optimise collective transport services; and adapt routes, stops and schedules to user demand. Private operators are also analysing transport data to assess the potential for new and profitable services. In Ukraine, public transport authorities could leverage mobility-related data to identify periods of low demand, areas that are poorly served by public transport or specific segments of the population (e.g. elderly, handicapped) in need of specialised mobility solutions. Strong data literacy and sufficient capacities to exploit new streams of data are necessary for local administrations to take full advantage of the opportunities offered by new technologies (OECD, 2016a).
There is growing recognition that demand-responsive transport (DRT), which provides flexible transportation (typically bus services) in response to customer demand, has strong potential to improve the provision of public transport services in rural areas. DRT can either be provided as a flexible door-to-door service within a given area, or as a bus service operating along fixed, pre-defined routes. A number of funding models for DRT schemes exist, including full funding by local transit authorities, partial funding and selection of operators through a competitive tendering process, independent private operators, and community-operated non-profit enterprises. While DRT may entail higher unit (per person) costs, evidence suggests that DRT users are prepared to pay slightly more than the fares for standard bus services. The design of DRT schemes (e.g. routes, location of stops, frequency of services, etc.) should be developed in close consultation with users, and it is essential to select vehicles in line with the density of demand (OECD/ITF, 2015).
Car-sharing and ride-sharing programmes are becoming increasingly widespread across the globe. While some schemes are led by local governments, a number of large-scale vehicle manufacturers and car rental companies have established services of their own in response to declining incentives for private car ownership. In some cases, municipalities have launched services in collaboration with private companies. AutoLib, an electric car-sharing service that originated in Paris, had nearly 4 000 vehicles in its fleet and 109 400 active subscriptions in 2016. Autolib is operated by the firm Bolloré, and owned by Autolib’ Velib’ Métropole, an inter-municipal structure grouping 103 communes in the Paris agglomeration (Autolib’ Metropole, 2017). Another well-known programme is car2go, a subsidiary of Daimler AG providing car-sharing services with 2.5 million registered members and a fleet of 14 000 vehicles in 26 cities across Europe, the United States and the People’s Republic of China. Ride-sharing and ride-hailing applications such as BlaBlaCar, DiDi Chuxing, Lyft and Uber have also proliferated.
The trend to remodel transport into a user-centred service has been boosted by the spread of smartphones and GPS navigation devices, which allow for the integration of public and private transport systems by combining live data on user demand, traffic conditions and delays in public transport networks. Box 4.3 outlines the Finnish experience in developing Whim, a mobile phone application to improve mobility in Helsinki region.
Mobility as a Service (MaaS) Global is a start-up based in Finland that improves mobility by providing multi-modal transport services to residents of the Helsinki region. Through its mobile application Whim, MaaS combines public and private means of transport and presents a variety of alternatives to the user, allowing for comparisons to be made based on speed, comfort and price. Whim integrates conventional means of transport such as trains, buses and taxis with new and innovative transport options, such as bicycle-sharing schemes, on-demand buses and car-sharing. The application helps to alleviate congestion in Helsinki by efficiently combining existing mass-transit schemes with privately operated services in a single platform, leading to better mobility and reduced incentives for private car use.

Source: The Economist (2016), “Transport as a service – It starts with a single app”, https://www.economist.com/news/international/21707952-combining-old-and-new-ways-getting-around-will-transform-transportand-cities-too-it.
Managing shrinking cities, ageing and declining rural populations will be a key challenge for Ukraine in the years ahead. In some cases, the development of online or mobile solutions (e.g. telemedicine, e-learning) can help to sustain service provision in remote areas and reduce the reliance on public transport. However, as local tax revenues dwindle and the cost per person of service provision rises, local governments will be faced with the need to close or downsize schools, hospitals, public transport and other facilities. While this may alleviate some of the pressure on public finances in the short term, it also results in longer travel times and reduced mobility for residents trying to access basic services. To compensate for reductions in the scale of service provision, cost savings can be channelled into strategic investments to improve the quality of transport services, leading to more efficient, reliable and affordable transport solutions – particularly for populations in rural and low-density areas. Successful interventions to improve passenger comfort and convenience have included reducing seat density, using smaller vehicles and improving service reliability (e.g. by making transport timetables and live traffic information available through mobile applications). Not-for-profit community bus services are another example of an effective mobility solution for rural areas. Community bus services often rely on local volunteers, and can be funded by a combination of ticket fares, municipal budgets and contributions from local businesses (OECD, 2016a).
New technologies can also help Ukraine to improve logistics performance (see next section for further details). For instance, the development of autonomous vehicles has significant potential to disrupt the road freight industry in the coming years, by displacing workers. In Europe, labour currently accounts for 35-45% of road freight operating costs. However, regulatory harmonisation between neighbouring countries is necessary to ensure that trucks can pass freely across borders. The availability of big data on border crossings and transit flows can help to analyse traffic flows and provide accurate estimates of travel time and reliability. These factors are essential to encourage investment in new efficiency-enhancing technologies from manufacturers and road users (OECD/ITF, 2017).
Improving logistics performance and port-city relations
Logistics services are the backbone of international trade. Improving the capacity to transport goods efficiently and connect consumers and manufacturers with international markets can yield important productivity gains and lead to greater sophistication of exports. Sea ports are an essential component of integrated multi-modal logistics systems, and their effective functioning is necessary to ensure Ukraine’s participation in cross-border supply chains. This section evaluates logistics performance in Ukraine, and outlines strategies for local administrations to strengthen the governance of sea ports and increase the economic benefits from port activities.
Boosting the performance of logistics systems
Ukraine could significantly strengthen the performance of its logistics systems. Logistics is particularly relevant for export-oriented economies, where high trade and transportation costs can have a negative impact on competitiveness. The World Bank’s Logistics Performance Index ranks 160 countries on the efficiency of international supply chains, measuring six key areas on a scale of 1 to 5: efficiency of customs and border management clearance, quality of trade and transport infrastructure, ease of arranging international shipments, quality of logistics services, ability to track and trace consignments, and timeliness of deliveries. Figure 4.10 compares Ukraine’s performance across these six areas with Germany (the top performer) and selected benchmark economies. Although there is room for improvement across all six categories, performance is the weakest in the areas of customs efficiency and quality of trade and transport infrastructure.
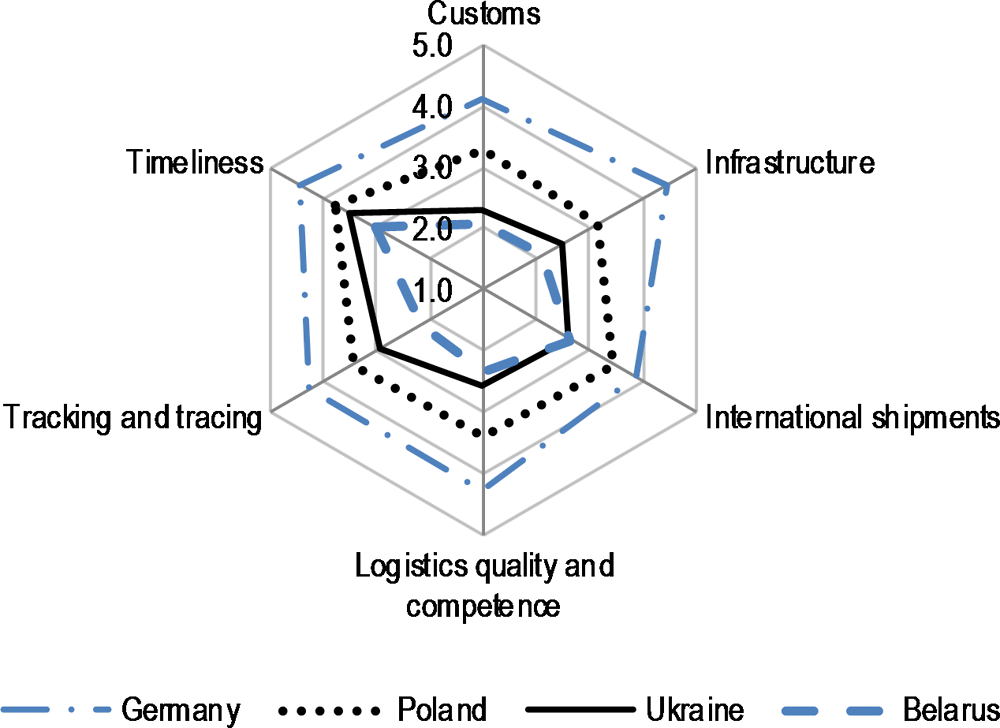
Source: World Bank (2016), Logistics Performance Index (LPI) dataset, https://lpi.worldbank.org (accessed 22 January 2018).
High transport and trade costs are reflected in a number of other key indicators. The World Bank’s Doing Business 2018 assessment ranked Ukraine 119th out of 190 economies in the Trading across Borders dimension, which measures the time and cost of logistical procedures associated with exporting and importing goods (World Bank, 2018). The OECD Trade Facilitation Indicators compare and benchmark 163 countries over the full spectrum of border procedures, helping to identify important areas in need of reform and prioritise policy actions. Ukraine performs significantly below the best practice level and the average for the Europe and Central Asia region across nearly all 11 categories (Figure 4.11). Involvement of the trade community – which measures the extent to which public consultations with traders take place – is the best performing category, and the only area where Ukraine scores above the average for Europe and Central Asia. The weakest performance is observed in the areas of border formalities (automation, documentation and procedures), and co-operation between internal border agencies. The area of governance and impartiality also shows substantial room for improvement. Reducing transport costs would help to lower the prices of tradable goods, improve export competitiveness and support the diversification of Ukraine’s economy.
Strengthening co-operation between ports and port-cities
Commercial seaports remain under state ownership and are administered by the State Seaport Administration. The 2013 Law on Seaports reformed port governance by separating port commercial activities from the ownership of strategic infrastructure and administrative functions, and by opening the door to private stevedoring companies. However, while the Ministry of Infrastructure plans to attract private investment to strategic port infrastructure through concession mechanisms, no port concession agreements have been signed, largely due to an inadequate legislative framework.10 Port directors have insufficient management flexibility: for instance, even the smallest capital investment must be approved by the Cabinet of Ministers. Moreover, there is insufficient co-ordination between the seaport administration and local administrations of seaport cities. This issue is becoming more prominent as the ongoing decentralisation reform enhances the responsibilities of city administrations.
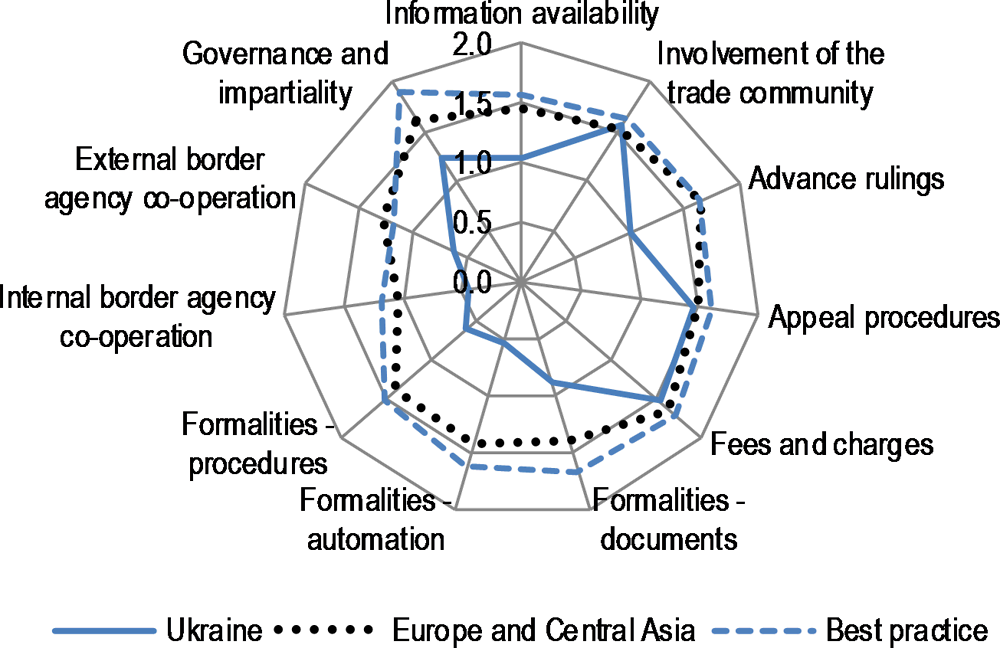
Source: OECD (2017b), Trade Facilitation Indicators dataset, www.oecd.org/trade/facilitation/indicators.htm (accessed 22 January 2018).
Well-run, competitive ports produce local economic benefits for port cities. However, there is a port-city mismatch because the negative impacts associated with ports are disproportionately concentrated in port cities, while the economic benefits of ports largely spill over to other regions, as they act as gateways for trade with entire countries. In Ukraine as elsewhere, port-cities face the challenge of getting more local value-added out of their ports. OECD research suggests that various local public policy instruments can be effective in increasing the economic benefits from port activities while minimising the negative impacts (Box 4.4). In Ukraine, field research suggests that increased co-operation of the State Seaport Administration with local city administrations is required to deal with the negative externalities of port activities (such as rapid deterioration of road infrastructure or environmental and health impacts from grain dust).
A port cannot be a driver of urban economic growth if it is not competitive. Port competitiveness can be improved by increasing maritime connectivity, the effectiveness of port operations and hinterland connections. These factors are crucial to integrate the port system into multimodal transportation networks, so as to improve market access, fluidity of trade and integration in an industrial network. Direct rail access to the quays, smooth interconnections with the railway network outside the port and canals linking berths with inland waterways both contribute to hinterland connectivity and raise the competitiveness of alternatives to truck transport. Ports cannot sustain their operations if they lack local support: support from the local administration and population is an integral part of the port competitiveness agenda. Successful port authorities therefore pay attention to informing and educating local stakeholders: their actions may include international exhibitions, seaport days and direct business trips, school visits and the creation of a seaport education centre, etc.
Ports and port-cities should co-operate to reduce the negative impacts of port activity on urban populations. These impacts are mostly related to the environment (air and maritime pollution), land use and traffic congestion. Air pollution and noise usually have adverse consequences on the health of port-city dwellers. Sulphur dioxides (SO2), nitrogen oxides (NOx), as well as particulate matter (PM10) present high negative externalities in terms of the health of urban dwellers. Shipping emissions can present a large share of the total emissions in port-cities: for instance, port activities account for half of SO2 emissions in Hong Kong, China and Los Angeles. Encouraging sustainable modal splits to non-truck means of transport can help reduce negative externalities (congestion and air pollution) from truck transport. Pollution from shipping activities can be limited through regulations (e.g. setting strict limits on SO2 emissions from ships in populated coastal areas) and by enhancing monitoring systems, for example by creating port emission inventories. Such efforts at quantification are essential, as they provide a baseline against which subsequent progress and performance can be measured. Last but not least, ports can invest in cleaner, low-emission technology to drive their own operations. This usually implies a shift away from diesel engines. For example, the port of Busan, Korea, has switched from fuel-driven rubber-tired gantry cranes to electricity-driven ones in its cargo-handling operations.
Three main models exist for cities to reap additional benefits from their ports: maritime service clusters, industrial development and port-related waterfront development. Maritime service clusters try to attract high value-added services related to the maritime industry, such as maritime finance, consulting, engineering and legal services. In Ukraine, such maritime services can be found in the urban agglomeration around Odesa. Additionally, port cities may attract value-added logistical services related to port activities, such as trans-loading and cargo transformation activities (processing, packing, consolidation, etc.). Another promising path for port-cities is industrial ecology, i.e. systematic management of material and energy flows, using waste from one process as an input for another process. Ports can have substantial influence and incite local industries to develop industrial ecology projects, supporting the dual objectives of efficient waste management and local economic development. Port-related waterfront development provides a third policy option to increase local economic value from ports. It implies transforming former industrial port sites into places for leisure, consumption and tourism, such as port maritime heritage sites or cruise ship passenger terminals and marinas. In Ukraine, Odesa has actively engaged in waterfront development, for instance with the Istanbul park and the reconstruction of the Potemkin Stairs in the city’s main waterfront.
Source: OECD (2014), The Competitiveness of Global Port-Cities, https://doi.org/10.1787/9789264205277-en.
Conclusions and recommendations
While significant progress has been made in advancing the decentralisation reform in Ukraine, carrying this forward in the transport sector will require better co-ordination across different policy domains, across levels of government and across jurisdictional boundaries. This can help to improve policy coherence, boost investment in transport infrastructure, and lead to greater mobility – particularly in metropolitan areas. The Ukraine Transport Strategy 2030 provides a solid basis for reform, and the government should now turn its attention towards implementation, ensuring that local transport plans are adequately funded and based on realistic targets and milestones.
Developing decentralised governance arrangements in the transport sector will require stronger financial, operational and managerial capacities at local levels. Greater autonomy can enable local authorities to better enforce parking rules, traffic regulations and environmental standards, leading to greener and more sustainable public transport networks. The government could also take steps to reduce the influence of incumbent operators, and develop a more competitive environment for the provision of public transport services. Leveraging new technologies, such as big data, demand-responsive transport, car-sharing and ride-sharing schemes can also help to generate innovative mobility solutions.
Finally, a renewed focus on improving the performance of logistics systems is needed to lower transport costs and improve export competitiveness. Strengthening the co-operation between ports and port-cities is necessary to minimise the negative externalities incurred by cities as a result of port traffic and infrastructure, and to ensure that port-cities are able to share in the economic benefits of port activities.
To further support decentralisation in Ukraine’s transport sector, the OECD recommends:
-
Strengthening cross-ministerial co-ordination on transport policy, by developing new laws and regulations in close consultation with relevant line ministries (e.g. Ministries of Economic Development and Trade, Finance, Ecology and Natural Resources, Infrastructure and Regional Development).
-
Fostering horizontal co-operation across jurisdictional boundaries, where the scale of urban public transport extends beyond the administrative boundaries of cities.
-
Encouraging further use of inter-municipal co-operation (IMC) as a tool to develop mobility solutions across administrative boundaries, by expanding IMC agreements between unified territorial communities and non-amalgamated communities.
-
Developing transport networks and mobility solutions in metropolitan areas in line with functional urban areas.
-
-
Encouraging vertical co-ordination across levels of government, and with municipal transport companies and private operators, to improve the planning, operations and management of public transport services.
-
Clarifying the attribution of responsibilities relating to transport across levels of government, with clear delineation of responsibilities for financing, operations, management and maintenance.
-
-
Implementing the Ukraine Transport Strategy 2030, ensuring that local transport plans are adequately funded and based on realistic targets and milestones.
-
Boosting financial and managerial capacities for transport at local levels, by:
-
Increasing the collection of transport-related taxes, developing road tolling systems and leveraging road user charges, parking fees and speed enforcement charges.
-
Reducing overly generous subsidies by improving the balance between low public transport fares and the allocation of fare discounts and exemptions.
-
Introducing zonal fare systems, setting public transport costs based on the distance travelled.
-
Improving fare integration, with single tickets applying across multiple modes of transportation.
-
Conducting regular assessments of mobility systems through stated and revealed preference surveys.
-
Leveraging new sources of revenue, such as value capture taxes, to finance the construction and maintenance of transport infrastructure.
-
-
Strengthening enforcement of parking rules, traffic regulations and environmental standards, by:
-
Encouraging operators to conform to performance standards and regulations, by undertaking regular inspections and imposing sanctions when appropriate.
-
Ensuring inspection teams are appropriately staffed and have adequate supervision and enforcement powers.
-
Ensuring better enforcement of vehicle and emissions standards by city administrations, the police and the National Inspectorate for Public Transport.
-
Improving the infrastructure for walking and cycling.
-
Stimulating a competitive environment for the provision of transport services, by allowing city administrations to franchise routes and attract private operators that adhere to standards and regulations.
-
-
Establishing a logistics observatory, based on detailed commuter flow and travel cost data. The logistics observatory can help to inform:
-
Social research and evaluations of mobility provided by transport networks.
-
Cost-benefit analysis and feasibility studies for new infrastructure investment projects.
-
-
Leveraging new technologies, such as big data, demand-responsive transport (DRT), car-sharing and ride-sharing schemes, in order to generate innovative mobility solutions. This implies:
-
Strengthening data literacy and capacities to exploit new streams of data in local administrations.
-
Using mobility-related data to identify periods of low demand, areas that are poorly served by public transport or specific segments of the population (e.g. elderly, handicapped) in need of specialised mobility solutions.
-
Developing adequate funding models for DRT and designing schemes (e.g. routes, location of stops, frequency of services, etc.) in close consultation with users.
-
Improving mobility by combining existing mass-transit schemes with privately operated services in a single platform.
-
Managing population decline through strategic investments to improve the quality and efficiency of public transportation services.
-
-
Boosting the performance of logistics systems, by:
-
Focusing on much-needed improvements to customs efficiency and the quality of trade and transport infrastructure.
-
Harmonising regulations with neighbouring countries and providing accurate estimates of travel time and reliability, which can help to encourage investments in efficiency-enhancing logistics technologies.
-
Strengthening co-operation between ports and port-cities, to minimise the negative externalities incurred by cities as a result of port traffic and infrastructure, and ensure that port-cities are able to share in the economic benefits of port activities.
-
References
Autolib’ Métropole (2017), “Autolib’ Métropole avance avec vous : Rapport d’activité 2016”, Autolib’ Métropole, https://autolibmetropole.fr/presse/rapport-dactivite-2016-1.
Cabinet of Ministers of Ukraine (2016), State special programme on airport development to 2023 (“Derzhavna civіl'na programa rozvitku aeroportіv na perіod do 2023 roku”), Available at (in Ukrainian): http://zakon0.rada.gov.ua/laws/show/126-2016-%D0%BF.
ETSC (2018), “Road deaths in the European Union: Latest data”, European Transport Safety Council, http://etsc.eu/euroadsafetydata (accessed 11 February 2018).
Financial Times (2018), “Transport for London heading for £1bn operational deficit”, 11 February, Financial Times, https://www.ft.com/content/946204de-0dbb-11e8-8eb7-42f857ea9f09 (accessed 11 February 2018).
Foundation for Effective Governance (2011), “The current state of transportation infrastructure impedes economic growth”, Chapter 4, in: Ukrainian National Competitiveness Report 2011, Foundation for Effective Governance, www.feg.org.ua/en/reports/ukraine/2011.
GCEC (2016), The Sustainable Infrastructure Imperative: Financing for Better Growth and Development, Global Commission on the Economy and Climate, Washington, DC and London, http://newclimateeconomy.report/2014/wp-content/uploads/sites/4/2014/08/NCE_2016Report.pdf.
Île de France mobilités (2018), Les recettes de fonctionnement, https://www.iledefrance-mobilites.fr/les-recettes-de-fonctionnement/ (accessed 3 May 2018).
Kyiv City State Administration (2018a), “Structure” (in Ukrainian), https://kyivcity.gov.ua/content/26_struktura.html (accessed 31 January 2018).
Kyiv City State Administration (2018b), “Subordinated enterprises” (in Ukrainian), https://kyivcity.gov.ua/files/2017/12/22/Pidporyadkovani-DTI-KMDA-pidpryiemstva.pdf (accessed 31 January 2018).
Kyiv Department of Statistics (2018), “Passenger turnover and number of passengers carried in January-December 2017”, http://kiev.ukrstat.gov.ua/p.php3?c=1016&lang=1 (accessed 1 February 2018).
Ministry of Finance (2017), “Budget of Ukraine 2016”, https://www.minfin.gov.ua/uploads/redactor/files/Budget%20of%20Ukraine%202016.pdf (accessed 13 February 2018).
Ministry of Infrastructure (2017), National Transport Strategy of Ukraine 2030, Ministry of Infrastructure, Kiev, https://mtu.gov.ua/files/for_investors/230118/National%20Transport%20Strategy%20of%20Ukraine.pdf.
Ministry of Infrastructure (2015), Institutional mapping of road transport authorities in Ukraine.
OECD (2018), “Metropolitan areas”, OECD Regional Statistics (database), https://doi.org/10.1787/data-00531-en (accessed 8 February 2018).
OECD (2017a), “Infrastructure investment” (indicator), https://data.oecd.org/transport/infrastructure-investment.htm (accessed 30 January 2018).
OECD (2017b), Trade Facilitation Indicators dataset, www.oecd.org/trade/facilitation/indicators.htm (accessed 22 January 2018).
OECD (2016a), OECD Territorial Reviews: Japan 2016, OECD Publishing, Paris, https://doi.org/10.1787/9789264250543-en.
OECD (2016b), OECD Regional Outlook 2016: Productive Regions for Inclusive Societies, OECD Publishing, Paris, https://doi.org/10.1787/9789264260245-en.
OECD (2014), The Competitiveness of Global Port-Cities, OECD Publishing, Paris, https://doi.org/10.1787/9789264205277-en.
OECD/ECLAC (2012), Latin American Economic Outlook 2012: Transforming the State for Development, OECD Publishing, Paris, https://doi.org/10.1787/leo-2012-en.
OECD/ITF (2017), Managing the Transition to Driverless Road Freight Transport, International Transport Forum, Paris, https://www.itf-oecd.org/sites/default/files/docs/managing-transition-driverless-road-freight-transport.pdf.
OECD/ITF (2015), International Experiences on Public Transport Provision in Rural Areas, OECD, Paris, http://www.internationaltransportforum.org/Pub/pdf/15CSPA_RuralAreas.pdf.
Oh, Jung Eun and A.B. Nunez (2016), “Sustainable urban transport for Kyiv: Towards a sustainable and competitive city built upon the legacy system and innovations”, WB Report No. 107108, World Bank Group, Washington, DC, http://documents.worldbank.org/curated/en/640531472066198963/pdf/107108-REVISED-PUBLIC-Sustainable-Urban-Transport-for-Kyiv-June-27-2016-REV.pdf.
Pavlenko, D. (n.d.), “Cleared for take-off: The grand reform that awaits Ukrainian airports and aviation”, Deloitte, https://www2.deloitte.com/ua/en/pages/infrastructure-and-capital-projects/articles/cleared-for-take-off--the-grand-reform-that-awaits-ukrainian-air.html.
State Statistics Service of Ukraine (2018), “Gross regional product (2004 2015)”, https://ukrstat.org/en/operativ/operativ2008/vvp/vrp/vrp2015_e.zip (accessed 8 February 2018).
State Statistics Service of Ukraine (2015), “Transport and communication in Ukraine”.
Statista (2018), “Average cost for public transport (bus, tram or metro) in selected cities around the world in 2015 (in U.S. dollars)”, Statista, New York, https://www.statista.com/statistics/275438/public-transport-cost-cities (accessed 7 February 2018).
The Economist (2016), “Transport as a service – It starts with a single app”, 29 September, The Economist, https://www.economist.com/news/international/21707952-combining-old-and-new-ways-getting-around-will-transform-transportand-cities-too-it.
Ukraine Transport Policy Note (2016), “Updated National Transport Strategy of Ukraine. Part 1: Transport Sector Policy Note”, Support to the Implementation of the Association Agreement and the National Strategy in the Transport Sector in Ukraine, August, Dornier Consulting and egis international, http://mtu.gov.ua/files/Zakypivli/Ukraine%20Transport%20Strategy%20Part%201%20-%20POLICY%20NOTE.pdf (accessed 1 February 2018).
UNECE (2016), Infrastructure and growth: Sustainable development brief N°3, Geneva, https://www.unece.org/info/publications/sustainable-development-briefs.html.
URSSAF (n.d.), “Le versement transport et le versement transport additionnel”, webpage, Union de recouvrement des cotisations de sécurité sociale et d'allocations familiales, https://www.urssaf.fr/portail/home/employeur/calculer-les-cotisations/les-taux-de-cotisations/le-versement-transport-et-le-ver.html.
Wolanski, M. (2017), “Inter-municipal co-operation as a tool to foster road infrastructure development and efficient public transport service delivery”, presentation delivered at OECD seminar on Supporting Decentralisation in Ukraine: Fostering Inter-Municipal Co-operation for Improved Public Service Delivery, held on 18 July 2017 in Zhytomyr, Ukraine.
World Bank (2018), Doing Business 2018: Reforming to Create Jobs, The World Bank, Washington, DC, www.doingbusiness.org/~/media/WBG/DoingBusiness/Documents/Annual-Reports/English/DB2018-Full-Report.pdf.
World Bank (2016), Logistics Performance Index (LPI) dataset, https://lpi.worldbank.org (accessed 22 January 2018).
World Bank (2010), Ukraine: Trade and Transit Facilitation Study, Washington D.C., http://siteresources.worldbank.org/UKRAINEEXTN/Resources/TTF_April2010.pdf
World Economic Forum (2016), The Global Competitiveness Report 2016-2017, World Economic Forum, Geneva, https://www.weforum.org/reports/the-global-competitiveness-report-2016-2017-1

Source: Ministry of Finance of Ukraine (2017), “Budget of Ukraine – 2016”, in Ukrainian, https://www.minfin.gov.ua/uploads/redactor/files/Budget%20of%20Ukraine%202016.pdf (accessed 13 February 2018).
References
Foundation for Effective Governance (2013), Ukrainian National Competitiveness Report 2013: Towards Sustained Growth and Prosperity, Foundation for Effective Governance, www.feg.org.ua/en/reports.
Foundation for Effective Governance (2011a), “Quality of roads indicator”, Ukrainian National Competitiveness Report 2011: Towards Sustained Growth and Prosperity, Foundation for Effective Governance, www.feg.org.ua/en/reports (accessed 10 April 2017).
Foundation for Effective Governance (2011b), “The current state of transportation infrastructure impedes economic growth”, Chapter 4, in: Ukrainian National Competitiveness Report 2011: Towards Sustained Growth and Prosperity, Foundation for Effective Governance, www.feg.org.ua/en/reports/ukraine/2011.
Ministry of Finance of Ukraine (2017), “Budget of Ukraine – 2016”, in Ukrainian, https://www.minfin.gov.ua/uploads/redactor/files/Budget%20of%20Ukraine%202016.pdf (accessed 13 February 2018).
State Statistics Service of Ukraine (2015), “Transport and communications in Ukraine”.
Notes
← 1. Calculations based on OECD.Stat.
← 2. According to the World Economic Forum’s Global Competitiveness Report, 1 is extremely poor – among the worst in the world; 7 is extremely good – among the best in the world.
← 3. Source: ITF IRTAD Road Safety Database, www.itf-oecd.org/irtad-road-safety-database.
← 4. Based on data from the State Statistics Service of Ukraine, including pipeline transport.
← 5. Excluding five sea ports operating in the Autonomous Republic of Crimea.
← 6. In France, the closest OECD country to Ukraine in terms of territory, internal flights accounted for 25% of air passengers in 2016.
← 7. For a detailed discussion of the airport reform, see Pavlenko (n.d.).
← 8. For more details, see Box 2.2 in Chapter 2.
← 9. For a detailed list of ongoing IMC projects, see: www.minregion.gov.ua/wp-content/uploads/2017/04/reestr-11.01.2018.pdf.
← 10. A new concession law is being drafted with support from the European Bank for Reconstruction and Development to replace the outdated 2001 concession law.