Chapter 3. Health care system in Lithuania: Efficiency and quality
This chapter assesses the efficiency and quality of health care in Lithuania. Given its income and investment in health, comparisons consistently show that Lithuania could be achieving better health outcomes. The necessary adaptation of service delivery is well under way. Primary health care is given a large responsibility in managing the population’s health and its organisation emulates best OECD practices. Progress towards the rationalisation of the hospital sector has been slower and recent efforts to improve public health and to control risk factors must be sustained. In recent years, an increasing number of measures have sought to improve quality. Overall, results have improved, sometimes rapidly, but Lithuania often remains on par with low-performing OECD countries.
The statistical data for Israel are supplied by and under the responsibility of the relevant Israeli authorities. The use of such data by the OECD is without prejudice to the status of the Golan Heights, East Jerusalem and Israeli settlements in the West Bank under the terms of international law.
Introduction
High-level analyses suggest significant scope for improving the efficiency and quality, in particular the effectiveness, of service delivery in Lithuania. Even though life expectancy is rising in Lithuania, it does not meet the levels which can be expected relative to income (GDP) and health spending levels. Several other central European and OECD countries with the same level of health spending and income have a considerably higher life expectancy (Figure 3.1). These findings were confirmed by a European Commission study analysing the relative efficiency of European countries which related both life expectancy and amenable mortality to various indicators of system resources, financial as well as human and physical. The results consistently show that Lithuania has one of the highest potential gains in health outcomes given the resources used (Medeiros and Schwierz, 2015). In Lithuania, both preventable and amenable mortality are high compared to other European countries. This means the Lithuanian life expectancy should improve both by reducing risk factors like smoking, alcohol and traffic, and by improved effectiveness in the services provided.
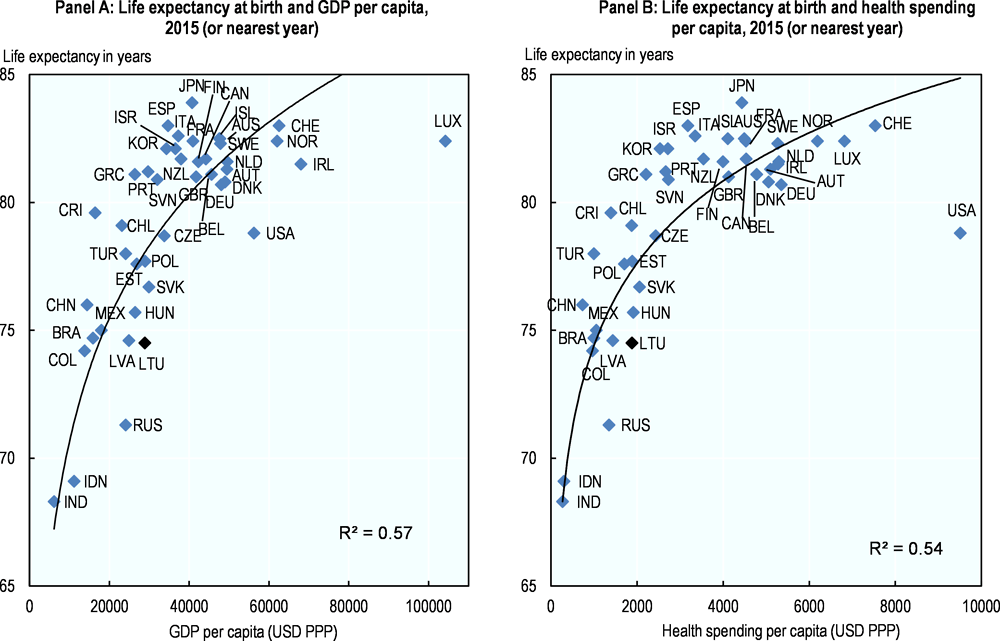
Source: OECD Health Statistics 2017, https://doi.org/10.1787/health-data-en (data refers to 2015).
In order to refine this initial diagnostic and suggest ways forward, this third chapter analyses the policies in place to increase efficiency (3.1) and quality (3.2) and assesses the current performance of Lithuania in this regard.
3.1. Efforts in rebalancing service delivery must be pursued and deepened to increase efficiency.
The question under consideration here is whether the Lithuanian health system is organised in a way which is conducive to maximising value for money. Rebalancing service delivery and investing in public health are key elements of Lithuania’s strategy in this regard. Prior to 1990, the role of primary health care and health promotion was limited and services were predominantly delivered in a range of hospitals, which were numerous and frequently narrowly specialised by disease or population segment. Reorganising the hospital sector and reducing its size, rebalancing service delivery in favour of a modernised and considerably strengthened primary care and developing better strategies to tackle risk factors have been the main drivers behind service delivery reforms in Eastern and central Europe since transition. Lithuania is no exception and all stakeholders have been consistently aligned behind these priorities.
This section describes how Lithuania has reshaped its health service delivery system to adapt the role of hospitals and fundamentally modernised primary health care (PHC), and points to areas which need further development. It also reviews mental health and efforts to strengthen public health.
3.1.1. Lithuania’s steady efforts to overhaul the hospital sector need to be pursued
Lithuania has achieved a substantial reconfiguration of its hospital system
The current configuration of the hospital system represents progress in shaping the hospital sector. In 2015, there were 119 public hospitals (legal entities), which represents a considerable drop from the 1991 level of 202. The number of monoprofile hospitals has substantially decreased (from 39 in 2001 to 14 in 2015), through closures or administrative integration with general hospitals (there is only one self-standing TB facility and no administratively independent infectious diseases hospitals). The MoH manages 10 “republican level” facilities which are generally large (700 beds) and there are 49 smaller municipal hospitals (180 beds on average). The private sector includes 10 small inpatient facilities, a handful of specialised facilities and seven outpatient surgery centres (Table 3.1).
Many countries have been more effective in consolidating hospital infrastructure. Despite the progress noted, Lithuania still has a very large number of hospitals, with at least one in almost every municipality and a high number of beds. Since 1992, more than half of the beds have been closed through administratively planned downsizing and application of incentives such as shifting the funding to an output based reimbursement. However, most of this reduction took place in the 1990s. The number of beds has continuously declined. Nevertheless, Lithuania’s fast shrinking population led to increases in number of beds per capita during the years 2000s, so today Lithuania remains with Germany, Austria and Hungary among the European countries with the most hospital beds. Compared to neighbouring Baltic countries, the pace of change in reducing hospital capacity has been relatively slow: between 2000 and 2015, the number of beds in Latvia dropped by 54%, in Estonia by 42% and in Lithuania 27% (Figure 3.2).

Source: OECD Health Statistics 2017, https://doi.org/10.1787/health-data-en.
There is still room to further rationalise the hospital sector
Average lengths of stay average are relatively short with a notable exception. The average length of stay (ALOS) for curative care, at 6.3 days (2015), compares well internationally and is below the OECD average (6.7). But this number has not progressed the last five years. Tuberculosis stands out as one diagnostic area in which Lithuania has distinctively long treatment lengths. Long length of stays corresponds to a traditional and some would argue outdated inpatient mode of treatment for TB which characterises many former Soviet countries. Nonetheless, at 102 days (2015), Lithuania ALOS is twice as high as most Baltic neighbours and Central European countries, and compares poorly with the OECD average of 24 days.
The low and very variable bed occupancy rate indicates the hospital sector remains in overcapacity. In 2015, among the 65 public general hospitals, the average bed occupancy rate was 73.5% (or 268 days per year), which is below the OECD average of 77%. There are however large variations among general hospitals (Figure 3.3) with predominantly small hospitals reporting very low rates. This means that many beds are not used at all. The current health system development plan aims to increased bed occupancy levels and sets a target of 300 days per year (above 82%). In 2015, only 4 of the 65 public general hospitals in Lithuania met this target. In fact, the bed occupancy rate was lower than 60% in 13 public hospitals.

Source: Ministry of Health, Lithuania.
Payment systems and contracting methods have been increasingly leveraged to encourage more efficient modes of delivery
DRGs combined with volume caps seek to encourage efficient delivery and lower volumes of inpatient hospitalisations. In 2012, a DRG system based on the Australian coding and diagnosis grouping was introduced and continues to be fine-tuned. For example, Lithuania is developing new cost weights to ensure relative prices reflect more closely the local cost structure of service production. The DRG system allows payments to hospitals to mirror their patients’ case-mix and incentivises the more efficient production of treatment episodes. It can also potentially encourage increases in the number of hospitalisations. In order to counteract this incentive, contracts between the NHIF with individual facilities include volume ceilings for in-patient services which are decreased year-on-year. Some services, such as the care of children under age three, obstetrics and specific acute procedures are not capped though. Additionally:
-
To encourage reductions in volumes without penalising hospitals with proportionally reduced budgets, if the volume of a specific inpatient service is below the amount agreed in the contract, the price index for the service is increased and the hospital can receive at least part of the initially planned budget for the given year (but no more).
-
If the volume of a specific inpatient service is more than 10% above the national average in a given area, no new contracts can be signed with additional providers (conversely, new contracts can be signed if the exiting volume is 10% below the national average).
-
For all services, if volumes exceed the contractual volumes, additional cases are reimbursed at a lower rate.
Contracting and payments have also effectively encouraged the development of day-cases and outpatient surgery. The Ministry has introduced and regularly updates a list of surgeries and procedures which can be performed as day-cases since 2007 and outpatient surgery since 2013. In Lithuania, outpatient surgeries are those performed without general anaesthesia, and they are paid based on a price-list established by the Ministry. “Day-cases” include hospitalisation which are typically less than 24 hours but can be extended up to 48 hours if necessary. In order to encourage their development, since 2012, they are paid at the DRG full price. In addition, for individual hospitals, day-cases volumes are not capped. Among the 71 main procedures eligible to be performed as day-cases, the proportion actually performed as day-cases was 58% in 2016, an increase of 20 percentage points compared with 2012. In 2016, tonsillectomies were included in the day-case list and around 45% were performed as day cases that same year. In other words, hospitals are actively developing the day-case activity.
Due to Lithuania’s definition of day-cases, its progress in developing shorter surgeries is probably underestimated in international comparisons. International standards define day surgery as care provided to patients formally admitted to a hospital and discharged the same day. By this measure, Lithuania is very much lagging behind in developing modern approaches to hospital treatment, but the picture looks very different if the local definition of “day case” is used. For instance, while 0.3% of Laparoscopic cholecystectomy were carried out on an ambulatory basis by international statistical standards, a level similar to most Central European countries, nearly 36% were conducted in day-surgery – and patients released within 48 hours (Figure 3.4).

Source: NHIF and OECD Health Statistics, https://doi.org/10.1787/health-data-en.
Further consolidation of service delivery is warranted on efficacy and safety grounds and steps have been taken in that direction.
Surgeries are carried out in the vast majority of hospitals in Lithuania, which is inefficient and also carries a risk for patients. Of the 65 hospitals with a general profile contracted by the NHIF, 52 provided at least one surgical procedure in the year. Among them 22 carried out less than 250 procedures, which is roughly one per (business) day. Moreover, the number and complexity of these procedures varies considerably across hospitals, and many carry out major surgeries at very low frequency, for instance:
-
45 hospitals undertook appendectomy, but 23 of these performed appendectomies less than once a week;
-
37 hospitals conducted hysterectomies or C-sections, but among them 15 undertook any one of these major obstetric intervention less than once a week;
-
24 hospitals performed hip surgery, but while 5 performed them less than once a week, the 7 busiest one did more than 11 such surgeries per week.
In the vast majority of cases, these surgeries can be programmed. Concentrating their delivery in a few places could allow a more efficient use of staff and equipment. More importantly, the fact that so many facilities carry out few surgeries raises serious concerns about their capacity to deliver good outcomes.
The decision to use minimum volume thresholds for contracting is a bold step in the right direction. Lithuania intends on concentrating services in fewer places and is using volume targets for obstetrics and common surgeries in contracting to that effect. Since 2016, the plan is that unless a hospital is more than 50km away from the nearest one, or it has recently received specific investments, it will no longer be contracted by the NHIF when if carries out fewer than 300 births per year or less than 400 major surgeries. In 2015, half of the public general hospitals in Lithuania (31 of 65) had an obstetric department. In 14 of these, less than 300 deliveries were conducted.
There is evidence that concentration can be achieved in Lithuania: transluminal coronary angioplasties are only carried out in 5 public hospitals, on a very large scale, and less than two times a week in a private facility. Cataract surgery is also concentrated: 12 hospitals provide the service and only 4 of those in low volumes (less than 150 in a year).
The proposed leveraging of contracting to foster concentration is both innovative and welcome. The actual implementation of the measure could be monitored and its impact including on access and outcomes should be evaluated.
Further restructuring will require planning and organising service delivery at a higher level of government. Overall, Lithuania needs to further consolidate hospital infrastructure on efficiency and safety grounds. The reconfiguration of hospital service delivery is difficult in all countries. Progress in Lithuania has been hampered by the fact that municipalities, which own and manage hospitals, have a natural tendency to protect local interests, in terms of perceived access to services or simply employment. Many countries in the wider Europe region have realised that the distribution of hospitals services needs to be decided at a higher level than the municipality. In Finland, hospital boards jointly manage several municipal hospitals, and the soon to be created counties will actually be responsible for jointly planning and coordinating service delivery across all health and social care previously delivered by municipalities. Austria, Denmark and Croatia have also re-concentrated the responsibility for planning and organising hospital service delivery at increasingly higher levels of government. Sweden is considering a consolidation of administrative levels. Similarly, the reorganisation of hospital service delivery will also need to be decided and governed across sets of municipalities. This might require a formal national service plan to be formulated. In addition, the governance and ownership framework of hospitals may need to be adapted to enable and incentivise reorganisation of service delivery across municipal and possibly regional boundaries.
3.1.2. Lithuania has developed a modern primary health care system
Lithuania clearly recognises that a strong primary health care is the foundation of a health system that is effective, efficient and responsive to patients’ needs and has developed the system accordingly.
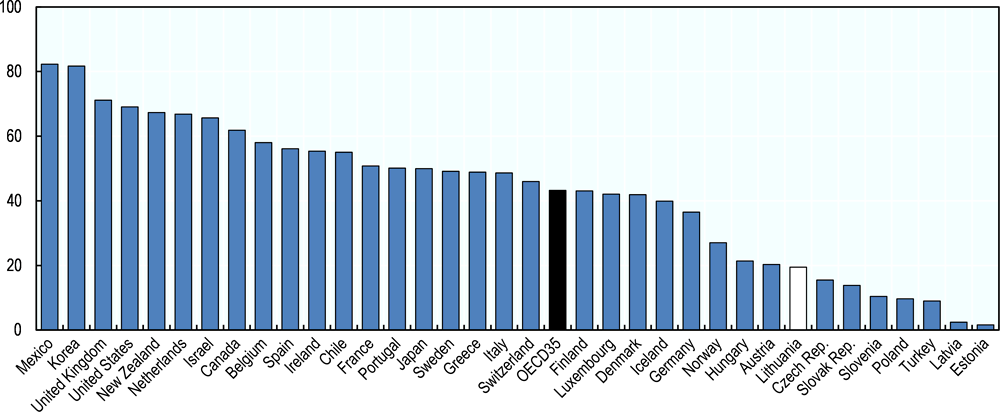
The number of trained general practitioners is now higher than in many OECD countries. As other former Soviet republics, Lithuania inherited a policlinics-based PHC sector in which frontline services were delivered by internists, gynaecologists and paediatricians. General practice was introduced as a clinical and licensed specialty in the nineties and the workforce has increased rapidly. In 2015, GPs represented 83% of primary care physician workforce in Lithuania (versus 7% in 1998 and 60% in 2000). Today, the number of GPs per population is higher in Lithuania than in most OECD countries (Figure 3.5). Where GPs are not available, teams of specialists (internist, paediatrician, gynaecologist, and surgeon) continue to jointly deliver primary care.

Source: OECD Health Statistics 2017, https://doi.org/10.1787/health-data-en.
Nurses are an inherent part of the PHC workforce and their role is continuously expanding. A primary care team contracted by the NHIF must include a primary care or community nurse. Since 2015, nurses can prescribe medical aids (under physician supervision) and have been given a greater role in providing services to chronic patients with non-communicable diseases (lifestyle counselling, self-care and monitoring of health status during checks-ups). A few (75) primary health care facilities also employ diabetes nurses who provide diabetic foot care, lifestyle counselling, self-care and monitoring of health status1. Nurses can undertake home visits (paid on top of the capitation) and since 2016 can be independently contracted by the territorial insurance funds to that effect. In 2015, a two-year master’s degree for advanced practice nursing was introduced and the new graduates are also expected to take an increasing role in primary care for of chronic patients, as well as anaesthesiology-intensive care and emergency care.
Primary care services are delivered in a variety of public and private settings remunerated through a mixed but predominantly capitation-based system. Most PHC facilities are owned by the municipalities but private clinics can open and work on the same terms as public. In cities, polyclinics also include outpatient specialists. In remote areas public facilities can also run community medical dispensaries to bring services closer to the population. Public facilities are typically larger entities: they represent 39% of PHC providers but cover around 70% of the population. Public and private providers are all contracted and monitored the same way. A little less than ¾ of their remuneration comes from a capitation adjusted for age and they receive additional payments to incentivise quality (see next section). In effect, the majority of PHC is provided by publically employed GPs working in groups, while some clinics in terms of staffing look like traditional polyclinics.
Primary care providers have been given a key role in managing patients’ health. Virtually the entire population is registered with a GP or a primary care team. Gatekeeping was introduced in 2002. Patients cannot obtain free PHC services unless they are registered with a GP and referrals are required for specialised care in most cases. PHC providers are financially incentivised to deliver specific services and expected to coordinate patient care. They must also be informed about care provided by others (specialists, hospitals). The number of PHC visits per person per year has increased from 4.8 in 2007 to 5.7 in 2014.
PHC providers effectively contribute to the continuity of care. PHC providers are required to ensure access to care 24/7. Compared to the EU average, a smaller share of emergency department visitors report they did so due to unavailability of primary care, suggesting that PHC is relatively effective at providing services including outside of core business hours (Figure 3.6).
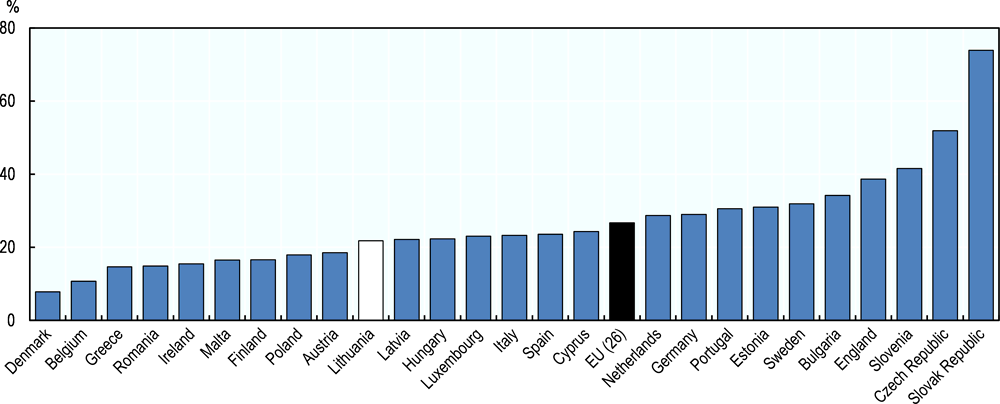
Source: van den Berg et al. (2016)
GPs’ role could be further strengthened in some areas, on efficiency but also quality grounds. The delineation of responsibilities between GPs and specialist needs to further evolve. GPs believe that some guidelines continue to unnecessarily limit their responsibilities. For some chronic diseases (e.g. diabetes, cardiovascular diseases), the PHC doctor is obliged to refer the patient to a specialist once per year. After the first visit, patients can choose to go to the specialist directly for further monitoring and treatment. In other cases (type 2 diabetes for children, asthma) guidelines further specify conditions for referral or limit GPs’ scope of practice. In the absence of evidence of the effectiveness of these strategies, a case can be made that such mandatory referrals effectively take the responsibility for case management away from the GP and signal that the PHC cannot take responsibility.
3.1.3. Lithuania needs to further strengthen mental health services and curb suicide incidence
Awareness is high about mental health problems, as shown by the many strategies developed to respond to the problem. The 1998-2010 National Health Programme had several specific mental health objectives, some of which were implemented, such as the development of municipal Mental Health Centres. In 2007, the Lithuanian Mental Health Strategy outlined several guiding policies to create effective local services in primary care, schools and social services, including strengthening the role of general practitioners (GPs) in the provision of mental healthcare. The State programme for development of public health care in municipalities 2007-2010 led to the creation of the Public Health Bureaus network, which is also responsible for the promotion of mental health and prevention of mental disorders. More recently, the strengthening of mental health services was one of five objectives laid out in the health programme of the government adopted by Parliament in December 2016 (Parliament of the Republic of Lithuania, 2016).
In line with its strategies, Lithuania has reformed the service delivery structure for mental health services. Over the last 15 years, Lithuania has moved a substantial part of the institutionalised psychiatric and substance abuse services into general hospitals and outpatient mental health centres. At the same time, with investments, infrastructure conditions have improved in many psychiatric wards and departments. At the primary care level, services are delivered in 115 mental healthcare centers (MHC), which are sometimes co-located with PHC centers. MHCs are funded though capitation by the NHIF. Patients can be referred to primary level mental health services by their GP or the hospital, but also access directly.
Services in MHCs are delivered by multi-disciplinary teams of mental health workers but the workforce needs to be further developed. MHCs are meant to include psychiatrists, mental health nurses, psychologists and social workers. However, the recruitment of personnel, notably psychologists and particularly in rural areas is difficult. In 2016, there were 90 psychologists for 115 centres and geographic imbalances are a chronic problem (European Commission, 2013). In practice, the availability of services is limited: a study by the National Audit Office (2017) found, for instance, that 31% of the surveyed mental health centres staff worked less than five hours per day. Additionally, the regulations (including licensing) and guidelines surrounding psychology and psychotherapy are incomplete, the use of structured diagnostic tools limited and cognitive behavioral therapy seldom available.
Poor coordination among institutions is recognised as a major issue. The availability and proximity of mental health and primary care services does not systematically translate into a functional team approach and effective mechanisms to detect illness and meet the patients’ needs. The majority of GPs state they would like to collaborate more with mental health specialists (Jaruseviciene et al, 2014). Coordination between hospital and outpatient care is also insufficient which might contribute to explaining why the suicide rate one year after hospitalisation among patients diagnosed with a mental disorder (0.73 per 100 patients) is substantially among the highest reported in the OECD.
In 2017, the National Audit Office called for renewed efforts to identify and support individuals at risk and ensure immediate and continuous support to people who have attempted suicide and emphasised the need for information sharing between institutions about individuals at risk (National Audit Office, 2017).
Primary care staff need more training and tools to fulfil their task and manage the large responsibility they have been given. Primary care should be able to play a large role in provision of mental health for patients with mild and moderate disorders. But several Lithuanian studies show that mental health issues are poorly identified and managed in primary care (Bunevicius et al., 2014 and Peceliuniene J., 2011). In contrast to the strategy to meet a larger share of mental health problems on the primary care level, GPs feel inadequately prepared to address the problem. Even if GPs feel the responsibility to manage patients’ mental conditions, a direct referral to a psychiatrist or psychologist is the most common action. GPs have low confidence in the field of mental health. Only 8.8% of GPs agree with the statement “My knowledge in mental healthcare is sufficient”, although rural as well as younger GPs express larger confidence in engaging in the mental healthcare of their patients (Jaruseviciene et al., 2014). Additional efforts are required to increase the capacity of the primary care system to recognise, treat and manage common mental disorders and increase access to psychological treatments.
More broadly, Lithuania could consider undertaking a systematic assessment of the current mental health service delivery system, focusing in particular on the effectiveness of - and coordination between - mental health care teams, inpatient psychiatric facilities and other segments of the health care system, including primary care. This should help identify a way forward.
3.1.4. Public health policies must be strengthened
Measures to reduce harmful alcohol consumption have been considerably strengthened recently and their effectiveness will need to be monitored
The main challenges with regard to the state of public health are well recognised. The populations’ health status and behaviours indicate a sizeable room for improvement. The 2014-2025 Lithuanian Health Strategy specifies concrete goals with regard to reducing harmful alcohol consumption, tobacco, drugs and psychoactive substances, as well as encouraging healthy nutrition and physical activity. The Strategy has an impressive cross-sectorial framework (involving nearly all Ministries), and the MoH is responsible for monitoring of the implementation. The intermediate evaluation of the progress is due in 2020.
Lithuania has intensified measures to tackle the exceptionally high alcohol consumption. At the national level, the alcohol control law was amended in 2014, and new restrictions were introduced in 2016, for instance, banning the sale of alcohol products in gas stations. The tightening of alcohol legislation was one of the priorities of the government elected in 2016. In June 2017, the parliament approved the introduction of multiple alcohol restrictions, which came into effect 1st of January 2018. From this date Lithuania has a full ban on alcohol advertisement on TV, radio and internet. Alcohol sales hours were shortened by two hours in the morning and two in the evening and are now only allowed from 10 a.m. to 8 p.m. Monday to Saturday, with further restrictions Sundays. The minimum legal age for buying and consuming alcoholic beverages has been extended from 18 to 20 years. In the new legislation, retailers are responsible for controlling the age of buyers, and local governments given increased authority to limit and control sales hours in both shops and restaurants. Caterers, bars and restaurants are not limited by the time restrictions, but from 2020 further restrictions on sales come into effect, including limitations of out-door sales, for example a ban of sales on beaches, and a 7.5% alcohol limit on beverages sold during public events.
Tax increases were modest until 2017 and alcohol has become more affordable over time. Alcohol taxes (excise rates per hectolitre of pure alcohol) have been raised several times since 2000 but the increases have been low and sporadic. Between 2001 and 2008 the excise rate was even kept constant in nominal terms on beer and high alcohol-content beverages and from 2008 until 2016 increases were marginal. The prices of alcoholic beverages in Lithuania are 9% below the EU average (2016) and while food prices in Lithuania have tended to converge with average EU prices, the prices of alcohol have been more slow to do so and in fact diverged from the EU average between 2008 and 2015 (Eurostat, 2017). To put another perspective on this question of affordability, Lithuanians have experienced large increases in real wages over the last two decades, with the exception of a few years around the financial crises, while the prices of alcohol have increased much more slowly (Figure 3.7). As a consequence, alcohol affordability in Lithuania has increased substantially. Between 1996 and 2004 Lithuania had the largest increase in alcohol affordability among today’s EU countries, mostly driven by a real wage increase (Rabinovich, L. et al., 2009). However, in parallel with other restrictive policies on alcohol, Lithuania raised most alcohol excise rates in March 2017 substantially, e.g. from 336 to 711 Euros per hectolitre pure alcohol on beer (MoH).

Source: Wage rates; International Financial Statistics, IMF. Food and alcohol; Eurostat (Harmonised Index of Consumer Prices).
Pricing policies and advertising regulations can be effective and cost-saving strategies to reduce harmful use of alcohol. However, restrictions in alcohol advertising are increasingly challenged by the spread of advertising on Internet, including social media (Sassi, 2015). More broadly, the degree to which alcohol use-related policies are enforced in practice is of utmost importance. After the recent changes in legislation and increase in excise rates, Lithuania should carefully monitor and evaluate enforcement level of these policies already in place before designing and implementing any new solutions. If enforcement is weak, restrictions on access and raised legal purchase age from 18 to 20 years can be inefficient at best, or at worst, lead to further development of the black market, already very high in Lithuania.
Additional gains in health and life expectancy can be obtained through interventions targeting heavy drinkers. Brief interventions typically targeting high-risk drinkers in primary care settings have been found the most effective in other OECD countries (Sassi, 2015). Although they are expensive to implement, they become cost-effective several years after their implementation. Similarly, drug and psychosocial therapy of alcohol dependence and worksite-based interventions are also effective, with favourable cost-effectiveness profiles in the long run. So far, targeted interventions at primary care level have received little attention in Lithuania.
Public health interventions need to become more effective and better embedded
In general, evidence that highly effective public health interventions are actively pursued is limited at all levels. Concrete initiatives have been few or remain described in general terms. At the local level, the responsibility for public health mainly lies with municipalities, who are encouraged to set up and run (or contract if they do not have one) Public Health Bureaus (Kalediene et al. 2011). Lithuania currently has 47 such institutions across the 60 municipalities. However, municipalities are for the most part free to choose the activities they implement and decide on their level of effort. No framework is in place to help ensure that local-level stakeholders implement evidence-based interventions or are accountable for progress on results (as opposed to simply implementation).
A programme has nevertheless been set-up to develop joint health promotion efforts between public health bureaus and PHC providers. Since 2015, once a year, PHC providers can order free of charge diagnostic tests for patients (men aged 40 to 55 and women aged 50 to 65 years) with risk factors for CVDs (obesity, smoking, harmful alcohol consumption). The intervention consists in setting up an individual CVD prevention plan, a suggestion to attend a programme of a health promotion lectures at a Public Health Bureau, and a referral to a secondary care specialist if necessary. Around 1500 people were registered in 2015. In 2017, a similar programme is being launched for people at risk of diabetes. Outside these programmes, the Public Health Bureaus decide on their activities quite freely depending on available budget, with most initiatives focussing on alcohol abuse.
Overall, most public health efforts are geared towards small initiatives which are insufficiently evaluated. Most interventions, such as information sessions on harmful alcohol use or benefits of healthy diet at the Public Health Bureaus, are assessed in terms of process indicators, such as a number of participants, and not with regard to outcomes. Project design, including monitoring and evaluation, must focus also on the effectiveness of these actions. This could improve results, which has been below expectation in many programmes, notably those targeting harmful alcohol consumption. The above-described prevention programmes for patients at risk of CVDs included a comparison of health outcomes (mostly self-reported data) before and after the intervention but it has not been evaluated. Evidence on the effectiveness and cost-effectiveness of public health policies could support decision-makers in implementing the most suitable actions, especially to reduce the alarmingly high alcohol-related harm.
Further priority can be given to increased and stable funding for public health services. Lithuania allocates 1.9% (2016) of health spending to preventive services, noticeably below the OECD average, although this number does not include the ambitious intersectoral collaboration, and prevention efforts in primary care. Many development initiatives and research projects are conducted within time-limited EU funded projects. While project based testing and piloting is good to find effective approaches, there is a risk that many good projects will not be sustained without a more robust financing framework for these functions. The Public Health Strengthening Fund, operational since 2016, is founded to finance disease prevention, social advertising campaigns and health research. The funding comes from an ear-marked share of the alcohol tax and can mitigate dependence on EU grants. But its resources are limited. In 2016, 1.3 million euro was allocated to this fund (MoH). The fund is also, just like EU funding, set up to support projects, not institutionalise services.
Finally, on the public health front, it is worth noting that despite relatively low levels of antibiotic consumption, antimicrobial resistance is a concern in Lithuania. The consumption in the community of antibiotics in Lithuania stands at 16.9 DDD per 1 000 inhabitants per day (2016, ESAC-Net), considerably lower than the EU average (21.9). Yet, the levels of antimicrobial resistance (AMR) for most pathogens under surveillance by the European Centre for Disease Control are high (ECDC, 2017). In 2015, Lithuania introduced nation-wide regional AMR management groups in the regional public health centres, to coordinate expert from different sectors (Hygiene Institute), but further efforts to change clinical behaviour, in both PHC and the hospital sector, are needed.
3.2. Efforts to improve quality must be intensified
This section first describes the main features of the existing quality assurance framework and some recent policies which explicitly aim to improve quality, including efforts to collect and use data on quality. Subsequently, data on quality which allows for comparison with OECD countries is analysed. It generally shows that despite some progress, Lithuania still ranges towards the bottom of the OECD distribution for most indicators.
3.2.1. Lithuania has put in place a number of initiatives to support improvements in quality of care
Policies and institutions to improve quality of care are slowly developing.
The State Health Care Accreditation Agency (SHCAA) is the main institution in charge of quality assurance. The SHCAA, subordinated to the MoH, has long been in charge of licensing of health care organisations and most professionals. Public and private health care organisations must comply with certain input-related requirements – regarding facilities, medical devices, staff – as well as process requirements – regarding governance, quality management, medical audit, clinical care protocols, registration of adverse events, collection of patient feedback, and respect for patients’ rights. Health care professionals’ licencing requires a minimum number of hours of professional training. The SHCAA can inspect facilities either to investigate patients’ complaints or to verify that licencing criteria are met.
The SHCAA has recently launched an accreditation programme, but it seems to attract few providers. In March 2016, an accreditation programme was initiated to promote quality improvement, which is voluntary and currently limited to PHC providers. By the end of 2016, only five PHC organisations had applied for accreditation and ten more were in the preparation stage (Ministry of Health, Lithuania, 2016). In January 2017 a financial incentive in the form of a marginally higher capitation for accredited clinics was introduced, although it seems to be inadequate to substantially raise interest, possibly because of the accreditation fee clinics have to pay. By the end of 2017 only 16 institutions were accredited (SHCAA, 2018).
Some clinical guidelines exist but information about their effective use is lacking. The Ministry of Health has issued 123 diagnostic and treatment protocols (in cardiology, oncology, neurology, traumatology and paediatrics). Providers are encouraged to follow them, regardless of the ownership or level and volume of the services provided. If there are no nationally approved protocols, health care providers are required to prepare protocols themselves for the high risk diagnostic and treatment procedures (Ministry of Health, Lithuania, 2016). No mechanisms are in place to monitor compliance or support providers in implementation. To date, patient safety has received very little attention. Overall, Lithuania lacks a system-wide support for continuous health care quality improvement.
Some initiatives put greater emphasis on measuring and – at least for primary care – rewarding quality
Quality is increasingly monitored and Lithuania in 2017 reported data on a range of OECD-HCQI indicators. In 2012, a set of 15 quality indicators for hospitals was adopted, in line with the PATH (Performance Assessment Tool for Quality Improvement in Europe) recommendations. Quantitative indicators include for instance the frequency of Caesarean sections, mortality from myocardial infarction during active treatment, mortality from stroke during active treatment, and the frequency of development of pressure ulcers. Qualitative indicators pertain to patient satisfaction and the presence of some processes (for instance adverse event reporting system). However, the procedure for engaging hospitals in a quality discussion, limited to a yearly discussion of the results between the managers of the facilities and the NHIF, is weak. Hospital remuneration is not tied to quality. For primary care, a set of indicators is used to calculate a performance-based add-on to the capitation (see below). It is worthwhile highlighting though that in 2017 the MOH participated in the OECD HCQI data collection efforts, the results of which are analysed further below.
Information on quality is shared transparently in an effort to support an informed choice for patients. Quality indicators for hospitals are published annually on the website of the SHCAA. For primary care, many quality indicators are calculated to facilitate bench marking by clinics and municipalities. For example, the Hygiene Institute routinely produces avoidable hospitalisation rates for each municipality. For patients, data on individual facilities’ performance is readily available on-line, published by the five territorial insurance funds. While this is a very welcome step towards improving transparency, further steps could be taken to contextualise and make this information interpretation-friendly. For example, the five funds provide different level of detail and present the data in different ways on their respective websites.
PHC remuneration is organised to reward performance, through fee for service and a pay-for-performance component. Facilities receive an age and sex-adjusted capitation rate (72.9% of total PHC facilities’ revenue in 2016) with an additional per capita amount for rural facilities (7.1% of revenue). PHC providers also receive activity- or output-based payments for a list of specific services (10.7% of revenue). The list of 63 services which render additional payments includes immunisation, monitoring of pregnant women, early diagnosis of tumours, and home visits by nurses. The final element of remuneration is a result-based payment based on a list of performance indicators (9.3% of revenue). In recent years, the share of capitation in total revenue for PHC providers has declined in favour of higher performance payments.
The performance based payment for PHC is well intended and monitored, and some indicators show improvements. Twelve indicators are taken into account to determine the payment. They include to the proportion of registered adults who visits the clinic at least once per year. For children, the same indicator is used plus one for the share of children who received a dental screening. Four indicators monitor cancer screening (breast, cervical, colorectal and prostate cancer screening) and four indicators relate to results achieved for chronic patients: hospitalisations of patients with asthma, diabetes, hypertension and schizophrenia. Given the burden of disease and the still relatively low screening rates (see below), the focus on non-communicable diseases of the pay-for-performance is welcome. Results are monitored by the NHIF, which for instance show that the cervical cancer screening rate for registered patients rose from 23 percent in 2008 to 35% in 2015. Other screening rates are also improving and hospitalisation rates for chronic diseases are decreasing, albeit slowly. There is however large room for improvement, as compared to other countries (see next section). In the absence of an evaluation framework, the impact of the scheme is difficult to ascertain.
A review and revision of the pay-for-performance component would be warranted. The knowledge base on indicators which should be used for adequately remunerating performance suggests a number of good practices (McColl et al., 1998, EXPH 2017). In particular, the performance criteria should point to results which can be directly influenced by the provider and are sensitive to their level of effort, reflect important clinical areas, but also more generally encourage the delivery of appropriate services. In this regard, the indicators used in Lithuania could be improved. For example, a high share of listed adults who visit PHC over one year, which generates a bonus payment, does not necessarily mean the clinic meets those in most need of a consultation. Furthermore, general check-ups for healthy adults are not shown to improve morbidity or mortality. Finally, access in Lithuania is well developed (previous chapter) and in 2016, 92% of PHC clinics reached the highest level of performance on this indicator. Therefore, the usefulness of this indicator in the performance scheme could – at this point – be debated. As another example, the indicators on avoidable hospitalisations which are certainly relevant to monitor the performance of PHC at a high-level, may not be so appropriate at the level of a single (especially small) facility as they are not only impacted by primary care. Additionally, the denominator (number of listed patients diagnosed with a certain chronic disease) can be affected – and potentially manipulated – in response to the performance scheme, calling its robustness in question. For chronic diseases, performance schemes typically use processes indicators to reward clinical excellence (for example, blood pressure checks for patients with hypertension, tests for HgbA1c for diabetic patient) or better intermediate outcomes (for example, cholesterol control in people with diabetes or controlled blood pressure). So, while monitoring and rewarding performance may be appropriate, the current system could be better calibrated.
Additional measures directly support the delivery of more effective services
In recent years, Lithuania has undertaken two interesting initiatives to strengthen specific services which have a strong potential to increase the effectiveness of service delivery and thus quality.
An EU-funded programme supporting the integration of health and social services has been the main initiative to encourage care co-ordination. In Lithuania, efforts to encourage the coordination of care across health providers are essentially limited to requirements made for providers to communicate with one another when patients move across different parts of the system. In 2013 however, the Ministry of Social Security and Labour launched the Integrated Assistance Programme to offer integrated health and social care to the disabled and elderly. In 21 municipalities, 70 mobile teams provide integrated services (nursing and social care) at home, including support to their informal care givers. Funding from the EU will support the expansion to all municipalities but funding is only secured until 2020. The project-based approach can help devise effective solutions to integrate services, but carry a risk that they may not be sustained. Given the increasing population at need for such services, the programME should be carefully evaluated and – if cost-effective – sustainably funded.
The recently introduced functional clustering can strengthen the quality of specific hospital services for which rapid access is needed. In 2013, a new wave of reforms established standardised pathways for patients who suffer from specific conditions for which a fast response is required, namely stroke and some types of myocardial infarction (with elevated ST). Under the “Integrated Health Care and Functional Cluster Systems”, depending on severity, patients are directed by emergency services either to the regional hospital or one of the six regional stroke treatment centres or five cardiology centres established by the programme. They receive an initial treatment and can be later transferred to a facility closer to their home. For strokes, the programme has essentially allowed the development of intravenous (IV) thrombolysis or thrombectomy in the country, two types of procedures used to treat and remove blood clots from the body.
Although a more complete evaluation is required, results are encouraging. According to data provided by the Ministry, the rates of IV thrombolysis, a quality indicator monitored in stroke care which remain disappointingly low in many high income countries (Scherf et al, 2016), has increased dramatically in Lithuania. In 2012, 160 intravenous thrombolyses were performed and in 2016, 808. For thrombectomies the number rose from 4 to 276. Since the creation of Percutaneous Coronary Intervention Centres (open 24/7) for the cardiology patients, the time of access to the required intervention has dropped and hospital mortality in patients is decreasing2. The Government plans on expanding this clustering system to all people who suffer from a myocardial infarction. These measures, as well as selective contracting based on minimum volume, hold great potential for increasing the quality of inpatient services in Lithuania but it will be critical to demonstrate more rigorously that they lead to improvements in clinical outcomes.
3.2.2. Despite progress, quality of care indicators still place Lithuania among OECD’s poor performers
On the positive side, survey data consistently shows that patients in Lithuania are more satisfied with services than a few years ago. However, results on primary and acute care, as well as across the system, as seen through the prism of cancer, confirm that improving quality in the Lithuanian health system will be the main challenge in the years to come.
The satisfaction of the Lithuanian population in the health system is increasing
A number of European surveys suggest that Lithuanians are more satisfied with their health system than in the past. According to Eurobarometer, the population’s view on the quality of health care improved dramatically between 2009 and 2013. Between these 2 years, the share of Lithuanians rating the overall quality of health care in the country as good increased from 40 to 65%, the largest increase among European Union countries, although this share is still below the EU average (71%) (European Commission, 2014). The European quality of life survey (Eurofound, 2017) also shows increased trust in the health care system. On a scale from 1 (very poor quality) to 10 (very high quality), the average rating of the quality of health services in Lithuania has increased from 5.1 to 6.3 between 2003 and 2016, the fourth highest increase in the European Union (Figure 3.8). Patient satisfaction is an important quality metric and the progress shown is surely encouraging. Yet, as the rest of the section will show, results on outcomes of care are not progressing as fast and lag at the bottom of the distribution.

Source: European quality of life survey 2016 (Eurofound, 2017).
Prevention and treatment at the primary care level must still improve
Immunisation rates could be higher. High rates of children immunisation were one of the hallmarks of soviet systems, which many countries have retained. Results in this regard in Lithuania are a bit disappointing and around or slightly below OECD averages: 93 percent of children are immunised against diphtheria, tetanus and pertussis, 94 percent against measles and 94 percent against Hepatitis B – the only rate at par with the OECD average (2015). Although Influenza vaccination coverage for people above 65 is much higher than in Latvia and Estonia, at 19.5% it remains well below the OECD average (Figure 3.9).
Source: OECD Health Statistics 2017, https://doi.org/10.1787/health-data-en.
PHC in Lithuania is increasingly effective in managing chronic diseases and keeping people out of the hospital. Hospitalisations for ambulatory care sensitive conditions are among the key quality indicators for primary care. Hospitalisations for these conditions have been declining in Lithuania since 2005, although from very high levels. The gains are however unevenly distributed across the country with more modest improvements in rural areas, possibly caused not only by differences in available PHC services but also differences in social conditions and support (Jurevičiūtė and Kalėdienė, 2016).
Lithuanian data submitted to the OECD for the years 2012–2015 confirms that the proportion of patients hospitalised for congestive heart failure, asthma and COPD has been decreasing. For Asthma and COPD, the rates are in fact converging with OECD averages, keeping in mind that this progress is only relative as many countries manage to achieve substantially lower rates of hospitalisations. On the other hand, despite progress, for congestive heart failure, the proportion of patients hospitalised still remains the highest among 32 countries reporting this indicator to the OECD, more than twice the average rate. Hospitalisation rates for diabetes are a third higher than the OECD average and do not seem to decline (Figure 3.10).
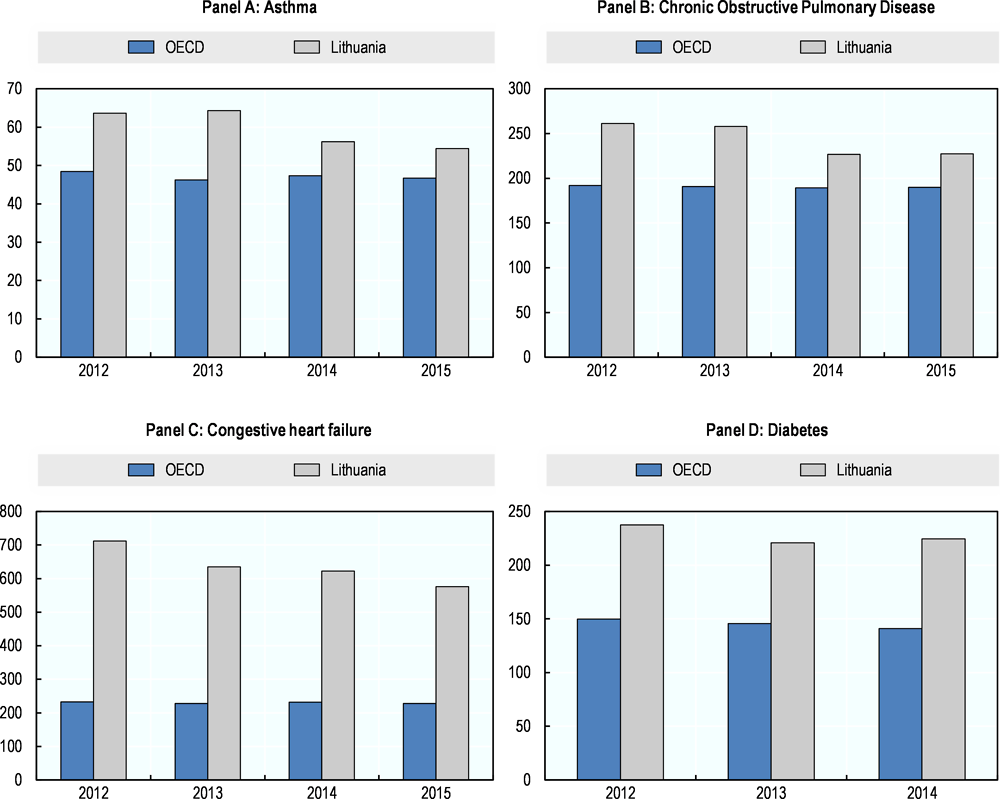
Source: OECD Health Statistics 2017, https://doi.org/10.1787/health-data-en.
Hospital mortality for acute conditions is stubbornly high
The quality of acute health care services also needs to improve. Mortality after hospitalisation for acute conditions is the most common indicator for measuring hospital care quality and is collected by the OECD for international comparison purposes. For the first time, Lithuania provided 30 day mortality data for AMI, haemorrhagic stroke (caused by bleeding) and ischemic stroke (caused by blood clotting) in 2017. In all cases, Lithuania’s figures considerably exceed OECD averages. Figure 3.11 for instance shows that Lithuania has the second highest mortality rates of all OECD countries that are able to link mortality data across health providers for AMI and ischaemic stroke. Although Lithuanian data is only available for four years (2012–2015), results have not improved over this period. It will be all the more important to monitor the impact of on-going clustering of stroke and cardiac services. In addition, Lithuania should expand the number of quality indicators reported to the OECD, particularly on patient safety to better benchmark its performance.
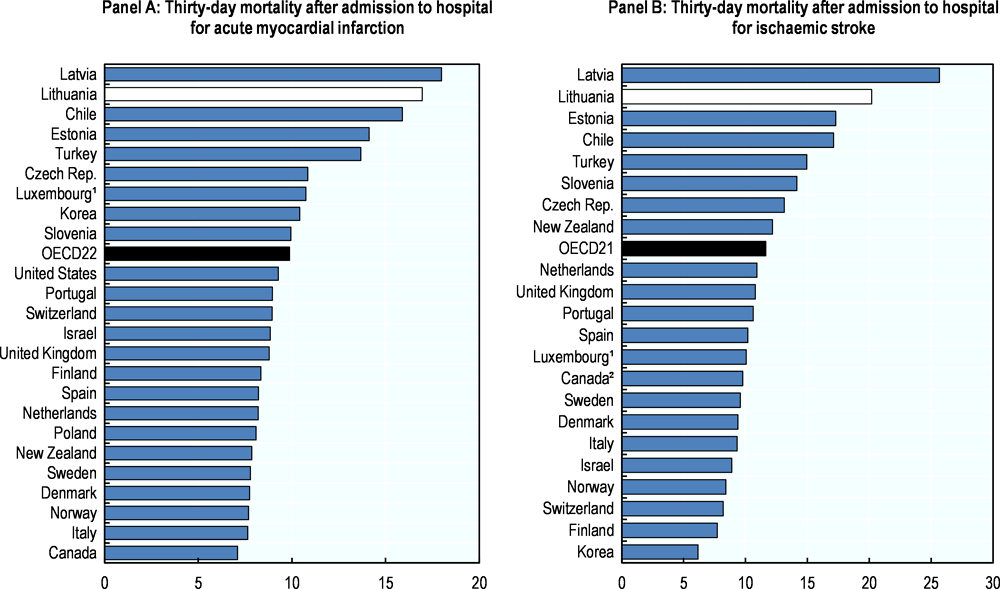
1. Three-year average. 2. Results for Canada do not include deaths outside of acute care hospitals.
Note: Based on patient (linked) data.
Source: OECD Health Statistics 2017, https://doi.org/10.1787/health-data-en.
Cancer care, which relies on both effective PHC and hospital services, is improving although results still lags behind most OECD countries
This section concludes with a disease-oriented perspective on quality by looking at results on cancer care.
Despite progress, PHC providers struggle to ensure better coverage of cancer screening. Lithuania has set up publicly funded population-based screening programmes for common cancers: breast, prostate, colorectal and cervical cancer and coverage of the target population has increased over the last 10 years. In 2015, 45% of targeted women had been screened for breast cancer compared to only 12% in 2006, a significant improvement from very low levels. For cervical cancer, the national screening programme started in 2004 and coverage has increased more slowly, from 43% in 2010 to 48% in 2015. However, these screening rates still lag behind most OECD countries and in both cases, the numbers put Lithuania among OECD’s poorest performers (Figure 3.12). According to NHIF data, in 2016, 46% of targeted men were screened for prostate cancer. Colorectal cancer screening, first piloted in 2009 and nation-wide since 2014, is now reaching 43% of the target population.

1. Programme data 2. Survey data * Three-year average
Source: OECD Health Statistics 2017, https://doi.org/10.1787/health-data-en.
Primary care is given a large responsibility in the management of the screening programmes but national governance can be tightened to increase coverage and secure equity. Primary care providers have the responsibility to inform patients about the screening programmes and refer eligible patients. They are also incentivised to reach a high uptake through the primary care reimbursement system. All four screening programmes are included in the primary care quality indicators list with a graded payment scale depending on the number of screened people as share of eligible people listed with the clinic. Unlike most other countries with population based programmes, invitations to eligible target groups are not sent through central screening registries, but from the individual primary care centres. Consequently, invitations and follow up for positives are not systematically managed the same way across the country, and take up is to a large extent dependent on the primary care clinic. This also means it is potentially more difficult to automatically link screening data to cancer and other health registries and there is still no screening registry in the country (European Commission, 2017). The National Cancer Prevention and Control Programme (2014–25) is aiming for both improved quality of screening tests and development of the national cancer register, including data linkages to providers and diagnose facilities, among other results. To reach acceptable coverage and equity across the country in this decentralised screening system, more national level steering in addition to the current incentives is probably needed.
Overall, the effectiveness of cancer care quality has improved considerably but still lags behind most OECD countries. Five-year survival rates after cancer diagnosis for most forms of cancer have increased substantially over the past decade and faster than in many other countries, but remain among the lowest in the OECD. Breast cancer survival has increased from 65 to 74% between 2000-04 to 2010-14, but it remains behind those of neighbouring Baltic countries Latvia and Estonia. Similarly colorectal cancer treatment is increasingly successful and at par with neighbouring countries. Colon cancer survival has increased from 45 to 57% in the same time period (CONCORD programme, LSHTM, 2018). For prostate cancer, survival has doubled between the late 1990s and the late 2000s. However, much of the increase in cancer survival is driven by earlier detection, which increases survival also without decreasing mortality (Krilaviciute et al., 2014). All in all thus, from diagnostic to treatment, progress is still needed.
Conclusion
Even accounting for the fact that Lithuania spends relatively little on health, international comparisons suggest that Lithuania should be able to reach better health outcomes. This chapter analyses the policies which aim at improving on the one hand the efficiency of the health system and on the other the effectiveness and quality of the services provided.
Progress in restructuring the hospital sector has been slower than in other countries and many facilities still perform very few surgeries and deliveries, which is inefficient but also detrimental to quality and carries a risk for patients. The ongoing initiatives to cluster services in fewer hospitals, and develop a small number of specialised hospitals for some conditions, are promising but need to be extended, sustained over a long time frame and their actual impact evaluated.
PHC is well organised and reflects best OECD practices with an accessible network of providers and an increasingly team-based approach to care including multiple professions and an extended role for nurses. Several indicators suggest that PHC has a positive impact on wider system efficiency, as shown by the decreasing proportion of patients hospitalised for chronic conditions, such as asthma and congestive heart failure. However, the coverage of preventive services, in particular cancer screening, is still disappointing. Coordination with public health and mental health services has been on the agenda for some time but results are still modest. Actual initiatives to organise coordination tend to be small-scale, seldom evaluated and short-lived. Curbing unhealthy behaviours, such as harmful drinking and smoking, particularly among men, is essential to closing the gap with high performing OECD countries.
The focus on quality needs to be strengthened. A number of initiatives to improve public bench-marking and patient information are implemented in Lithuania but information is not effectively disseminated. The quality assurance culture remains underdeveloped and the policies to change this have not yet been effective. Measuring results and holding stakeholders more explicitly accountable for results can contribute to strengthening clinical outcomes.
References
Bunevicius, R. et al. (2014), “Factors affecting the presence of depression, anxiety disorders, and suicidal ideation in patients attending primary health care service in Lithuania”, Scandinavian Journal of Primary Health Care, Vol. 32, Issue 1.
ECDC (2017), Antimicrobial Resistance Surveillance in Europe 2015, Annual Report of the European Antimicrobial Resistance Surveillance Network (EARS-Net).
Eurofound (2017), European Quality of Life Survey 2016: Quality of life, quality of public services, and quality of society, Publications Office of the European Union, Luxembourg.
Eurostat (2017), Statistics Explained, Comparative price levels for food, beverages and tobacco, http://ec.europa.eu/eurostat/statistics-explained/index.php/Comparative_price_levels_for_food,_beverages_and_tobacco.
European Commission (2013), “European profile of prevention and promotion of mental health (EuroPoPP-MH)”.
European Commission (2014), “Special Eurobarometer 411. Patient Safety and Quality of Care”, June 2014.
European Commission (2017), “Cancer Screening in the European Union. Report on the implementation of the Council Recommendation on cancer screening”.
EXPH – Expert panel on effective ways of investing in health (2017), Opinion on Tools and Methodologies for Assessing the Performance of Primary Care.
Jurevičiūtė S and Kalėdienė R (2016), “Regional inequalities of avoidable hospitalisation in Lithuania”, Health Policy and Management, Vol 1, Issue 9.
Jaruseviciene, L. et al. (2014), “Preparedness of Lithuanian general practitioners to provide mental healthcare services: a cross-sectional survey”, International Journal of Mental Health Systems. Vol 8, Issue 1, No. 11.
Kalediene, R. et al. (2011), “Public health bureaus: new players in health improvement in Lithuania”, Acta Medica Lituanica, Vol 18, pp183-189.
Krilaviciute, A. et al. (2014), “Cancer survival in Lithuania after the restoration of independence: rapid improvements, but persisting major gaps”, Acta Oncologica; Vol 53, No 9, pp. 1238-44.
McColl, A. et al. (1998), “Performance indicators for primary care groups: an evidence based approach”, BMJ; Vol 317.
Murauskiene, L. (forthcoming), Moving towards universal health coverage: new evidence on financial protection in Lithuania, WHO Regional Office for Europe, Copenhagen.
Murauskiene, L. et al. (2013), Lithuania: health system review. Health Systems in Transition, Vol. 15, pp. 1-150.
Medeiros, J and C. Schwierz (2015), Efficiency estimates of health care systems, Economic Papers 549. DOI: 10.2765/49924
National Audit Office (2017), Suicide prevention and aid to individuals related to the risk of suicide, Executive summary of the public audit report (NO. VA-P-10-5-2).
Parliament of the Republic of Lithuania (2016) Decision on the Republic of Lithuania Government’s Programme (13/12/2016, No. XIII-82), section 2, Article 31.4, https://www.e-tar.lt/portal/lt/legalAct/ed6be240c12511e6bcd2d69186780352.
Peceliuniene, J. (2011), “Mood, anxiety disorders and suicidal ideation in primary care patients”, Doctoral Dissertation, Biomedical Sciences, Medicine. Kaunas, Lithuanian University of Health Sciences.
Rabinovich, L. et al. (2009) The affordability of alcoholic beverages in the European Union. Understanding the link between alcohol affordability, consumption and harms, RAND Europe.
Sassi, F. (ed.) (2015), Tackling Harmful Alcohol Use: Economics and Public Health Policy, OECD Publishing, Paris, https://doi.org/10.1787/9789264181069-en.
Scherf, S. et al. (2016), “Increase in national intravenous thrombolysis rates for ischaemic stroke between 2005 and 2012: is bigger better?”, BMC Neurology, Vol 616, No. 53, https://doi.org/10.1186/s12883-016-0574-7
SHCAA (2018) The State Health Care Accreditation Agency, http://www.vaspvt.gov.lt/node/941 and /882.