Chapter 1. Macroeconomic and political context: From independence to post-crisis recovery
This chapter describes the main governance reforms of Slovenia since its independence in 1991 up until it joined the EU in 2004. It also describes the current economic context of regulatory reform efforts and points to the specific economic challenges that the country faces that hinder investment, economic growth, and well-being. The overall well-being of Slovenian citizens and their perception of government effectiveness are also briefly discussed.
Political context: Slovenia’s path from independence to EU membership
Slovenia declared independence from Yugoslavia and became a democratic republic on 25 June 1991, just over a year after the first free election in the country. Prior to independence, structural economic reforms had already begun in part because of the economic crisis caused in part by hyperinflation of the in Yugoslavia in 1989.
Slovenia adopted a new constitution only a few months later on 23 December 199. The new constitution reformed Slovenia’s parliament. It eliminated one legislature and laid out the foundations of the state authority, the position of individuals in the new government as well as the rights of citizens. The Slovenian Constitution stipulates that laws may be proposed by the government, by any deputy or by a group of at least 5 000 voters.1
Slovenia rapidly joined the international community as a newly independent country. Less than a year after independence, Slovenia became a member of the United Nations and shortly thereafter in 1993 Slovenia joined the World Bank and the International Monetary Fund.
With the loss of its key export markets in Yugoslavia, Slovenia looked to strengthen ties as quickly as possible with the rest of Europe to take advantage of the key political and economic benefits of integration. Slovenia began the process to join the EU in 1993 when the Copenhagen European Council outlined the requirements for Central and Eastern European (CEE) countries to join the EU. From 1994 to 2004, government reforms were primarily concerned with the EU accession process. The main strategic document for economic reform during this period was the Strategy for Economic Development of Slovenia, whose key objective was to accelerate growth to close the gap with the EU; to improve competition; to allow EU integration; and to focus on sustainable economic growth. According to Potoconik, EU accession would be considered “ultimate proof that the [economic and political] transition had succeeded.” In 1997, the Commission gave an opinion on Slovenia’s adherence to the Copenhagen criteria. According to the Commission, Slovenia could be considered a stable democracy, but it had considerable work to adopt and implement the acquis communautaire.
Formal negotiations between the EU and Slovenia began in 1998. However, Slovenia was well prepared as a result of its three key strategic documents:
-
Strategy of International Economic Relations (1996)
-
Strategy for Increasing Competitiveness Capabilities of Slovenian Industry (1997)
-
and finally in 1998 the Strategy of Slovenia for Accession to the European Union.
The main objective of the final document was to outline the medium-term strategies and policies required for a full economic transition and to join the EU (Potoconik). Negotiations with the EU on the acquis communautaire began in April 1998 and concluded in December 2002. On 1 May 2004 Slovenia joined the European Union as part of the biggest enlargement to date of the EU.2
Government structure
After independence Slovenia emerged as a unitary country with an asymmetric bicameral legislature. The legislature is divided in to two parts: the National Assembly and the National Council. The National Assembly is made up of 88 representatives elected by proportional representation and 2 minority representatives: one representing the Italian minority and one representing the Hungarian minority. The National Council has 40 representatives, who are chosen from different parts of Slovenian society, including:
-
four representatives of employers
-
four representatives of employees
-
four representatives of farmers, crafts and trades, and independent professions
-
six representatives of non-commercial fields and
-
twenty-two representatives of local interests.
National Council representatives are selected every five years. Although there are two legislatures, most of the political power lies within the National Assembly and the National Council plays an exclusively advisory role with limited powers, which is why many scholars refer to Slovenia as an asymmetric or incomplete bicameral legislature (see for example Borak).
The president is elected every five years and may serve a maximum of two terms. Among other duties, he or she has the power to perform functions related to the operation of the government such as:
-
calling election to the National Assembly;
-
proposing a candidate for the President of the National Assembly;
-
dissolving the national assembly and call new elections in certain cases;
-
accrediting and recall Slovenian ambassadors;
-
and appointing state officials in certain cases;
Currently, the Slovenian government consists of 14 ministries, 12 government offices, and 33 bodies of the ministries, which includes, for example, compliance and enforcement agencies. The prime minister and ministers operate fully independently within their own areas of concern and are held accountable only by the National Assembly.
The Government of Slovenia is both an executive body and the supreme body of the administration. The Government can propose state legislation, the state budget, national programmes and other functions within its jurisdiction. The government also represents Slovenia in EU affairs.
Local government structure
At the local level, Slovenia is divided into 212 municipalities with 11 urban municipalities. Generally, mayors and local councillors are decided by popular vote held every 4 years. The Local Self-government Act stipulates that a municipality must have at least 5 000 people and an urban municipality must have at least 20 000 inhabitants.
A municipality comprises of a mayor, a council, and a supervisory committee. The mayor represents and acts on behalf of the municipality and also must be directly elected every four years. The municipal council is the highest decision-making body of a municipality.
Economic context
Even before independence, Slovenia’s economy was significantly wealthier compared to other parts of Yugoslavia. In 1990, Slovenia GDP per capita was USD 6 100 compared to an average of just USD 3 060 in the whole of Yugoslavia (Pleskovic and Sachs).
According to Pleskovic and Sachs, Slovenia also underwent the greatest reform after the dissolution of Yugoslavia and made the fastest transition to a market economy. In just two years from 1991 to 1993, Slovenia “achieved political independence, stabilised its economy, introduced its own currency, and carried out fundamental economic reforms.” Already in 1993, Slovenia was a richer, more open economy than other countries from the former Yugoslavia.
However, with independence came the loss of Slovenia’s important Yugoslavian markets, so the country immediately had to deal with a severe economic crisis. The government spent the early years of Slovenian independence managing the crisis and introducing much needed market reforms.
The major reforms towards a market economy combined with the relatively strong starting position eventually made Slovenia an economic leader in the region. As reforms took hold and Slovenia began to integrate into the broader European economy, it became one of the fastest growing countries in transition. GDP per capita rose from USD 15 062 (USD 2010) to USD 21 218 from 1995 to when Slovenia joined the EU in 2004. Despite starting at a higher income level, Slovenia grew as rapidly as many CEE countries such as Poland, Hungary and Slovakia, although similar reforms were beginning in those countries (see Figure 1.1).
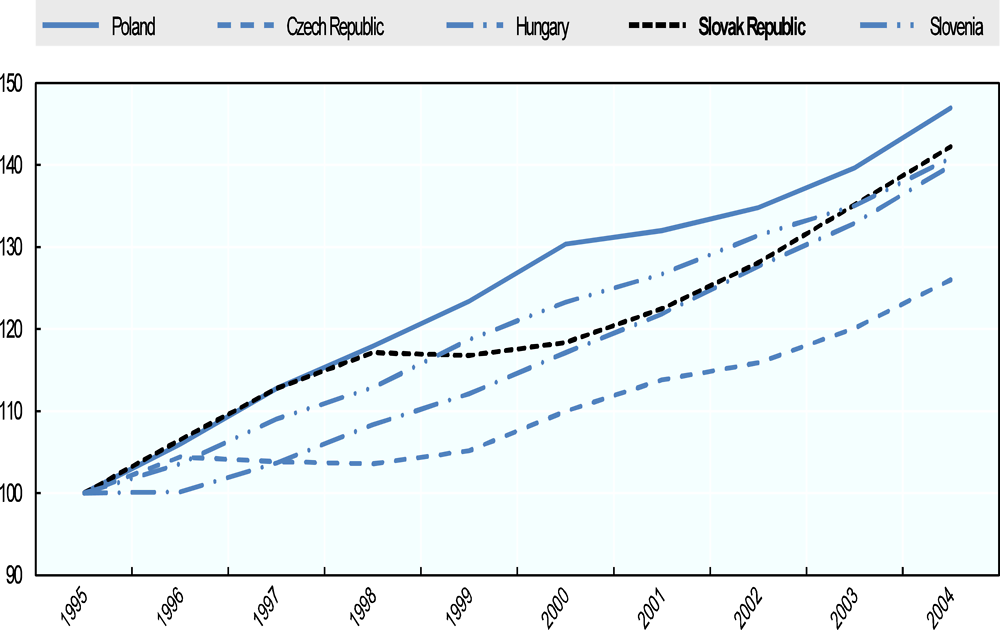
Source: World Bank national accounts data, and OECD National Accounts data files.
Pleskovic and Sachs noted, however, that many challenges remained after independence. Inefficient banks and increasing losses and debt of state-owned enterprises remained risks to the nascent market economy.
Current economic situation: A recovering economy after a recession and austerity
Unless otherwise noted, the following section is largely drawn from the Economic survey of Slovenia, officially launched in Ljubljana on 5 September 2017.
After many years of exceptional growth, the global financial crisis hit Slovenia particularly hard. For 15 years in a row, Slovenia’s economy grew every quarter, but in 2009 the Slovenian economy shrank for the first time. The economic crisis shed a harsh light on Slovenia’s need for further economic reforms despite its record of success since independence. Real GDP dropped markedly during the crisis, falling nearly 8% in 2009 alone.3
After suffering a double dip recession in 2012, Slovenia’s economy gradually began to turn around in 2013. The recovery was initially export-driven, but slowly domestic demand began to catch up as well. Unemployment remains much higher than pre-crisis level even 9 years later.
Previously, GDP per capita was converging to the OECD average. However, during the crisis, this process went into reverse and has only recently changed. GDP has only just reached its pre-crisis peak and Slovenia’s growth has underperformed its peers since 2009. Weak business investment and labour shortages in manufacturing continue to be a drag on economic growth in Slovenia.

Notes: Percentage gap with respect to the weighted average using population weights of the highest 17 OECD countries in terms of GDP per capita, GDP per hour worked and GDI per capita (in constant 2010 PPPs).
Source: OECD (2017), OECD Economic Surveys: Slovenia 2017, OECD Publishing, Paris, https://doi.org/10.1787/eco_surveys-svn-2017-en.
Raising living standards by investing in capital and skills
Investment in Slovenia has been markedly lower than expected since the crisis in 2009. Boosting domestic growth will require higher domestic and foreign investment to encourage gains in labour productivity and to continue integration into global value chains.
Slovenia’s FDI has fallen to one of the lowest in the region, resulting in slower adoption of advanced, productivity-enhancing technologies as well as improved management practices.
Slovenia also performs relatively poorly in logistics infrastructure. Its reliance on EU Structural funds for infrastructure investments has limited the social returns on such investments because project financing plays a more important role than social returns to investment.
Despite the slow recovery, the short-term economic future looks positive for Slovenia. Stronger domestic consumption supported in part by rising employment and stronger consumer confidence is also being bolstered by supportive euro area monetary policy. Even the fiscal position of Slovenia has started to improve. However, significant medium and long-term risks remain to the budgetary balance.
Fiscal situation: Dealing with age-related spending
The Slovenian government implemented economic austerity measures until 2014 and then slowly began to loosen them by relaxing wage and promotion freezes in the government, although the government undertook no new major spending initiatives.
The deficit reached 15% of GDP in 2013 but has now eased to a more modest 1.6%, although this is still higher than the cyclically-adjusted 1% of GDP required under the Maastricht Treaty.
With stronger economic growth, the fiscal position of Slovenia is expected to steady in the near term. However, Slovenia’s fiscal situation faces significant long-term risk due to age-related spending. Age-related spending – particularly pensions and health care – could drive Slovenia’s age-related spending to over 30% of GDP compared to just over 20% in Slovenia’s OECD peer countries.
Easing regulation and boosting competition
Slovenia remains a highly regulated economy and Slovenian businesses still face high administrative burdens. Slovenia ranks as the 6th most restrictive economy of OECD countries based on the OECD’s product market regulation indicator and it also scores higher than most other CEE countries.
Additionally, Slovenia has a high number of regulated professions – over 200 – and they often have high barriers to entry, such as high education or apprenticeship requirements. The poorly regulated professions result in below average labour productivity for services in Slovenia.
New market entry encourages established businesses to invest in the face of potential competition. However, foreign firms in Slovenia may only press charges through courts rather than a competition body. In addition, Slovenia lacks a comprehensive inward FDI strategy.
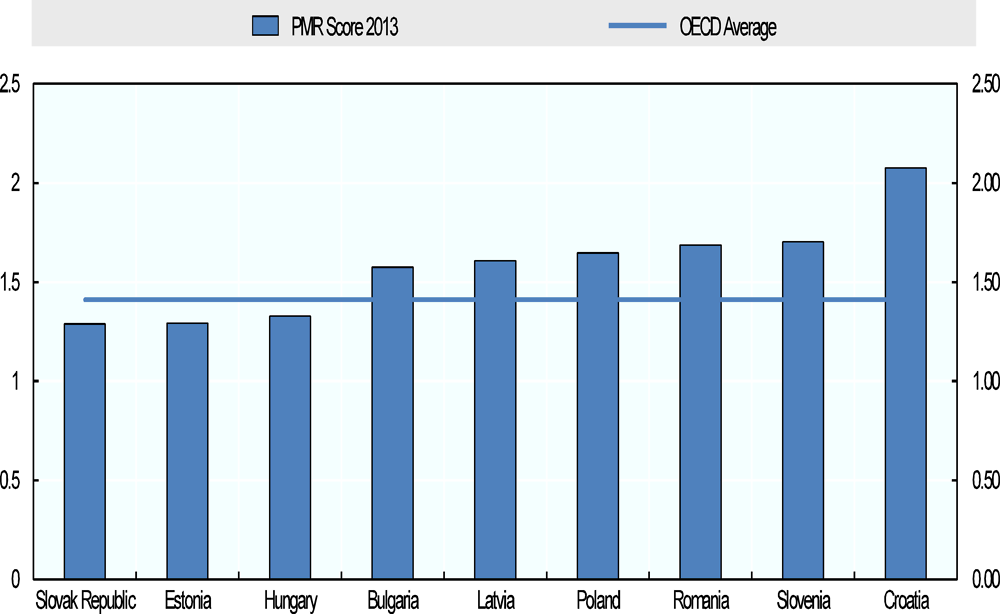
Note: Scores are from 0 to 6 (least restrictive to most restrictive).
Source: Koske, I. et al. (2015), “The 2013 update of the OECD product market regulation indicators: policy insights for OECD and non-OECD countries”, OECD Economics Department Working Papers, No. 1200, OECD Publishing, Paris.
Public ownership is pervasive in Slovenia. The government owns or controls 650 enterprises that effectively control nearly a third of Slovenia’s GDP. These SOEs have generally lower productivity than their privately-run EU counterparts, particularly in the network sector that is dominated by SOEs.
Slovenia has been addressing this challenge through the introduction of the SME test (described in Chapter 5), consolidating regulatory reforms in the Single document to target particular regulatory irritants, and through certain sectoral reforms, such as simplifying regulations for spatial planning and construction permits.
The well-being of Slovenia’s citizens
According to the OECD’s Better Life Index, Slovenians enjoy a higher standard of living compared to the OECD average across a wide variety of measures, including safety and environment. Health and gender equality are also superior to many OECD countries.
However, civic engagement is relatively poor in Slovenia. Voter turnout was only 51.7% in the last election, 36th out of 38 countries in the Better Life Index. Social inequality is also still a relatively big concern. Slovenia ranked 26th out of 38 countries in social inequality.
Slovenia is also one of the first OECD countries to transfer the 17 UN Sustainable Development Goals into a national strategy based on 169 indicators. In late 2016, the government developed the Vision for Slovenia. The strategy focuses on 4 key areas of the SDGs:
-
Learning for and through life
-
An inclusive, resilient and responsible society
-
An economy that creates value for everyone
-
A high degree of co-operation, competence, and effectiveness.
Satisfaction with government
Slovenians are relatively sceptical of their national government and judicial system. Only 25% of Slovenian citizens expressed confidence or satisfaction in their national government – one of the lowest in the OECD. Similarly, faith in the judiciary stood at only 28% in 2016, compared to an average of 54% across OECD members. Levels of disclosure of private interests across branches of government stand at a low level and fall well below the OECD average across all three branches, except the judicial branch.
Given that Slovenia perform well on a number of education and health outcomes, it is not surprising then that citizens have a favourable impression of their education and health systems. Slovenians attend school longer than most in the OECD – 18.3 years compared to an OECD average of 17.5 years. Furthermore, 86% of Slovenians have completed upper secondary education. Life expectancy and the percentage of people reporting to be in good health in Slovenia lies near the OECD average (OECD, 2017c).
Bibliography
Borak, N. and B. Borak (2004), “Institutional Setting for the New Independent State” in Slovenia: From Yugoslavia to the European Union, M. Mrak et al. (eds.).
OECD (2017a), OECD Economic Surveys: Slovenia 2017, OECD Publishing Paris, https://doi.org/10.1787/eco_surveys-sun-2017-en.
OECD (2017b), “Slovenia Better Life Index Results”, OECD, www.oecdbetterlifeindex.org/countries/slovenia/.
OECD (2017c), “Slovenia Country Fact Sheet: Government at a Glance 2017”, OECD.
Pleskovic, B. and J.D. Sachs (1994), “Political independence and economic reform in Slovenia” in The Transition in Eastern Europe, Vol. 1, pp. 191-220, University of Chicago Press.
Potocnik, J. and J.G. Lombardero (2004), “Slovenia’s Road to Membership in the European Union” in M. Mrak et al. (eds.), Slovenia: From Yugoslavia to the European Union.
Notes
← 1. Article 88, Official Gazette of the Republic of Slovenia Nos. 33/91-I, 42/97, 66/2000, 24/03, 69/04, 68/06, and 47/13.
← 2. On 1 May 2004, Cyprus, the Czech Republic, Estonia, Hungary, Latvia, Lithuania, Malta, Poland and Slovakia also became EU member countries.
Note by Turkey: The information in this document with reference to “Cyprus” relates to the southern part of the Island. There is no single authority representing both Turkish and Greek Cypriot people on the Island. Turkey recognises the Turkish Republic of Northern Cyprus (TRNC). Until a lasting and equitable solution is found within the context of the United Nations, Turkey shall preserve its position concerning the “Cyprus issue”.
Note by all the European Union Member States of the OECD and the European Union: The Republic of Cyprus is recognised by all members of the United Nations with the exception of Turkey. The information in this document relates to the area under the effective control of the Government of the Republic of Cyprus.
← 3. Measured in USD, 2011 prices, and purchasing power adjusted.