Chapter 2. The immigration landscape: Patterns, drivers and policies
This chapter provides an overview of the migration landscape in the ten partner countries of the project Assessing the Economic Contribution of Labour Migration in Developing Countries as Countries of Destination. It first presents the main migration patterns in each country, in particular by comparing the stocks and flows of both immigrants and emigrants and by showing some of the characteristics of labour migrants – the main focus of this report. The chapter then analyses the drivers of immigration, not only through an economic lens, but also by studying social, political and institutional factors. Finally, it lays out the policy and institutional environment in which immigration evolves. Overall, the chapter provides the basis for the analysis in the following chapters of the report, as patterns, drivers and policy environments influence the way labour immigrants contribute to the economies of their destination countries.
The global stock of international migrants increased by 60% between 1990 (153 million migrants) and 2015 (244 million). Yet, their share of the world population has remained relatively stable since then, at around 3%. While most international immigrants live in high-income countries, developing countries (i.e. low- and middle-income countries) hosted about 35% of the global stock in 2015 (United Nations, 2015).1
Most immigrants in developing countries come from other developing countries, and those movements have been declining. While 45% of immigrants from developing countries lived in another developing country in 1990, the share dropped to 31% in 2013.2 The significant increase in gross domestic product (GDP) per capita in most developing countries over the last two decades has contributed to making migration towards more distant and wealthier economies more affordable for would-be migrants from these countries. Beyond the income differential, significant gaps between high-income and developing countries in a range of well-being dimensions have encouraged migration. These include education, health, security and governance (OECD, 2016).
Even though migrants from low- and middle-income countries have increasingly moved to high-income economies, some developing countries have attracted workers hoping to benefit from better economic opportunities. Among the top 15 countries of destination in 2015 were India (5.2 million immigrants), Ukraine (4.8 million), Thailand (3.9 million) and Pakistan (3.6 million) (United Nations, 2015). Immigrants, including refugees, represented a significant share of the population in a number of developing countries in 2015, in particular Jordan (41%), Lebanon (34%), Kazakhstan (20%) and Gabon (16%). Like in high-income economies, most immigrants in developing countries are working age. In 2015, about 71% of all immigrants living in developing countries (versus 78% in high-income countries) were between the ages of 15 and 64. This additional labour force can potentially contribute to the economies of its host countries.
Against this backdrop, ten diverse countries were selected in the framework of the Assessing the Economic Contribution of Labour Migration in Developing Countries as Countries of Destination project: Argentina, Costa Rica, Côte d’Ivoire, the Dominican Republic, Ghana, Kyrgyzstan, Nepal, Rwanda, South Africa and Thailand. Their diversity is not restricted to geographic location, history or culture, but also encompasses migration patterns, the socioeconomic context and the institutional environment. This report therefore provides a good basis to compare the impacts of labour immigration in developing countries.
A comparative analysis of the economic impact of labour immigration in developing countries requires a comprehensive view of the socioeconomic characteristics of immigrants in each country as well as of the reasons why they have chosen a specific country. The economic and policy environment can also play an important role in the way immigrants contribute to the economies of their host countries. In this respect, both migration and sectoral policies can shape immigration patterns and drivers as well as the potential effects of labour migration on economic development (OECD, 2017a). The jobs immigrants take or the benefits and rights they are allowed to enjoy depend on a wide set of policies and institutions.
Migration patterns in the ten partner countries
The characteristics and history of immigration vary widely across the project’s partner countries. While some − namely, Argentina, Côte d’Ivoire, the Dominican Republic, Ghana, Nepal, South Africa and Thailand − have long histories of immigration and recruitment from abroad, Costa Rica, Kyrgyzstan and Rwanda have only recently experienced significant immigration. Like most developing countries, the partner countries typically receive immigrants from their neighbours. In 2015, six were net immigration countries, as more people entered than left. Among them, Argentina, Côte d’Ivoire, South Africa and Thailand had immigrant populations in the millions, while they totalled a little under 450 000 in Costa Rica and Rwanda respectively. Immigrants in all partner countries have higher shares of working-age individuals and lower age-dependency ratios than the native-born population.
Immigrants in partner countries make up 16% of all immigrants in low- and middle-income countries
The ten partner countries represented about 6% of the international migrant stock and 16% of all immigrants in low- and middle-income countries in 2015, a significant increase from 9.7% in 1990 (United Nations, 2015). By region, they represented 38% of all immigrants among low- and middle-income countries in Latin America and the Caribbean, 15% in Africa and 12% in Asia in 2015 (Figure 2.1).

Source: Authors’ own work based on United Nations (2015), Trends in International Migrant Stock: The 2015 Revision, http://www.un.org/en/development/desa/population/migration/data/estimates2/estimates15.shtml.
Certain partner countries have immigrant populations in the millions or have high shares of immigrants in the total population (see a detailed definition of immigrants in Chapter 1). Thailand (with 3.9 million immigrants) and South Africa (3.1 million) had the largest total number of immigrants among the ten countries in 2015, followed by Côte d’Ivoire (2.2 million) and Argentina (2.1 million) (Figure 2.2). Côte d’Ivoire and Costa Rica reported the highest shares of immigrants of the total population at 9.6% and 8.8% respectively, followed by Thailand and South Africa (both 5.8%) in 2015.
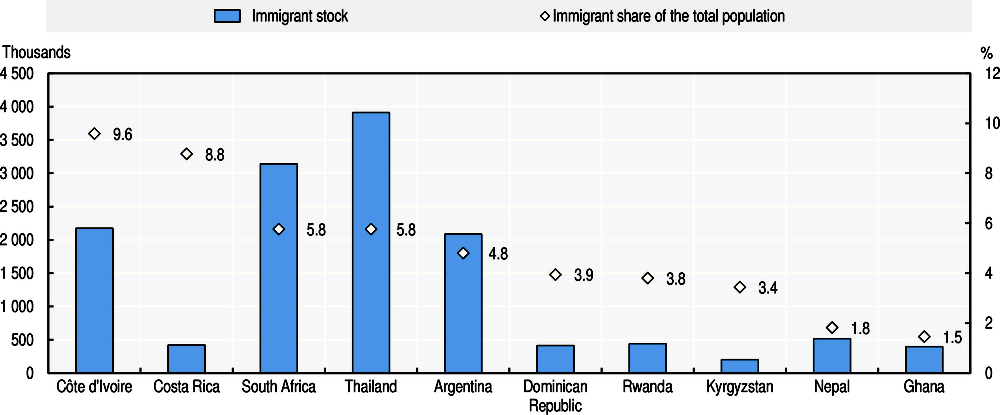
Note: Most estimations are based on the foreign-born populations. Costa Rica, Nepal, Rwanda, South Africa and Thailand also include the number of refugees. The estimation for Côte d’Ivoire is based on the number of foreign citizens that are foreign-born.
Source: United Nations (2015), Trends in International Migrant Stock: The 2015 Revision, http://www.un.org/en/development/desa/population/migration/data/estimates2/estimates15.shtml.
Eight of the ten partner countries saw the volume of immigrant stocks increase between 1995 and 2015. The exceptions are Kyrgyzstan and Nepal (Figure 2.3). On average, the stock of immigrants in partner countries grew 1.7 times. Thailand has seen the greatest growth (4.8 times) of the ten countries. While Thailand had the fourth largest stock of the ten countries in 1995, it grew to the largest in 2015. Thailand’s remarkable economic growth in the 1990s attracted many immigrants, especially from Cambodia, the Lao People’s Democratic Republic and Myanmar. Rwanda had the smallest stock in 1995, growing to the sixth largest stock of the ten countries in 2015, while Kyrgyzstan’s stock shrank from the sixth largest stock to the smallest.
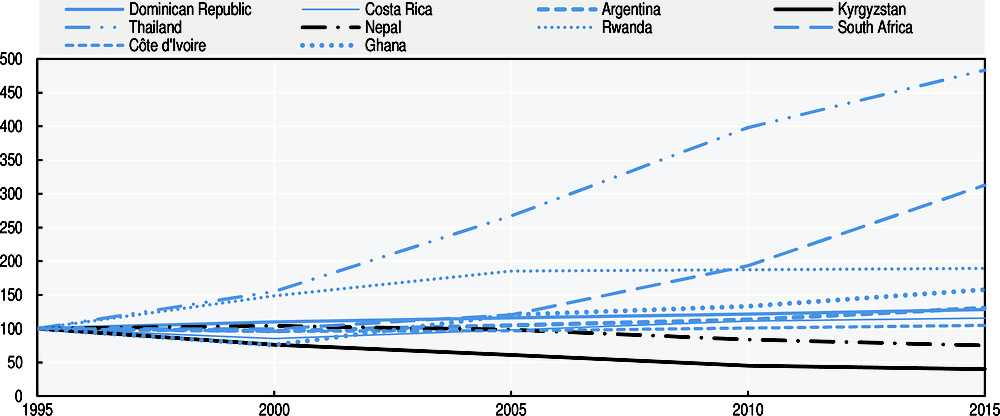
Note: Most estimations are based on the foreign-born populations. Costa Rica, Nepal, Rwanda, South Africa and Thailand also include the number of refugees. The estimation for Côte d’Ivoire is based on the number of foreign citizens that are foreign-born.
Source: Authors’ own work based on United Nations (2015), Trends in International Migrant Stock: The 2015 Revision, http://www.un.org/en/development/desa/population/migration/data/estimates2/estimates15.shtml.
In contrast to Argentina, South Africa and Thailand, the other seven partner countries experienced a decrease in their shares of immigrant in the total population between 1995 and 2015 (Figure 2.4). The share decreased from 14.4% to 9.6% in Côte d’Ivoire and from 11.1% to 3.4% in Kyrgyzstan, whereas it increased from 1.4% to 5.8% in Thailand and 2.4% to 5.8% in South Africa.
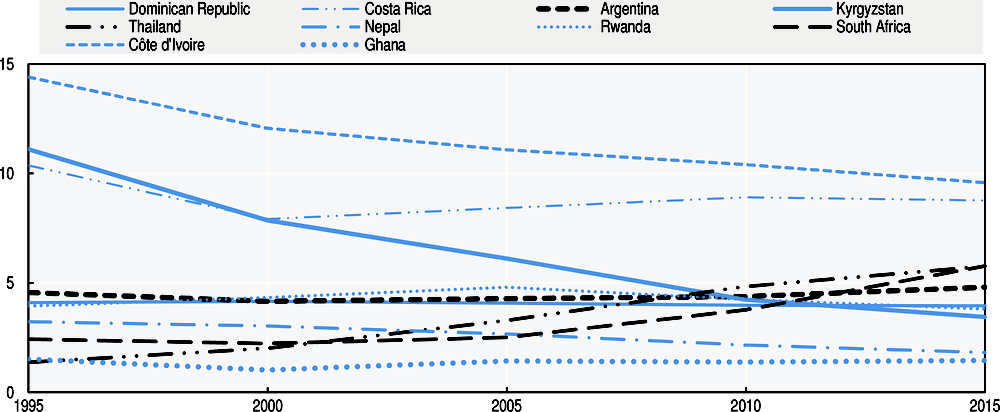
Note: Most estimations are based on the foreign-born populations. Costa Rica, Nepal, Rwanda, South Africa and Thailand also include the number of refugees. The estimation for Côte d’Ivoire is based on the number of foreign citizens that are foreign-born. Countries with increased shares of immigration are represented by a black line.
Source: Authors’ own work based on United Nations (2015), Trends in International Migrant Stock: The 2015 Revision, http://www.un.org/en/development/desa/population/migration/data/estimates2/estimates15.shtml.
Six of the partners were net immigration countries in 2015, two less than in 2013
The levels of immigration and emigration change over time for various reasons. In 2015, Argentina, Costa Rica, Côte d’Ivoire, Rwanda, South Africa and Thailand had more immigrants than emigrants. Conversely, the Dominican Republic, Ghana, Kyrgyzstan and Nepal were net emigration countries (Figure 2.5).

Source: Authors’ own work based on United Nations (2015), Trends in International Migrant Stock: The 2015 Revision, http://www.un.org/en/development/desa/population/migration/data/estimates2/estimates15.shtml.
Argentina saw a slight increase in its immigrant share since it adopted an open immigration policy in 2003. In Costa Rica, political instability in neighbouring countries attracted many immigrants. From the colonial period until recently, Côte d’Ivoire experienced major immigration, with the exception of a relatively restrictive immigration policy in the early 1990s. The number of immigrants to Rwanda has also increased considerably since the 1990s, with incoming refugees and returned exiles.3 Rwanda’s 2009 immigration policy helps attract high-skilled immigrants as it emphasises skills import as a part of its long-term development strategy. Immigration in South Africa has been characterised by circular migration to some sectors and permanent immigration flows from Europe for political reasons and to address skill shortages. Thailand had become a net immigration country by the early 1990s, mainly due to rapid economic growth.
Ghana and Nepal were net immigration countries in 2013 but became net emigration countries in 2015 (World Bank, 2016a). Ghana, after a period of increasing immigrant flows during the 1960s, experienced political and economic downturns that encouraged Ghanaian workers to migrate to neighbouring countries. Since then, the 1992 Constitution has allowed the country to regain its political stability and has contributed to increased flows of immigrants. Recently, the 2016 National Migration Policy reflected the generally positive attitude towards immigration. Nevertheless, immigration in Ghana is still limited compared to other partner countries. As for Nepal, slow economic growth for the past 25 years has increased emigration, while immigration, mainly from India, has remained steady.
Dominican emigrants, 72% moved to the United States in 2013 (World Bank, 2016a). Kyrgyzstan has experienced significant emigration since independence in 1991, largely due to the drastic socio-economic transformation of the 1990s and better economic opportunities in nearby countries.
Between 1995 and 2015, emigration increased in both absolute and relative terms in all partner countries, except Rwanda. The particular situation of Rwanda can be explained by the massive shifts in population that took place in 1994 during the genocide. Nepal saw the largest increase in volume from 0.9 million to 1.6 million (from 4% to 5.7% as a population share), followed by the Dominican Republic from 0.7 million to 1.3 million (from 8.3% to 12.4%) and Argentina from 0.5 million to 0.9 million (1.4% to 2.2%), largely as a result of economic collapse in 2001-02. Immigration is closely linked with emigration as it counteracts the labour and skills loss that emigration causes (OECD, 2017a; OECD, 2014a; Lowell and Findlay, 2001).
Irregular immigrant numbers are sizable, yet difficult to measure
The legal status of immigrants strongly influences the impact they have on their destination countries. However, there is no easy way to measure the number of irregular immigrants, let alone monitor their status. In any country, an immigrant without the proper paperwork is liable for deportation and fines. However, legal channels that restrict immigration at a time of labour market demand for immigrant workers tend to increase the number of irregular immigrants despite the threat of deportation. For example, the lack of any legal route into the labour market for low-skilled immigrant workers in South Africa, outside of corporate permits, contributed to an increase of irregular immigrant workers (Department of Home Affairs of South Africa, 2016).
The estimations on irregular immigrants vary across partner countries. In most cases, only indirect estimations such as the number of regularised immigrants or deported foreign nationals are available. For example, a 2014 policy reform in Thailand resulted in registration of 2.6 million immigrants by June 2015. Other countries also had a series of regularisation programmes of different scales, sometimes aiming at different nationalities. This includes 288 000 regularised immigrants in the Dominican Republic in 2014-15. South Africa deported 3.3 million immigrants between 1994 and 2015, and Kyrgyzstan deported 1 116 between 2005 and 2009.
Labour migration makes up a large portion of total immigration
Labour migration (Chapter 1) makes up a large portion of total immigration worldwide. In 2015, the number of migrant workers in the world was around 150.3 million (ILO, 2015). In low- and middle-income countries, the average share of the working-age population (ages 15-64) among immigrants – an approximate indication of labour immigration – was 71% (United Nations, 2015). With an average of 79%, the proportion is even higher in most partner countries. The share of working-age immigrants is significantly higher than the average in some countries like Côte d’Ivoire (89.5%), Thailand (89%), Costa Rica (86.3%) and Rwanda (86.1%), while it is lower in Ghana (59.8%), Kyrgyzstan (71.1%) and Argentina (71.4%).
In all partner countries the share of individuals in this age group is higher among immigrants than among native-born populations (Figure 2.6). The prime-age group (ages 25-54) makes up almost half of immigrants, compared to less than 40% of the native-born population. This age distribution translates into a higher age dependency ratio among the native-born than among the foreign-born population in all partner countries. In Côte d’Ivoire, Nepal and Rwanda, the ratio of working-age individuals to dependents is five to one among immigrants, yet the ratio is five to three among the native-born. In Argentina, Ghana and Kyrgyzstan, the ratios between the two groups are similar.
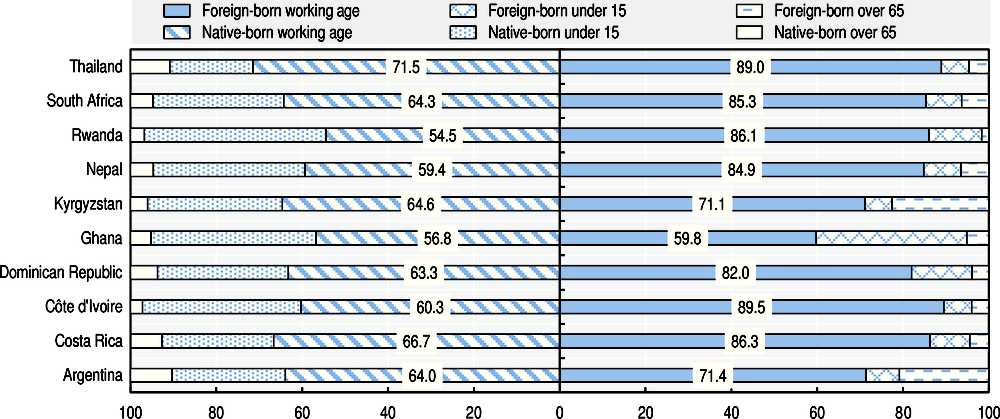
Note: Each population group = 100%. The average share of the working-age population includes population aged 15-64.
Source: Authors’ own work based on OECD/ILO, 2017a-b and OECD/ILO forthcoming a-h.
Drivers of immigration in partner countries
Immigrants choose destination countries based on a series of factors, and these have repercussions on the way immigration contributes to development. One of the main drivers of immigration is the economic benefits immigrants can find in host countries. Specific changes in a country’s economic structure, such as transitioning from an economy based on agriculture to one based on industry and services, result in occupational changes and provide immigrants with different opportunities. In most cases in developing countries, sectoral and occupational changes among immigrant workers may be related to a high and increasing degree of informal economy (Chapter 3 of this report; Hassan and Friedrich, 2016).
Non-economic factors, such as geographical proximity between origin and destination countries, political stability and migrant networks, also help immigrants choose their destination countries (OECD, 2016). The decision to migrate can be linked to the search for better social opportunities, especially for female immigrants who may prefer destination countries that promote gender equality and non-discrimination in social institutions (Ferrant and Tuccio, 2015).
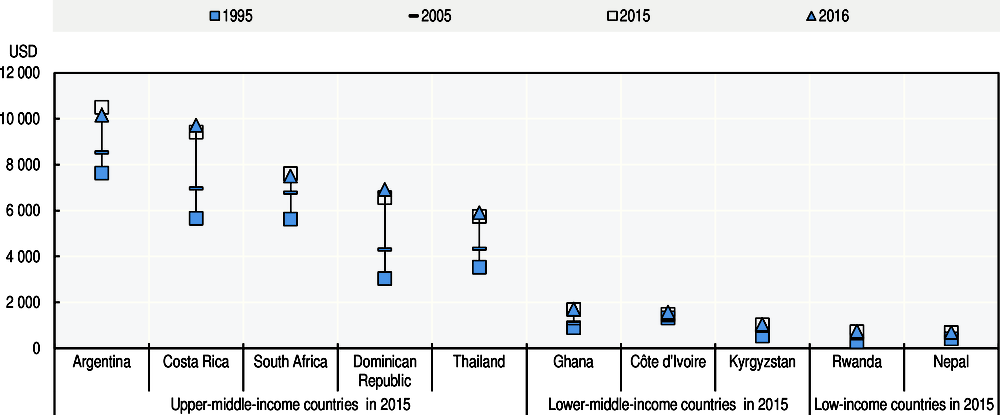
The level of economic development varies among partner countries (Figure 2.7). Since 1995, GDP per capita has increased at a fluctuating rate in most partner countries. Between 1995 and 2016, Costa Rica had the largest increase in GDP per capita followed by the Dominican Republic and Argentina. The other two upper-middle-income countries − South Africa and Thailand – also experienced an increase. On the other end of the spectrum, Nepal and Rwanda had the lowest incomes per capita of the ten partner countries. They showed the lowest growth and slowest structural transformation. While Côte d’Ivoire is a lower-middle-income country, its growth in GDP per capita was the lowest among partner countries.
Source: World Bank (2017), World Development Indicators, https://data.worldbank.org/.
Income gaps between origin and destination countries motivate migration
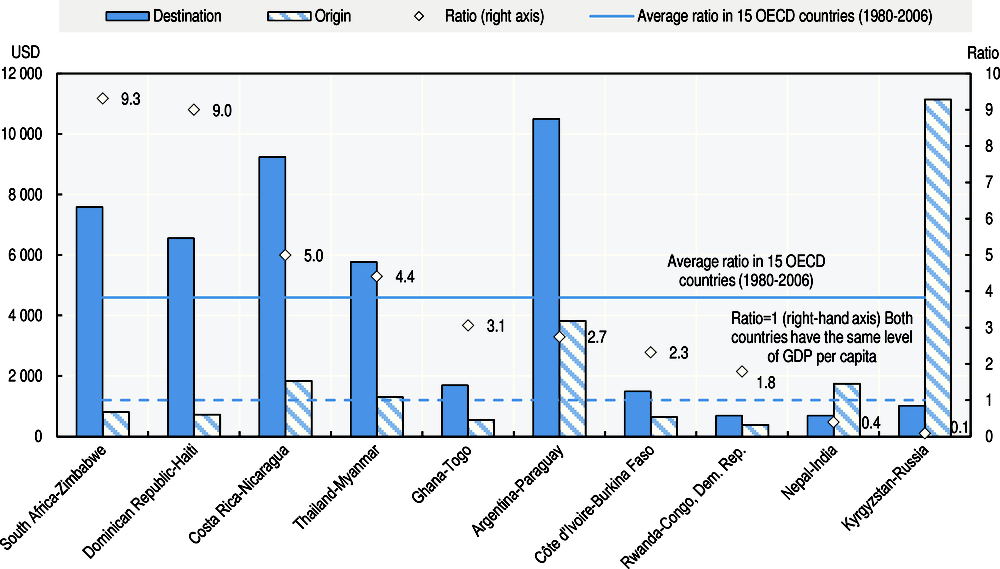
Higher incomes often attract immigrants to neighbouring countries (Figure 2.8) (OECD, 2016). South Africa has a GDP per capita 9.3 times higher than Zimbabwe, the country of origin of most of its immigrants. The Dominican Republic and Haiti have a similar situation, with a ratio of 9.0. Costa Rica and Thailand also have higher GDPs per capita than their major countries of origin, with ratios of 5.0 and 4.4 respectively. These are above the average ratio among 15 OECD countries of 3.8. Two net emigration countries, Kyrgyzstan and Nepal, have the lowest ratios.
Source: Authors’ own work based on World Bank (2017), World Development Indicators, https://data.worldbank.org/. The average of the ratio among 15 OECD countries of destination and 120 countries of origin over the period 1980-2006 is from Ortega and Peri (2012), The effect of income and immigration policies on international migration, www.nber.org/papers/w18322.pdf.
Structural changes in a country attract different skill sets
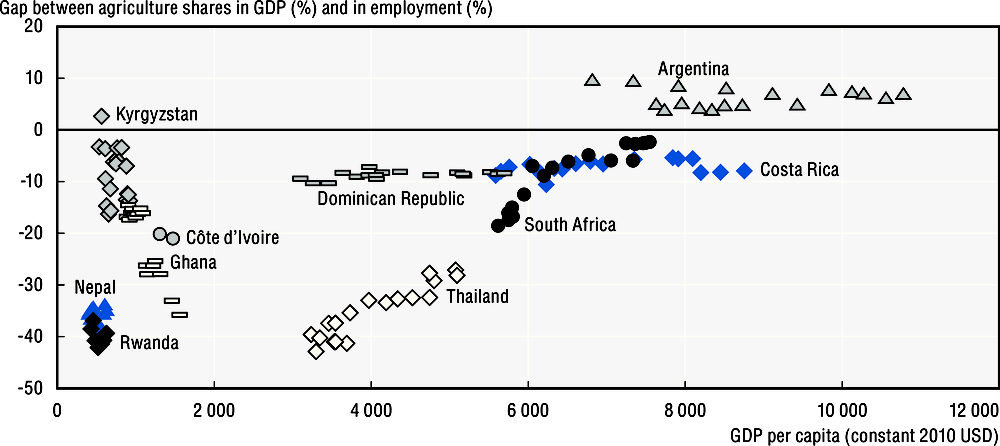
Depending on the make-up of the economy and any structural changes under way, immigrants with different sets of skills are attracted to different sectors and occupations. As a country’s income grows, the share of the agriculture sector decreases and that of other sectors increases (Timmer, 2009; ILO, 2016). This structural change influences immigration. Among the partners, only the upper-middle-income countries have successfully made this change over the past two decades (Figure 2.9). Nepal and Rwanda are still highly dependent on agriculture, in particular for employment, and as well as Côte d’Ivoire and Ghana to a lesser extent.
Note: The gaps are calculated by subtracting agriculture’s share in employment from its share in GDP.
Source: Authors’ own work based on (ILO, 2014a), Global Employment Trends 2014: Supporting Data Sets and World Bank (2017), World Development Indicators, https://data.worldbank.org/. Data on employment shares in Côte d’Ivoire are from Ministère d’État, Ministère de l’Emploi, des Affaires Sociales et de la Formation Professionnelle (2014) and Institut National de la Statistique (2015).
Ghana, Kyrgyzstan, Nepal and Rwanda have seen little structural change as productivity growth in agriculture has stagnated over the past two decades (Figure 2.9). Between 1995 and 2012, these countries exhibited relatively low levels of GDP per capita and its growth (Figure 2.7) along with low shares of immigrants (Figure 2.2). Kyrgyzstan experienced the largest drop in its share of agriculture in GDP (from 44% to 19%) while agriculture’s share in employment decreased from 47% to 32%. Rwanda saw the largest gap between shares of agriculture in GDP and employment (35% versus 75%) in 2012, followed by Ghana (24% and 59%) and Nepal (37% and 71%). Nepal and Rwanda had the highest shares of agriculture in GDP and employment among partner countries, and the gap of these shares in the two countries was almost unchanged. Reflecting this, in Côte d’Ivoire and Nepal, employment in agriculture increased for foreign-born workers, although it decreased considerably for native-born workers.
South Africa and Thailand – having the largest stocks of immigrants among the partner countries – saw impressive agricultural development by reducing the gap between their shares of GDP and employment in agriculture. While Thailand is still struggling with a higher share of employment in agriculture (39% in 2012) compared to the sector’s GDP contribution (12% in 2012), agriculture witnessed a large decline in the foreign-born employment share.
Three Latin America countries saw a steady improvement. In particular, Argentina has a small share of agriculture workers (less than 1%) and produces the highest value added in agriculture per worker (in 2015, 23 361 constant 2010 USD) among partner countries. This reflects the fact that its food and agriculture products are the country’s largest exports (40% of total exports in 2015; OECD, 2017b).
The industry sector is relatively stable with the gap between its shares in GDP and employment being positive in all countries. In 2012, the sector’s share in GDP was the highest in Thailand (37%). Among other partner countries, the sector contributed less than 20% of GDP in Nepal and Rwanda and more than 30% in the upper-middle-income countries, except Costa Rica (24%). Rwanda had one-digit number share of the sector in employment. Thailand showed the highest positive gap between the two shares (37% in GDP and 21% in employment). The gap was the lowest in Kyrgyzstan, Nepal and South Africa.
Most partner countries are service-oriented economies with the service sector contributing more than half of the GDP, except for Côte d’Ivoire, Ghana and Nepal (48% in 2012-13). Costa Rica’s service sector exhibits the highest value added as a percentage of GDP (more than 70%), followed by South Africa, the Dominican Republic and Argentina (more than 60%). The service sector hires more workers, both foreign- and native-born, in all partner countries except Argentina and Côte d’Ivoire. In Côte d’Ivoire, the sector hires 20% less foreign-born workers than native-born. In the Dominican Republic, Ghana, Rwanda and South Africa, employment growth in services was considerably greater for foreign-born workers than for native-born workers (Chapter 3).
A high degree of informality in the labour market can drive immigration
The informal economy and, by extension, informal employment have been major drivers of irregular immigration (Castles, de Haas and Miller, 2014). For example, small firms may seek to avoid labour market regulations such as formal business registrations, formal recruiting and hiring process and associated legal and administrative costs and end up depending on informal channels. Immigrant workers are more likely to engage in the informal sector in some countries, probably because it helps immigrants blend into society, especially when integrating into the destination country is difficult (OECD, 2011; Gagnon and Khoudour-Castéras, 2012). In general, immigrants are more prevalent in informal employment and therefore have a lower level of access to social security benefits than the native-born workers (OECD, 2011).
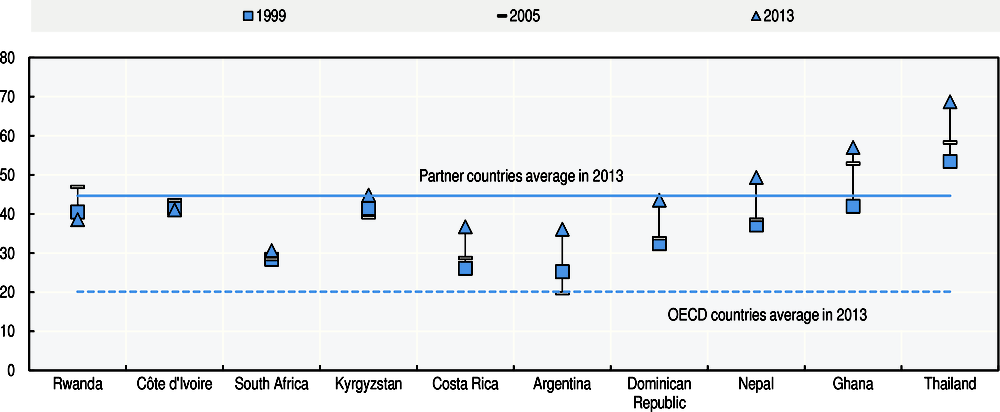
The overall level of informality among partner countries is generally high and increasing. Among partner countries, the informal economy averaged almost 45% of GDP in 2013, up from 37% in 1999 (Figure 2.10). In particular, in Ghana (57%) and Thailand (69%), the informal economy produced more than half of GDP in 2013, had the largest shares among partner countries and grew the most. Only Côte d’Ivoire and Rwanda showed a small decrease in the informal economy. The share of people employed in the informal sector as a percentage of non-agricultural employment varied from 17.8% in South Africa to 69.7% in Côte d’Ivoire according to the international estimation (ILO, 2012). The national estimation of employment in Côte d’Ivoire was even higher at 92% (Institut National de la Statistique, 2015).
Note: Authors’ own work based on Hassan and Friedrich (2016) who estimated the size of the “shadow economy” as a percentage of GDP by using a Multiple Indicators Multiple Causes (MIMIC) model. They defined the shadow economy as “all market-based legal production of goods and services that are deliberately concealed from public authorities” to avoid required payments, standards and procedures. See Hassan and Friedrich (2016) for more details on the MIMIC methodology and assumptions. Countries are sorted by the difference between 1999 and 2013 data.
Source: Hassan and Friedrich (2016), Size and development of the shadow economies of 157 worldwide countries: Updated and new measures from 1999 to 2013, https://doi.org/10.4172/2375-4389.1000218.
Reporting from formal firms confirms partner countries’ high degree of informality (Figure 2.11). For example, Ghana has the highest share of firms that are not formally registered when starting operations (23.5%), followed by the Dominican Republic (21.3%). The three Latin American countries, Côte d’Ivoire and Ghana have a high share of firms (over 60%) competing against informal firms; they identified practices of competitors in the informal sector as a major constraint. Firms in these countries also operated for more years without formal registration.
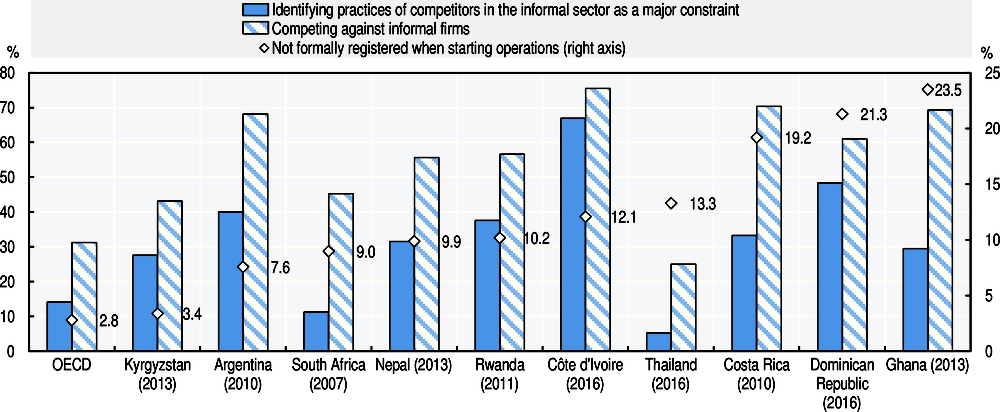
Note: The data refer to formal firms and in most cases include manufacturing firms only. See the source for detailed methodology and country variations. In the figure, countries are ordered according to the percentage of firms not formally registered when starting operations.
Source: World Bank (undated), Enterprise Surveys, http://wwww.enterprisesurveys.org/data/exploretopics/informality/.
Geographical proximity facilitates immigration
Geographic closeness and socio-cultural similarities − such as ethnicity, languages, social customs and historically existing networks or communities − strengthen ties between countries of destination and origin. For example, the vast majority of immigrants in Nepal are from India, reflecting the long and open border shared by both countries. The 1950 India-Nepal Peace and Friendship Treaty cemented a “special relationship” that grants nationals from either country the ability to live and work in the other as well as enjoy the same economic and educational opportunities as citizens. However, this preferential treatment compared to other nationalities does not specify the legal status of Indians in Nepal.
Many immigrants come from a single neighbouring country. Costa Rica, Côte d’Ivoire, the Dominican Republic, Kyrgyzstan and Nepal receive more than half of their immigrant population from one country (Figure 2.12). For geopolitical reasons, 83% of immigrants in Nepal are from India, and 75% in the Dominican Republic come from Haiti. Immigrants from Nicaragua represent 68% of those in Costa Rica, though immigrants are increasingly coming from Colombia. Côte d’Ivoire has two main origin countries: Burkina Faso (59%) and Mali (16%). For historical reasons Kyrgyzstan has a large share of immigrants from Russia (54%), followed by Ukraine (13%) and Kazakhstan (6%). Argentina, Ghana, Rwanda, South Africa and Thailand mainly have immigrants from two to four neighbouring countries.

Note: Countries are ordered according to the share of immigrants in the main country of origin. Only countries of origin which make up at least 8% of the overall stock of immigrants are named.
Source: Authors’ own work based on (World Bank, 2016a), Migration and Remittances Factbook 2016, https://openknowledge.worldbank.org/bitstream/handle/10986/23743/9781464803192.pdf?sequence=3&isAllowed=y2016.
Relatively high political stability also attracts immigrants
Political instability in the home country often drives emigrants to neighbouring countries that are more stable. For example, a civil war in Liberia and a crisis in Côte d’Ivoire resulted in a large number of immigrants entering Ghana. Immigration in Rwanda – much of which was made up of returned exiles – was largely caused by complex and interrelated political crises in the country itself, but also in neighbouring countries such as Burundi and the Democratic Republic of Congo. Most partner countries are more stable than their immigrants’ countries of origin (Figure 2.13). However, Nepal has approximately the same level of political stability as its neighbour India (-0.92 and -0.93 respectively). Other exceptions are Argentina and Côte d’Ivoire that show lower levels of political stability than their immigrants’ main countries of origin (although the International Country Risk Guide reports that Argentina is more politically stable than Paraguay [The PRS Group, undated]).

Note: This index measures the likelihood of political instability and/or politically-motivated violence, including terrorism. Estimates of governance performance range from approximately -2.5 (weak) to 2.5 (strong). Country pairs are sorted based on the difference in index between destination and origin countries.
Source: Authors’ own work based on World Bank (2016b), The Worldwide Governance Indicators, https://data.worldbank.org/data-catalog/worldwide-governance-indicators.
Lower levels of gender discrimination can motivate immigration
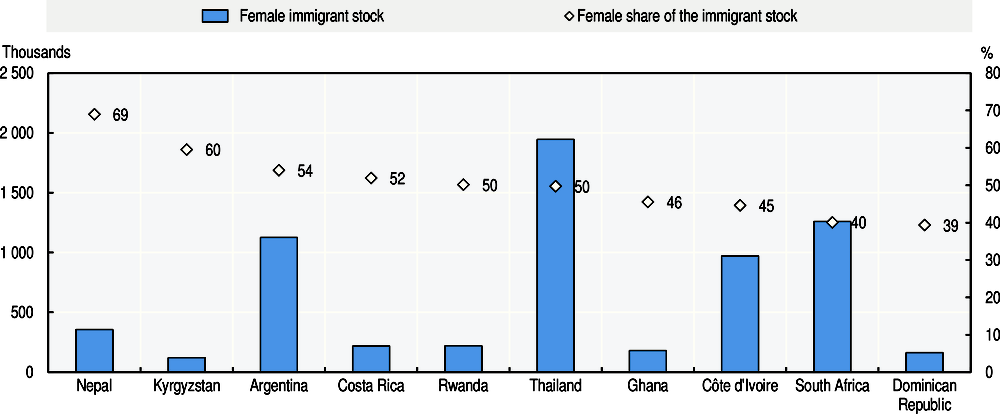
Gender discrimination in social institutions in the countries of origin (OECD, 2016) can explain a higher share of female immigrants in some partner countries (Figure 2.14). Lower levels of discrimination in destination countries motivate women to migrate (Ferrant and Tuccio, 2015). In particular, high-skilled female immigrants are strongly driven by gender equality in the destination countries (Baudassé and Bazillier, 2014), which provide better job prospects and incentives for them. However, discriminatory social institutions in the countries of origin can also limit the possibilities for women to fulfil their migration choices (Ferrant and Tuccio, 2015).
Source: United Nations (2015), Trends in International Migrant Stock: The 2015 Revision, http://www.un.org/en/development/desa/population/migration/data/estimates2/estimates15.shtml.
Females represent at least half of the immigrant population in six partner countries: Argentina, Costa Rica, Kyrgyzstan, Nepal, Rwanda and Thailand (Figure 2.14). Females are more likely to migrate for family than work reasons. For example, increasing numbers of Indian-born women move to Nepal due to marriage and the ease of receiving citizenship. In Argentina, women are in the minority (27-28%) among labour immigrants while they are in the majority among family immigrants (Organization of American States, 2015).
Most partner countries have lower levels of gender inequality than their immigrants’ major countries of origin. This implies that female immigrants may come to the partner countries searching for better conditions (Figure 2.15). Only two partner countries − Ghana and Nepal − exhibit higher levels of gender discrimination than their immigrants’ main countries of origin (Figure 2.15). On average, partner countries have higher levels of gender inequality than OECD countries covered in the OECD Social Institutions and Gender Index (SIGI).4 Three Latin American partner countries (Argentina, Dominican Republic and Costa Rica) are among the countries with the lowest levels of gender discrimination in social institutions out of the 160 countries presented in the SIGI (OECD, 2014b).
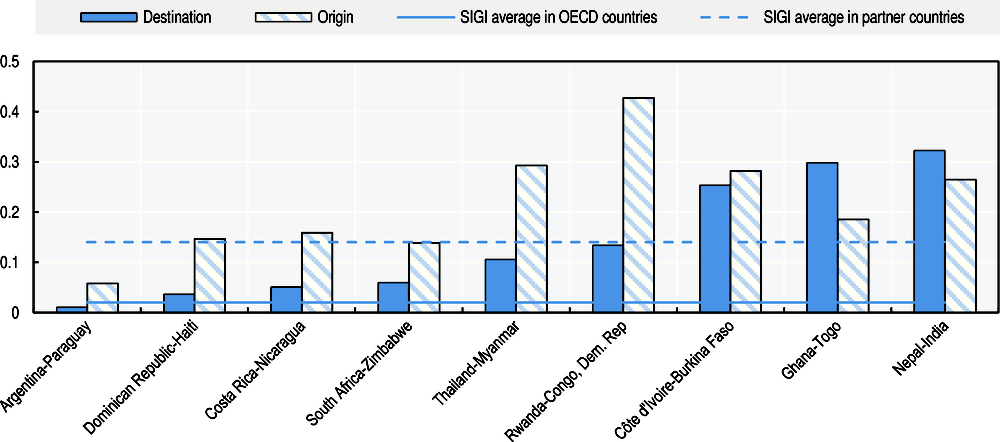
Note: Measures vary from 0 (very low level of discrimination) to 1 (very high level of discrimination). SIGI data are not available for Russia (the major country of origin of Kyrgyz immigrants). OECD countries covered in the SIGI study are Belgium, Czech Republic, France, Italy, Slovenia, Spain and Turkey.
Source: OECD (2014b), Social Institutions and Gender Index (SIGI): 2014 Synthesis Report, OECD Publishing, Paris, https://www.oecd.org/dev/development-gender/BrochureSIGI2015-web.pdf.
Immigration and integration in law and in practice
Creating legal provisions for immigrant workers and putting them into practice are two different challenges. Partner countries have a wide range of immigration and integration policies, from an open immigration regime encompassing all immigrants with equal access to all rights such as in Argentina and Costa Rica, to a more restrictive regime such as in Thailand where laws reserve some occupations for Thai workers. Other countries such as Côte d’Ivoire and Nepal have no clear policy framework for regulating immigrant flows nor integration programmes, yet feature different degrees of openness and restriction vis-à-vis immigration. Immigrants in Côte d’Ivoire enjoy similar rights to native-born citizens, though they are limited in acquiring and owning rural land. Nepal has an open border policy with India. Ghana and Rwanda have developed policies that encourage immigration as a means to development. Similarly, South Africa has diversified the origin countries of its immigrants following economic restructuring in the 1990s.
The current challenges of labour immigration are mostly related to management and co-ordination (Box 2.1). Some partner countries, such as Costa Rica, Kyrgyzstan, South Africa and Thailand, illustrate the challenges that arise from frequently carrying out reforms and changing the institutions responsible for immigration. Such changes and ad-hoc approaches prevent consistent and responsive governance of labour immigration. Moreover, a lack of information on the number of immigrants present in the country, their status and needs makes it difficult to provide them with access to public services and to implement integration policies.
Close co-ordination for labour immigration management between relevant stakeholders such as the labour and interior ministries and employer representatives can improve the impacts of immigration and reduce unnecessary costs. This includes anticipating skills shortages and immigrant needs. However, most partner countries could better manage institutional co-ordination, transparency and clarity in labour immigration.
In Costa Rica via the 2012-13 transitorios (temporary measures), the General Directorate of Migration and Aliens – an inter-institutional body – announced that immigration offices would accept documents from the Nicaraguan Consulate in Costa Rica. However, the Treasury had not approved the exoneration of document fees that would be waived under the Immigration Department’s directive. There was also a lack of co-ordination among banks, the Caja Costarricense de Seguro Social (CCSS) and immigration offices. Both enhanced co-ordination among institutions that implement immigration law and lower fees and fines in line with the economic means of most irregular immigrants would help remove the existing contradictions in managing immigrants (Fouratt, 2016).
In Nepal, complex co-ordination requirements between government institutions hinder the country in implementing various provisions of admission and integration policies. While the Department of Labour is responsible for overseeing work-related matters, the Department of Immigration is responsible for issues relating to foreign nationals. This makes addressing irregularity difficult. In addition, the Ministry of Home Affairs has made it mandatory for foreigners seeking work in Nepal to present a “character certificate” issued by the Nepal police for renewing visas, in order to monitor immigrant activities and maintain data. This not only places an extra burden on immigrant workers but also involves the police in immigration matters.
In South Africa, institutions could improve co-ordination of work permit applications to avoid skills shortages. Regarding the skill-based quota system in force from 2007 to 2011, the main stakeholders – Sector Education and Training Authorities (SETAs), the Department of Labour (DoL), the business sector and organised labour – disagreed over the calculation methodologies and the definitions of skills shortages and of skills gaps per sector. Moreover, the DoL did not have direct access to databases of the Department of Home Affairs (DHA), and the quota was allocated almost entirely at the discretion of the DHA minister. This resulted in significant discrepancies between official estimates of skills shortages and the quota lists issued by the DHA (Erasmus and Breier, 2009). In order to address this issue, a 2016 Green Paper supported strengthening inter-departmental capacity, a points-based system and mechanisms for the transfer of skills. However, the list of critical skills in demand adopted in the 2014 immigration regulations after the repeal of the quota permit in 2011 remains an issue. The reasons for these difficulties include internal organisational problems, as the DHA saw several changes in ministers in the 2000s and as the members of Immigration Advisory Board rarely consult each other or social partners.
Although countries are still struggling to understand immigration and its impacts, reforms and strategies for improvements are underway. For example, in Costa Rica work on policy coherence is undertaken by the National Council for Migration, consisting of the General Directorate of Migration and Aliens along with several relevant ministries. The Costa Rican Government is committed to managing immigration flows, ensuring adequate integration of immigrants, and promoting national development through regulation and co-ordination of inter-agency actions on migration through the Integrated Migration Policy 2013-2023 (National Council of Migration, 2013). The Dominican Republic has made efforts to manage immigration in a more systematic way, including by clearly defining a national migration policy, supported by the National Institute of Migration (Instituto Nacional de Migración). Ghana’s National Policy on Migration, launched in April 2016, provides for harmonising internal, regional and international migration policies with international treaties and conventions as well as with domestic policy initiatives relating to migration, labour transfer and development. In Nepal, based on the 2015 National Employment Policy, the Department of Immigration set up an integrated database system to meet international standards, establishing better mechanisms for co-ordination across government agencies, simplifying laws, regulations and procedures, and developing the department’s institutional capacity. Similar efforts are underway in Côte d’Ivoire.
Work visas and permits are not the only channels for labour immigration
Partner countries set requirements and conditions of work through visas or permits of various types and lengths. In South Africa for example, general work visas represented 58% of work-related visa applications (91 000 temporary residence visas), intra-company transfers 18% and corporate work visas 4% over the period 2010-13. In Costa Rica, work permits are issued depending on national demand; immigration law seeks to prevent immigrant workers from displacing the national workforce (National Council of Migration, 2013).
In some countries, laws and policies such as industrial enterprises acts or labour codes include reservations relating to the employment of foreign nationals. In some instances, the employer of an immigrant worker is required to prove that the post cannot be filled by a native-born worker. In other cases, certain occupations are reserved for native-born citizens. For example in Nepal, foreign nationals may only be hired with prior approval from the Department of Labour and for a maximum period of five years, after which time employers have to replace the non-Nepali employee with a Nepali. By contrast, laws in Costa Rica and Côte d’Ivoire provide non-discriminatory principles. Other countries such as Ghana, Kyrgyzstan and Rwanda attract immigrants to enhance skills for innovation and facilitate investment.
Labour immigration quotas
Labour immigration quotas can be used to limit the number of labour immigrants and to direct them to specific occupations or sectors. Argentina, Côte d’Ivoire, Nepal and Rwanda have no specific quotas in place. Some other partner countries have certain forms of quotas. For example, at the firm level, foreign-born workers can represent up to 40% of staff under corporate permits in South Africa, while companies in the Dominican Republic are only allowed to employ immigrant workers up to 20%. In Ghana individual companies have some restrictions on the total number of immigrant employees.
The Dominican Republic, Ghana, Kyrgyzstan and Thailand set immigrant labour quotas according to the situation of the local labour market. In the Dominican Republic, the National Migration Council (Consejo Nacional de Migración) sets annual quotas for temporary workers based on consultations with agricultural stakeholders, the private sector and labour unions for unmet demands for skilled labour (Migration Law 285-04). The Ghana Immigration Quota Committee, administered by the Ministry of Interior and consisting of representatives from eight other government services, has streamlined its operations by having other organisations approve certain work permit decisions based on the amount of investment of the company requesting foreign-born workers. The Committee granted 38 411 residence permits in 2015 (Ghana Immigration Service, 2015). In Kyrgyzstan, quotas for immigrant workers are around 12 000-14 000 each year. This quota, usually left unmet, is mostly filled by Chinese workers. The Thailand permanent residential permit quota was set at 100 individuals of each nationality in 2016.
Requirements to obtain work visas and permits, and restrictions to employment
Most countries impose certain conditions to obtain a work visa and permit, but in some cases no requirements are necessary. None of the partner countries have restrictions in terms of age, gender or marital status in the work permit application processes, other than some limitations on minors. Similarly, none of the partner countries require language or cultural tests, although certain tests can be required for student visas or naturalisation applications, for example in Ghana. The Rwanda Development Board checks qualifications but it is unclear what tests are implemented for investors and skilled workers visas. Such legal immigration processes are often expensive and take months, so immigrants may seek informal channels which are cheaper and faster.
In countries with an open-door policy such as Argentina, it is possible to look for a job on a tourist visa (mostly free on arrival for 90 days) then go to the immigration department with a letter from their employer and a certificate of good conduct from their country of origin.5 Similarly in Nepal, immigrants obtain labour permits from the District Labour Office through their employers and residential visas from the Ministry of Home Affairs on the recommendation of the Department of Labour. Indian citizens are afforded special privileges in Nepal in terms of residence, property ownership and employment on par with Nepali citizen, without any visa or permit, which makes tracking more difficult.
In the Dominican Republic, workers can freely change employers within a specific sector, occupation or region. In Thailand, immigrant employment is tied to a specific employer; while the change of employer is possible, it requires a new work permit application. Both countries have a de jure (but not de facto) right to redress if the terms of and employment contract have been violated by an employer.6
In South Africa, with the exception of those with critical skills and permanent residence or specific cases approved by the Department of Home Affairs, immigrant workers are not allowed to change jobs; permits are tied to a specific job and employer. For specific large scale labour needs, corporate permits are required for employers of foreign-born staff.
Most countries provide generous visa arrangements and incentives for investors. Examples are open admission and entry and exit of foreign investments including regulatory, fiscal and non-fiscal incentives in most sectors.
The role of trade unions and union participation by immigrants
In most partner countries, immigrants have limited rights, and trade unions have little or no role in the work permit application processes. Costa Rica’s constitution prohibits foreigners from exercising leadership or authority in trade unions. In Nepal, foreign-born workers do not have the right to found an association or participate as members with voting rights. In the Dominican Republic, immigrant workers have the right to join or found a trade union, but in practice must have regular immigration status and a Dominican identity card to do so. As a consequence, rates of union affiliation are low in this country. In Kyrgyzstan, trade unions play a role, though somewhat weak, in protecting immigrant workers and their rights. In Thailand, immigrants have no rights regarding trade unions, reflecting strong opinions against non-Thais joining unions (Martin, 2007).
However, in countries where strong collective agreements and wide union coverage are present, trade unions often significantly help manage immigrant workers. In South Africa, for example, labour legislation and collective bargaining conditions apply fully to all workers regardless of their nationality or immigration status. The Commission for Conciliation, Mediation and Arbitration, the national tripartite dispute mechanism, is entitled to deal with disputes brought forward by immigrant workers, including irregular immigrants.
Regulation and regularisation processes for irregular workers
Most partner countries require employers to verify the legal status of prospective employees. Any violation is subject to sanctions. In Costa Rica, for example, the 1993 immigration law provides for sanctions such as imprisonment or fines. Although Ghana does not require verification of the status of prospective employees, non-compliance with immigration rules relating to employment is punishable. Kyrgyzstan and South Africa poorly enforce their sanctions. The absence of work permits in Kyrgyzstan ostensibly leads to judicial recover of incomes gained out of economic activities to the state budget, a deprived right to carry out the activities, and administrative punishment.
Regarding regularisation, several partner countries have granted amnesties or enacted similar processes. The Dominican Republic implemented a one-time National Regularisation Plan in 2014-15, regularising 288 466 immigrants, although the majority had temporary status that does not completely correspond with available categories in the Migration Law (OBMICA, 2015). In post-apartheid South Africa, three amnesties took place. The country granted permanent residency to 51 504 mineworkers in 1995, 124 073 Southern African Development Community (SADC) nationals in 1996 and 82 689 Mozambicans in 1999-2000. In addition, Zimbabweans were regularised through special dispensations in 2009-10 and Basotho in 2016 (Budlender, 2013). However, as part of the management of irregular workers, South Africa deported 3.3 million immigrants between 1994 and 2015. Thailand frequently applies temporary measures7 in addition to two nationality verifications and memoranda of understanding. The 2013 round of nationality verification regularised almost 900 000 irregular immigrants from Cambodia, the Lao People’s Democratic Republic and Myanmar (Huguet, 2014).
Regularisation programmes help maximise economic impacts of immigrants to the extent that they discourage irregular immigration. Regular immigrants pay taxes, can start a business, contribute to the formal rather than the informal sector, better match their job and qualifications, and enjoy higher incomes (Kaushal, 2006). Such benefits lead to better integration outcomes, increased consumption and further positive economic impulses. Amnesties seem to have improved the labour market outcomes of skilled immigrants that previously had an irregular status (Kaushal, 2006).
Immigrants have rights and access to public services, yet concrete integration policies are needed
Integration policies, including sectoral policies, aim to increase the economic mobility and social inclusion of immigrants. National laws often forbid discrimination against immigrants or do not distinguish between immigrants and native-born citizens. However, without specific integration policies and their effective implementation, immigrants may lack access to public services or rights, preventing their integration into society. Immigrants have various levels of access to public services across partner countries (Table 2.1), but the level of actual benefits is not always clear.
Access to employment and pension benefits
Immigrant workers in all partner countries have the same rights as local workers in terms of equal pay for the same work, and equal employment conditions and protections, yet in some cases are bound by regulations and restrictions. Most labour market benefits, including pension and unemployment benefits, are only extended to regular immigrants. Regulations concerning access to education and health are less strict (Table 2.1). In Côte d’Ivoire (and similarly in Costa Rica), the 2015 Labour Code stipulates a non-discriminatory principle regarding remuneration and protection of labour rights. In Nepal, immigrants are limited in how they use their salaries; they can only send up to 75% of it to their countries of origin.
Access to public education and training
Education and training including language instruction help immigrants integrate. In general among partner countries, access to public education and training is immediately available for regular immigrants, although there are limitations. In Argentina and Costa Rica, language integration is often not an issue because most immigrants already speak Spanish. Yet native-born students who do not speak the language of assessment also represent a sizeable proportion of the student population in partner countries. In Thailand for example, these students constitute over 40% of the student population (OECD, 2013). In the Dominican Republic, conflicting policy documents often lead to confusion over access to and benefits from public education and training among immigrant students. In Nepal, a study visa is granted to foreign-born citizens, and their family members, if they come to study, teach or conduct research in any educational institution (1994 Immigration Regulation). However, obtaining such a study visa requires a significant yearly income.
Skills and qualification recognition
A lack of skills and qualification recognition among immigrants prevents their full integration. Partner countries have instruments to recognise foreign qualification, but these are not used systematically. Immigrants are often overqualified or underqualified for their jobs especially when no mechanism for recognising foreign qualifications is accessible. In Argentina, current bilateral and multilateral skills recognition agreements tend to be restricted either to the academic sector or to primary and secondary education (Molina, 2013). In the Dominican Republic, foreign degrees or diplomas are generally accepted by employers. Technical workers with permanent residence may seek formal accreditation of their competencies or validation of degrees and/or certificates through the national training institute (ILO, 2014b). In South Africa, most foreign degrees and diplomas are recognised through the South African Qualifications Authority (SAQA); for certain professions and occupations, critical skills visas or permanent residence permit applicants are referred to professional associations recognised by the Department of Home Affairs.
Côte d’Ivoire, Ghana and Nepal have similar processes of foreign degree accreditation. In Côte d’Ivoire, the Direction des Examens et Concours generally authenticates foreign qualifications, while the Ministry of Higher Education and Scientific Research covers higher education levels. As a member of the Bologna Process, the country recognises diplomas awarded in compliance with the Process. In Ghana, the National Accreditation Board evaluates foreign degrees and issues individual letters regarding their local equivalence, charging fees for the respective services. In Nepal, the Recognition and Equivalency Determination Committee determines criteria for equivalence (2002 Education Rules).
Access to public health services
Most partner countries immediately grant access to public health services to immigrants. Irregular immigrants in Costa Rica, Kyrgyzstan, Nepal and Thailand have no access to non-emergency health care, although Costa Rica and Kyrgyzstan provide access to other types of public health care. In the Dominican Republic, access to health services may not be readily available, especially for those without health insurance (84% according to the 2012 National Immigrants Survey).8
Nepal and Thailand have limited provisions regarding immigrant access to health services: they only cover regular workers. In Nepal, none of the policies explicitly mention whether foreigners barred from benefits or if policy provisions are restricted to Nepalese only. In Thailand, immigrants registered via the nationality verification or memorandum of understanding process can benefit from the social security system. It offers more comprehensive coverage than the Compulsory Migrant Health Insurance Scheme (IOM, 2014). But immigrants working in certain sectors are not eligible and not all immigrants take advantage of this system (WHO, 2012).
In Côte d’Ivoire, as in Ghana, the Dominican Republic and South Africa, immigrant workers have extensive access to health care, including universal health insurance (Table 2.1). A 2014 decree creating the Caisse Nationale d’Assurance Maladie grants this insurance to all residents in Côte d’Ivoire, including both regular and irregular immigrants.
Civil, economic, social and political rights
In general, partner countries guarantee similar civil, economic and social rights to immigrants. Immigrants have the same civil rights as citizens such as equal treatment and protection before criminal courts and tribunals, family reunification, and legal remedies and redress in case of withdrawal or non-renewal of a residence permit or in case of a deportation order. However, in Kyrgyzstan immigrant rights to remedies and redress extend only to those who have a residence permit. In the Dominican Republic and Thailand, immigrant rights are not fully enforced. Failure to respect due process is frequently reported in the Dominican Republic (Amnesty International, 2016). In Thailand, the 1998 Labour Protection Act is weakly enforced and immigrants find no avenue to complain against violations of the law (IOM and ARCM, 2013). Ghana has some restrictions in the economic rights of immigrants: for example, the 1992 Constitution barred immigrants from acquiring land permanently (1992 Constitution, Article 296).
Regarding political rights, most partner countries do not allow immigrants to vote in any elections or run for office. The exception is Argentina where immigrants can run in local and regional elections after a certain amount of time in the country.
Access to citizenship
Naturalisation is one of the key policies that facilitate the integration of immigrants. It can affect the degree to which immigrants identify with their host society and, in turn, how much they wish to contribute to civil life. Immigrants who come from countries that allow dual citizenship rights opt more frequently for naturalisation (Mazzolari, 2009). A naturalisation policy can reflect whether a country’s immigration policies are open or restrictive. In Ghana, for example, policies changed from permissive to closed and back to permissive, allowing immigrants citizenship other than Ghanaian.
Laws and practices regarding the acquisition of citizenship and dual citizenship are complex and depend on the host country’s relationship with other countries. In general, citizenship acquired by naturalisation requires a number of years of permanent or temporary residence, ranging from two years in Argentina, three years in Costa Rica, five years in Côte d’Ivoire, Ghana, Kyrgyzstan, Nepal,9 Rwanda and South Africa, and seven years in the Dominican Republic. Dual citizenship is allowed in Ghana and Kyrgyzstan and partially in South Africa (where immigrants face the possible loss of citizenship if another citizenship is acquired voluntarily).
Concerning the second generation, most partner countries apply the principles of jus sanguinis.10 In Côte d’Ivoire, the 1972 Act amending the 1961 Law on the Nationality Code removed the possibility for the children of immigrants born in Côte d’Ivoire to acquire Ivorian nationality. A special provision on naturalisation in 2005 and the 2013 law on the acquisition of Ivorian nationality allowed counter cases; however, only 50 000 certificates of nationality (one tenth of estimated cases concerned) were issued between 2014 and 2016. In Nepal, naturalisation tends to be at the state’s discretion rather than a right in itself. Moreover its 2015 Constitution has barred naturalised citizens from appointments to the upper echelons of political authority. The current provisions relating to citizenship in the 2015 Constitution discriminate against women.
International legal instruments can contribute to better immigration management and integration
Bilateral agreements
Bilateral agreements are among the most effective measures regarding labour immigration governance, especially as they ensure social benefits for immigrants on their return to their origin countries (Holzmann, Koettl and Chernetsky, 2005; Holzmann, 2016). In some countries, immigrants enjoy visible benefits through bilateral agreements and related issues, while other countries do not implement the agreements.
The majority of migration-related bilateral agreements in partner countries relate to their role as countries of origin. Argentina made bilateral agreements with Chile (Convention on Temporary and Seasonal Workers) and Brazil (Sao Borja Treaty) and multilateral agreements with the Common Market of South America (MERCOSUR) members or associated countries.
Costa Rica, Kyrgyzstan, South Africa and Thailand have certain agreements as countries of destination. In Kyrgyzstan, a 2009 agreement with Kazakhstan on the procedure for self-employment of nationals allows Kazak citizens (only regular immigrants) to temporarily carry out individual entrepreneurial activities without establishing a legal entity in Kyrgyzstan. Other bilateral agreements between these two countries cover (i) labour activities and the social protection of immigrant workers in agricultural work in border areas (2002) and (ii) labour activities and the protection of the rights of temporary immigrant workers (2006). South Africa signed agreements in the 1990s to import skilled labour, such as medical doctors from Cuba and Tunisia.
Regional co-operation
Regional co-operation can promote intra-regional mobility and improve the integration of immigrants. Regional economic communities such as the Economic Community of West African States (ECOWAS), East African Community (EAC), Southern African Development Community (SADC), MERCOSUR and Association of Southeast Asian Nations (ASEAN) are working on frameworks that improve regional labour mobility. Often, the recognition of skills is a key priority. Most partner countries are members of a regional economic community (Table 2.2).
International conventions
Not all partner countries have ratified the international conventions related to international migration. Nepal and Thailand in particular appear non-committed to international institutions in the area of migration (Table 2.3). Kyrgyzstan is the only partner country to have ratified an international convention on migrant labour. Argentina, Costa Rica, the Dominican Republic and South Africa have ratified the Convention on Domestic Workers 2011 (C189), but these countries remain weak in terms of concrete protection measures for immigrant domestic workers.
International conventions play an important role in protecting the rights of immigrant workers. They facilitate immigrants’ integration into the labour market and thus maximise their economic contribution in the destination country.
Conclusions and remaining challenges
This chapter described how the various immigration patterns, drivers of immigration and policy environments among the ten partner countries contribute to how immigrants and their families integrate into both the labour market and society as a whole. The comparative analysis highlighted the importance of labour immigration and its major drivers, including income differentials, different skills set requirements due to structural changes and the economies’ high degree of informality. Different immigration flows and their historical drivers have shaped the policy and institutional provisions relevant to immigration, and in turn those provisions are reshaping the flows and drivers of immigration. This interaction ultimately influences the ways immigrants impact the economies of destination countries.
The analysis in this chapter suggests that responsive and consistent governance of immigration, together with well-coordinated implementing bodies, can maximise the positive impacts of immigration. This is especially the case when governance accommodates the economic changes underway in a country in coherence with its stated development goals. Existing immigration systems and integration policies need to be constantly adjusted to changing economic and demographic conditions (OECD, 2015). This is particularly important for developing countries that are undergoing economic and demographic transitions. Unfortunately, many of the partner countries still lack both a comprehensive national immigration policy that is coherent with other policies, in particular labour policies, and harmonisation between their national immigration policies and the regional integration process.
The following chapter will take a closer look at the labour market outcomes of native- and foreign-born workers. It will show how well foreign-born workers are integrated into the destination countries’ labour markets compared to native-born workers. The presence of foreign-born workers changes the shape of labour markets and influences the choices and outcomes of native-born workers, which affect the way immigrants contribute to destination countries.
References
Amnesty International (2016), Where Are We Going to Live: Migration and Statelessness in Haiti and the Dominican Republic, www.amnestyusa.org/sites/default/files/amr3641052016_where_am_i_going_to_live.compressed.pdf.
Baudassé, T. and R. Bazillier (2014), “Gender inequality and emigration: Push factor or selection process?”, International Economics, Vol. 139, pp. 19-47.
Budlender, D. (2013), Improving the Quality of Available Statistics on Foreign Labour in South Africa: Existing Data-Sets. MiWORC Report N° 2, African Centre for Migration & Society, University of the Witwatersrand, Johannesburg.
Castles, S., H. de Haas and M. J. Miller (2014), The Age of Migration: International Population Movements in the Modern World, Palgrave Macmillan, Basingstoke.
Department of Home Affairs of South Africa (2016), “Green paper on international migration”, Government Gazette No. 40088, 24 June 2016.
Erasmus, J. and M. Breier (2009), Skills shortages in South Africa. Case studies of key professions, Human Sciences Research Council, Pretoria.
Eurasian Economic Commission (2016), Trudovaya migratsia i sotsialnoye obespecheniye trudyashihsya v Evraziyskom ekonomicheskom soyuze [Labour Migration and Social security of Workers in the Eurasian Economic Union], Moscow, www.eurasiancommission.org/ru/Documents/spreads.pdf.
Ferrant, G and M. Tuccio (2015), “South-South migration and discrimination against women in social institutions: A two-way relationship”, World Development, Vol. 72, pp. 240-254, www.elsevier.com/locate/worlddev.
Fouratt, C. E. (2016), “Temporary measures: The production of illegality in Costa Rican immigration law”, Political and Legal Anthropology Review, Vol. 39/1, http://onlinelibrary.wiley.com/doi/10.1111/plar.12136/epdf.
Gagnon, J and D. Khoudour-Castéras (2012), “South-South migration in West Africa: Addressing the challenge of immigrant integration”, OECD Development Centre Working Papers, No.312, OECD Publishing, Paris, https://doi.org/10.1787/5k98p4wcgjmx-en.
Ghana Immigration Service (2015), Annual Report 2015, www.247mobilegh.com/ACTS%20AND%20REGULATIONS/GIS%202015%20ANNUAL%20REPORT%20NEW%20singles.pdf.
Hassan, M. and S. Friedrich (2016), “Size and development of the shadow economies of 157 worldwide countries: Updated and new measures from 1999 to 2013”, Journal of Global Economics, Vol. 4/3, https://doi.org/10.4172/2375-4389.1000218.
Holzmann, R. (2016), “Do bilateral social security agreements deliver on the portability of pension and health care benefits? A summary policy paper on four migration corridors between EU and non-EU member states”, Social Protection and Labor Discussion Paper 1605, World Bank, Washington, DC, http://documents.worldbank.org/curated/en/380411467296864200/Do-bilateral-social-security-agreements-deliver-on-the-portability-of-pensions-and-health-care-benefits-A-summary-policy-paper-on-four-migration-corridors-between-EU-and-non-EU-member-states.
Holzmann, R., J. Koettl and T. Chernetsky (2005), “Portability regimes of pension and health care benefits for international migrants: An analysis of issues and good practices”, Social Protection, Human Development Network, World Bank, Washington, DC.
Huguet, J. W. (2014), Thailand Migration Report 2014, United Nations Thematic Working Group on Migration in Thailand, Bangkok.
ICMPD and IOM (2015), A Survey on Migration Policies in West Africa, International Center for Migration Policy Development and International Organization for Migration, https://www.icmpd.org/fileadmin/ICMPD-Website/ICMPD_General/Publications/2015/A_Survey_on_Migration_Policies_in_West_Africa_EN_SOFT.pdf.
ILO (2016), Key Indicators of the Labour Market, 9th ed., International Labour Office, Geneva, http://www.ilo.org/wcmsp5/groups/public/---dgreports/---stat/documents/publication/wcms_498929.pdf.
ILO (2015), ILO Global Estimates on Migrant Workers - Results and Methodology, International Labour Office, Geneva, www.ilo.ch/global/topics/labour-migration/publications/WCMS_436343/lang--en/index.htm.
ILO (2014a), Global Employment Trends 2014: Supporting Data Sets, International Labour Office, Geneva, www.ilo.org/global/research/global-reports/global-employment-trends/2014/WCMS_234879/lang--en/index.htm.
ILO (2014b), Perspectiva Laboral: Migración Laboral, Logros y Retos, International Labour Office, San José, www.ilo.org/wcmsp5/groups/public/---americas/---ro-lima/---sro-san_jose/documents/publication/wcms_240120.pdf.
ILO (2012), The Informal Economy and Decent Work: A Policy Resource Guide, International Labour Office, Geneva, http://ilo.org/wcmsp5/groups/public/---ed_emp/---emp_policy/documents/publication/wcms_212689.pdf.
ILO (undated), Normlex database for the ILO conventions, http://www.ilo.org/dyn/normlex/en/f?p=NORMLEXPUB:1:0::NO:::.
Institut National de la Statistique (2015), Enquête sur le niveau de vie des ménages en Côte d’Ivoire 2015, Institut national de la statistique, Abidjan.
IOM (2014), Thailand Migration Report 2014, International Organization for Migration, IOM Publishing, Bangkok.
IOM and ARCM (2013), Assessing Potential Changes in the Migration Patterns of Myanmar Migrants and Their Impacts on Thailand, International Organization for Migration and Asian Research Center for Migration, Bangkok.
Jachimowicz, M. (2006), “Argentina: A new era of migration and migration policy”, Migration Information Source, Migration Policy Institute, https://www.migrationpolicy.org/article/argentina-new-era-migration-and-migration-policy.
Kaushal, N. (2006), “Amnesty programs and the labor market outcomes of undocumented workers”, The Journal of Human Resources, Vol. 41(3), pp. 631-647.
Konan, S. Y. (2009), Migration en Côte d’Ivoire, International Organization for Migration, Geneva.
Lowell, B. L. and A. Findlay (2001), “Migration of highly skilled persons from developing countries: Impacts and policy responses”, International Migration Papers 44, International Labour Organization, www.ilo.org/wcmsp5/groups/public/---ed_protect/---protrav/---migrant/documents/publication/wcms_201706.pdf.
Martin, P. (2007), The Economic Contribution of Migrant Workers to Thailand: Towards Policy Development, ILO Publishing, Bangkok.
Mazzolari, F. (2009), “Dual citizenship rights: Do they make more and richer citizens?”, Demography, Vol. 46/1, pp. 169-191.
Ministère d’État, Ministère de l’Emploi, des Affaires Sociales et de la Formation Professionnelle (2014), Enquête nationale sur la situation de l’emploi et du travail des enfants (ENSETE) 2013.
Molina, M. (2013), “La revalidación de títulos universitarios en el MERCOSUR”, Revista del Núcleo de Estudios e Investigaciones en Educación Superior del MERCOSUR, https://revistas.unc.edu.ar/index.php/integracionyconocimiento/article/view/5702.
National Council of Migration (2013), Comprehensive Immigration Policy for Costa Rica (Política Migratoria Integral Para Costa Rica), San José, September 2013, www.migracion.go.cr/institucion/politica/Politica%20Migratoria.pdf.
OBMICA (2015), Estado de las Migraciones que Atañen la República Dominicana 2015, https://cnnespanol2.files.wordpress.com/2017/06/estado-del-arte-migracion-2015-completo.pdf.
OECD (2017a), Interrelations between Public Policies, Migration and Development, OECD Publishing, Paris, https://doi.org/10.1787/9789264265615-en.
OECD (2017b), OECD Economic Surveys: Argentina 2017: Multi-dimensional Economic Survey, OECD Publishing, Paris, https://doi.org/10.1787/eco_surveys-arg-2017-en.
OECD (2016), Perspectives on Global Development 2017: International Migration in a Shifting World, OECD Publishing, Paris, https://doi.org/10.1787/persp_glob_dev-2017-en.
OECD (2015), International Migration Outlook 2015, OECD Publishing, Paris, https://doi.org/10.1787/migr_outlook-2015-en.
OECD (2014a), “Is migration good for the economy?”, Migration Policy Debates, No. 2, May 2014, OECD, Paris, www.oecd.org/els/mig/OECD%20Migration%20Policy%20Debates%20Numero%202.pdf.
OECD (2014b), Social Institutions and Gender Index (SIGI): 2014 Synthesis Report, OECD Publishing, Paris, https://www.oecd.org/dev/development-gender/BrochureSIGI2015-web.pdf
OECD (2013), PISA 2012 Results: Excellence through Equity (Volume II): Giving Every Student the Chance to Succeed, OECD Publishing, Paris, https://doi.org/10.1787/9789264201132-en.
OECD (2011), Tackling the Policy Challenges of Migration: Regulation, Integration, Development, Development Centre Studies, OECD Publishing, Paris, https://doi.org/10.1787/9789264126398-en.
OECD/ILO (2017a), How Immigrants Contribute to Kyrgyzstan’s Economy, OECD Publishing, Paris, https://doi.org/10.1787/9789264287303-en.
OECD/ILO (2017b), How Immigrants Contribute to Thailand’s Economy, OECD Publishing, Paris, https://doi.org/10.1787/9789264287747-en.
OECD/ILO (forthcoming a), How Immigrants Contribute to Argentina’s Economy, OECD Publishing, Paris.
OECD/ILO (forthcoming b), How Immigrants Contribute to Costa Rica’s Economy, OECD Publishing, Paris.
OECD/ILO (forthcoming c), Comment les immigrés contribuent à l’économie de la Côte d’Ivoire, Éditions OCDE, Paris.
OECD/ILO (forthcoming d), How Immigrants Contribute to the Dominican Republic’s Economy, OECD Publishing, Paris.
OECD/ILO (forthcoming e), How Immigrants Contribute to Ghana’s Economy, OECD Publishing, Paris.
OECD/ILO (forthcoming f), How Immigrants Contribute to Nepal’s Economy, OECD Publishing, Paris.
OECD/ILO (forthcoming g), How Immigrants Contribute to Rwanda’s Economy, OECD Publishing, Paris.
OECD/ILO (forthcoming h), How Immigrants Contribute to South Africa’s Economy, OECD Publishing, Paris.
OHCHR (undated), Status of Ratification Interactive Dashboard, http://indicators.ohchr.org/.
Olmos Giupponi, M. B. (2017), Rethinking Free Trade, Economic Integration and Human Rights in the Americas, Hart Publishing. https://www.bloomsbury.com/au/rethinking-free-trade-economic-integration-and-human-rights-in-the-americas-9781849467445/
Organization of American States (2015), International Migration in the Americas: Third Report of the Continuous Reporting System on International Migration in the Americas (SICREMI) 2015, Organization of American States, Washington, DC, www.oas.org/docs/publications/sicremi-2015-english.pdf.
Ortega, F. and G. Peri (2012), “The effect of income and immigration policies on international migration”, National Bureau of Economic Research, NBER Working Paper 18322, www.nber.org/papers/w18322.pdf.
Philippines Institute of Development Studies (2012), “Enhancing the protection and promotion of migrant workers’ rights in ASEAN, Different streams, different needs and different impacts: Managing International Labor Migration in ASEAN”, Policy Brief No. 5.
Roberto Perez, C. (2013), El Mercado Centroamericano de trabajo como un bien público regional en el marco del proceso de integración social del sistema de integración centroamericana (SICA), ECLAC, Sede Subregional en México, Mexico D.F. http://repositorio.cepal.org/bitstream/handle/11362/26127/1/M20130015_es.pdf
Siciliano, A. L. (2013), “Is there a migration policy for regional integration in South America? Emerging evidence from Mercosur”, submitted for Oxford Migration Studies Society Migration: Theory and Practice 2013 Conference, www.academia.edu/3264163/IS_THERE_A_MIGRATION_POLICY_FOR_REGIONAL_INTEGRATION_IN_SOUTH_AMERICA_EMERGING_EVIDENCE_FROM_MERCOSUR.
Timmer, C. P. (2009), A World without Agriculture: The Structural Transformation in Historical Perspective, American Enterprise Institute, Washington, DC.
The PRS Group (undated), International Country Risk Guide, http://epub.prsgroup.com/products/international-country-risk-guide-icrg
United Nations (2015), Trends in International Migrant Stock: The 2015 Revision, United Nations Department of Economic and Social Affairs, Population Division, New York, http://www.un.org/en/development/desa/population/migration/data/estimates2/estimates15.shtml.
WHO (2012), Areas of Work: Border Health and Migrant Program – Non-Thai Migrant Population, World Health Organization, Country Office for Thailand, Bangkok.
World Bank (2017), World Development Indicators, https://data.worldbank.org/.
World Bank (2016a), Migration and Remittances Factbook 2016, Third Edition, Washington, DC, https://openknowledge.worldbank.org/bitstream/handle/10986/23743/9781464803192.pdf?sequence=3&isAllowed=y2016.
World Bank (2016b), The Worldwide Governance Indicators, https://data.worldbank.org/data-catalog/worldwide-governance-indicators
World Bank (undated), Enterprise Surveys, http://wwww.enterprisesurveys.org/data/exploretopics/informality/
Notes
← 1. This estimation is based on the United Nation’s 2015 international migrant stock at mid-year by country (United Nations, 2015) and the World Bank’s 2015 country classification by income level. United Nations (2015) reports 29% using the 2014 classification. The difference comes from the change of classification between 2014 and 2015. For example, Argentina, Russia and Venezuela became upper-middle-income countries in 2015 while they were high-income countries in 2014.
← 2. This means that 55% of immigrants from developing countries were living in a high-income country in 1990 and 69% in 2013. These estimations are based on the World Bank data on Global Bilateral Migration 1990 and 2013, using World Bank’s country classification by income level in 1990 and 2013 respectively.
← 3. Strictly speaking returned exiles are not international immigrants, but their reintegration into the Rwandan society has posed challenges similar to the integration of international immigrants into national labour markets. They also brought skills back into the country.
← 4. The SIGI measures countries’ performance on gender inequality related to social institutions. It is composed of five sub-indices: discriminatory family code, restricted physical integrity, son bias, restricted resources and assets, and restricted civil liberties. The index assesses laws, social norms and practices that prevent women from having same access to justice, empowerment opportunities and resources as men (OECD, 2014b).
← 5. https://www.theguardian.com/world/2011/dec/22/argentina-open-doors-migrants-settle.
← 6. By law, workers have the right to redress if there is any violation in their employment contract but this is not enforced in practice.
← 7. Thailand extended the work permits of registered immigrant workers whose term expired in 2007 or 2008. The amnesty policy was continued in 2011-14 mostly for immigrants from Cambodia, the Lao People’s Democratic Republic and Myanmar.
← 8. http://countryoffice.unfpa.org/dominicanrepublic/drive/AnalisisSaludPoblacionExtranjera.pdf.
← 9. “Nepalese origin” (without a clear definition) and “ability to speak and write Nepali” were made pre-requisites for acquiring citizenship during the reign of absolute monarchy in Nepal (1960-90). Specifically, Clause (a) of Article 8, Section 2 of the 1962 Constitution requires 2 years of residence for a person of “Nepali origin” and a minimum 12 years of residence for a person of “non-Nepali origin”. Oral and written skills in the Nepali language were made mandatory for a person to acquire citizenship.
← 10. Jus sanguinis in this case refers to citizenship granted by descent rather than by being born in the country’s territory (jus soli).