Chapter 1. Korea’s economic and labour market situation
This chapter provides a concise overview of labour market trends and challenges in Korea. It describes how Korea’s vast economic and social development has shaped its labour market over the past five decades. The analysis highlights Korea’s predominance of micro-enterprises with low productivity; widespread culture of subcontracting practices; high incidence of non-regular work; and the impact of these phenomena on labour market dualities and ongoing weaknesses around job quality and labour market inclusiveness. The chapter also discusses the challenges vulnerable groups – particularly women, youth and older workers – face within the labour market.
The statistical data for Israel are supplied by and under the responsibility of the relevant Israeli authorities. The use of such data by the OECD is without prejudice to the status of the Golan Heights, East Jerusalem and Israeli settlements in the West Bank under the terms of international law.
Economic and labour market development in Korea
Economic growth and remaining challenges
Korea has made tremendous progress over the past five decades. Overcoming extreme poverty and destruction during the Korean War of the early-1950s, Korea became the world’s 12th largest economy and the 7th largest exporter in 2015. Real economic growth in Korea has somewhat slowed down over this time, though it was the highest of any OECD country for long periods of time during the 1970s, 1980s and early-1990s and still remains higher than the OECD average (Figure 1.1, Panel A). Per capita income rose from 15.3% of the OECD average in 1970 (controlling for purchasing power parities) to 61.5% in 1996 – the year Korea joined the OECD. By 2016, this figure had risen to 91.9%, placing Korea 19th from the top among the 35 OECD countries (Figure 1.1, Panel B).
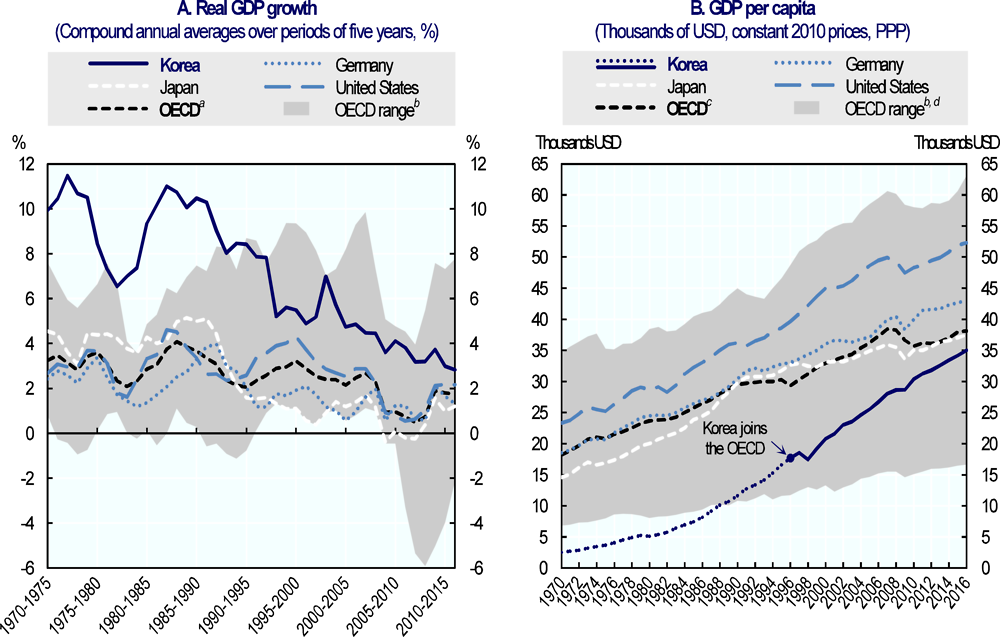
Note: GDP: Gross domestic product. PPP: Purchasing power parity.
a. Weighted average of the 35 OECD countries.
b. Shaded area highlights the minimum and maximum values of OECD countries (excluding Korea).
c. Maximum figure excludes Luxembourg, which attained a GDP per capita of USD 90 600 in 2016.
d. Unweighted average of OECD countries, excluding non-members in any given year.
Source: OECD Annual National Accounts Database, Main Aggregates, “Table 1. Gross domestic product (GDP), Gross domestic product (annual)” [Variable VOB: Constant prices, OECD base year, National currencies, 2010 (expenditure approach)] for Panel A, http://stats.oecd.org/index.aspx?queryid=9185 (accessed on 29 September 2017); and Main Aggregates, “Table 1. Gross domestic product (GDP): GDP per head, US $, constant prices, constant PPPs, reference year 2010” [Variable Gross domestic product (expenditure approach)] for Panel B, http://stats.oecd.org/index.aspx?queryid=60707 (accessed on 29 September 2017).
Korea’s economic growth has also entailed significant social progress. Health and education outcomes have improved especially fast. Life expectancy at birth in Korea rose by 23.5 years between 1970 and 2014 – the largest increase in the OECD countries. Korea’s population has become more educated with 45% of persons aged 25-64 having completed tertiary education in 2015 – considerably higher than the OECD average of 35%.
Such a rapid process of economic development over the past five decades has shaped Korea’s industrial and labour market characteristics. During the 1960s, industrialisation was driven by an export-led growth strategy that attracted the most productive resources into the manufacturing sector. Manufacturing enjoyed a number of advantages including a devalued currency and various fiscal incentives. Following a decade of unprecedented economic growth, the government decided in 1973 to shift from general export promotion towards a more targeted approach focusing on heavier industries and chemicals manufacturing. This enabled Korean exports to maintain strong growth despite increased competition for light manufactures from other emerging economies. This broad strategy led to the development of a highly competitive manufacturing sector in Korea, dominated by large firms, alongside a relatively less productive services sector dominated by small and medium-sized enterprises (SMEs) (OECD, 1994[1]).
Starting in around the early 1990s, Korea began to face still greater competition from emerging economies – and China, in particular – coupled with rising wages at home. In response, large firms began to outsource various production processes to lower-cost SMEs in order to boost price competitiveness and refocus internal processes on technology-intensive, higher value-added tasks. The Asian Economic Crisis of 1997 further accelerated the subcontracting processes and enlarged the wage gap between SMEs and larger enterprises (Kim, 2015[2]).
Today, Korea’s export-led economy competes not only with emerging East and South-east Asian rivals but also with more advanced economies in higher-end markets. Domestic demand, on the other hand, is constrained by structural factors. Household debt, for example, has risen steadily in Korea from 40% of GDP in 1990 to around 90% by 2016. Stagnant productivity within the services sector and struggling SMEs have also weakened domestic demand in Korea (Zoli, 2017[3]).
Figure 1.2 shows that Korean companies with fewer than 300 employees accounted for larger shares of non-agricultural employment than anywhere else in the OECD. While SMEs accounted for a relatively common 45% of total value-added in manufacturing, they accounted for a much higher 85% among services sectors – by far the highest of any OECD country – in 2013. The overabundance of SMEs in Korea’s services sector has contributed to their low productivity and, ultimately, to low job quality. Addressing this could bring not only economic gains but also strengthen social outcomes in Korea.
Labour market trends and remaining challenges
Korea’s labour market has also undergone profound changes during the past five decades. Starting from a relative abundance of low-skill, rural self-employment, Korea’s population now engages in much more highly-skilled work dominated by industry and services. The share of Korean workers employed in agriculture, forestry and fishery declined from 63% in 1963 to 5.2% in 2015. Meanwhile, the share of workers in the services sector including construction and SOC increased from 28.3% to 77.5%. The share of those employed in mining and manufacturing reached a peak at 28.5% in 1988, gradually declining ever since to 17.3% by 2015, in line with other OECD countries.
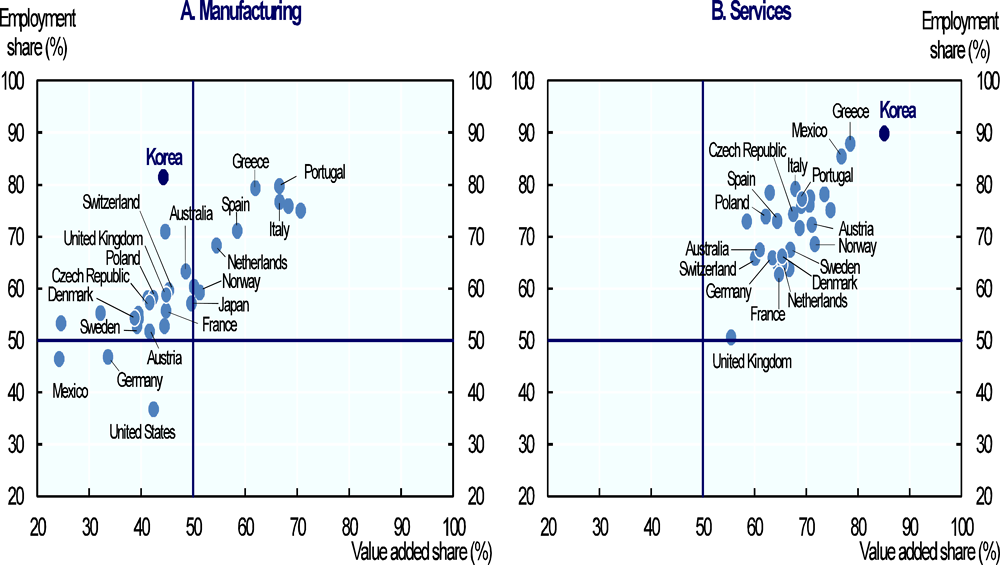
Note: SMEs include firms with 1-249 employees (1-200 for Australia, and 1-300 for Canada, Japan and Korea). Data cover the business economy, excluding financial intermediation. Value-added data refer to value added at factor costs in European countries and value added at basic prices for non-European OECD countries. Data for Canada, Israel, Japan, Korea, Switzerland and the United States exclude own-account workers. Data for Korea and Mexico refer to establishments. Data for the United Kingdom exclude an estimated 2.6 million small unregistered businesses. Data are for 2013 except Ireland (2011); Japan (2012); and Canada, Israel, Korea and Mexico (2014).
Source: OECD Structural and Demographic Business Statistics (SDBS) Database, https://doi.org/10.1787/sdbs-data-en.
The employment rate among those aged 15-64 has risen steadily in Korea over the past two decades from 57% in 1986 to 66.3% in 2016 – just a fraction below the OECD average of 67% (Figure 1.3, Panel A). Better mobilising under-utilised labour resources, especially of women and youth, will be critical not only to increase overall employment, but also to mitigate the difficult economic transition population ageing will be likely to require in the coming decades.
Rapid economic growth reduced the unemployment rate in Korea from 8% in the early 1960s to roughly 2-4% from around the late-1980s to the present day (except for a brief spike that reached 7% at the height of the Asian Economic Crisis). More recently, Korea’s labour market has proven to be particularly resilient in the wake of the Global Financial Crisis compared with many other OECD countries (Figure 1.3, Panel B).
A unique characteristic of the Korean labour market is the very low incidence of long-term unemployment. The share of those unemployed for 12 months or longer was only 0.9% in Korea in 2016, compared with an OECD average of 30.5% (Figure 1.3, Panel C). The fact that so many jobseekers move back into work relatively quickly in Korea partly reflects a positive range of opportunities workers find. Nevertheless, at least part of the underlying reason Korea has such low long-term unemployment has to do with a lack of income support for unemployment, which leaves many jobseekers with no alternative other than to settle for a job as quickly as possible, regardless of its quality or the career prospects it might offer. Another underlying reason is that many jobseekers ultimately leave unemployment within the first year by exiting the labour force altogether – and, hence, enter a period of inactivity rather than employment (OECD, 2013[4]).
High rates of inactivity remain a key challenge for Korea’s labour market. At 31.3% in 2016, Korea’s inactivity rate was some three percentage points above the OECD average – about one percentage point above for men and five points for women (Figure 1.3, Panel D).
although inactivity remains high
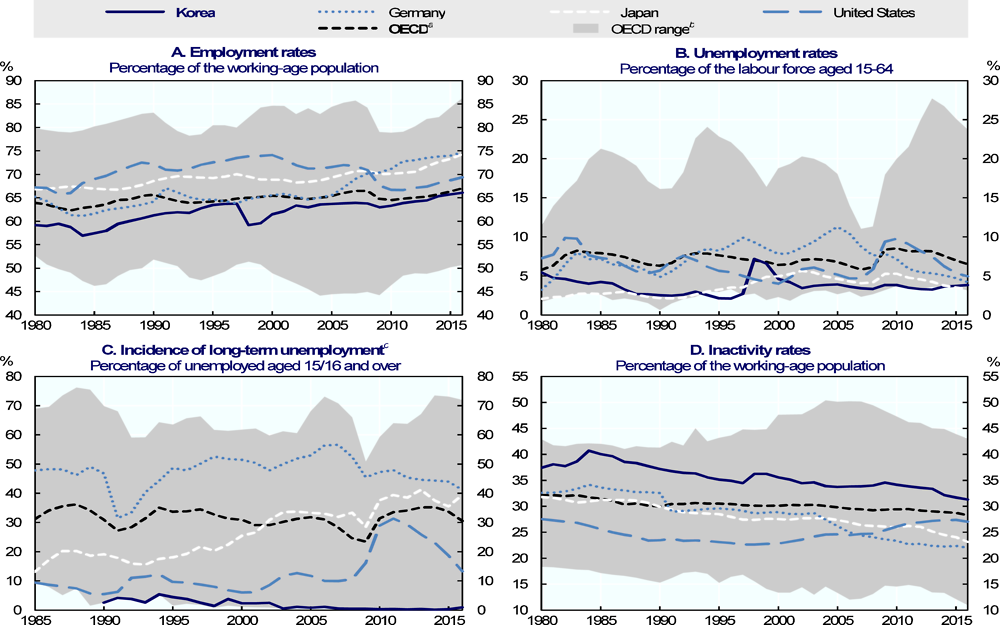
a. Weighted average of OECD countries.
b. Shaded area highlights the minimum and maximum values of OECD countries (excluding Korea).
c. Data refer to people unemployed for 12 months and more.
Source: OECD Employment Database, www.oecd.org/employment/database.
Labour market structure
Perhaps the most distinctive characteristic of Korea’s labour market is the combination of a high share of self-employment and the over-representation of non-regular workers in very small firms that are relatively unstable and unproductive. Such features of the labour market exacerbate labour market dualities and earnings inequality among different groups of workers in Korea.
Figure 1.4 shows a comprehensive breakdown of Korea’s total employment by status in employment. In 2016, 26.0% of Korea’s total employed population were engaged as non-salaried workers: 15.5% of them working on their own account; 6.0% as employers; and 4.5% as unpaid family workers. Of the remaining 74.0% of total employment, around one-third were engaged as non-regular salaried workers: 8.4% of them on non-typical employment contracts; 9.4% working for 35 hours per week or less; and 13.8% engaged on a non-permanent basis.
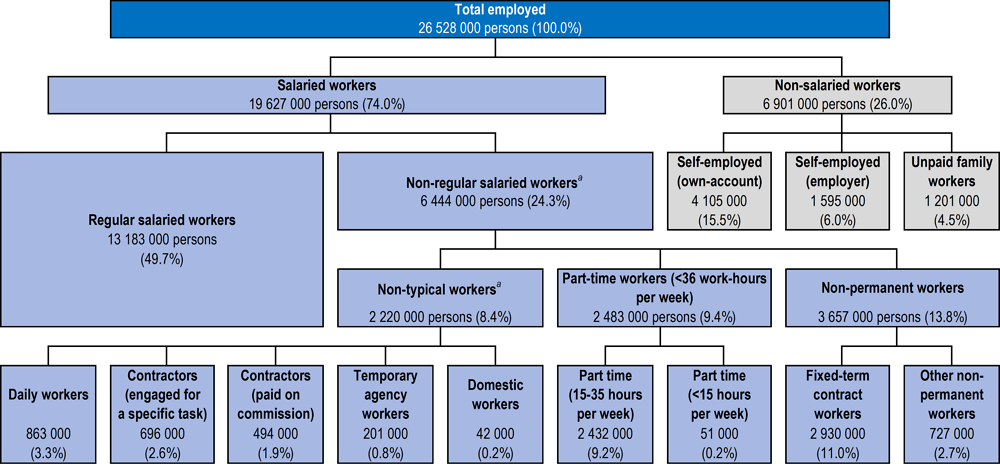
Note: Data include all workers (in both public and private enterprises) aged 15 and above. Numbers in parentheses give the relevant share of the total employed population.
a. Total numbers of “non-regular salaried workers” and “non-typical workers” are smaller than the sum of their consistent parts, due to some overlap in the sub-categories provided.
Source: Statistics Korea (2017), Economically Active Population Survey, August 2016.
Such a diverse labour market in Korea entails a number of important dualities that often result in very divergent outcomes for individuals around job quality, earnings and social protection. The remainder of this sub-section evaluates some of the main characteristics and trends that some of Korea’s key dualities entail.
Dualities between salaried and non-salaried workers
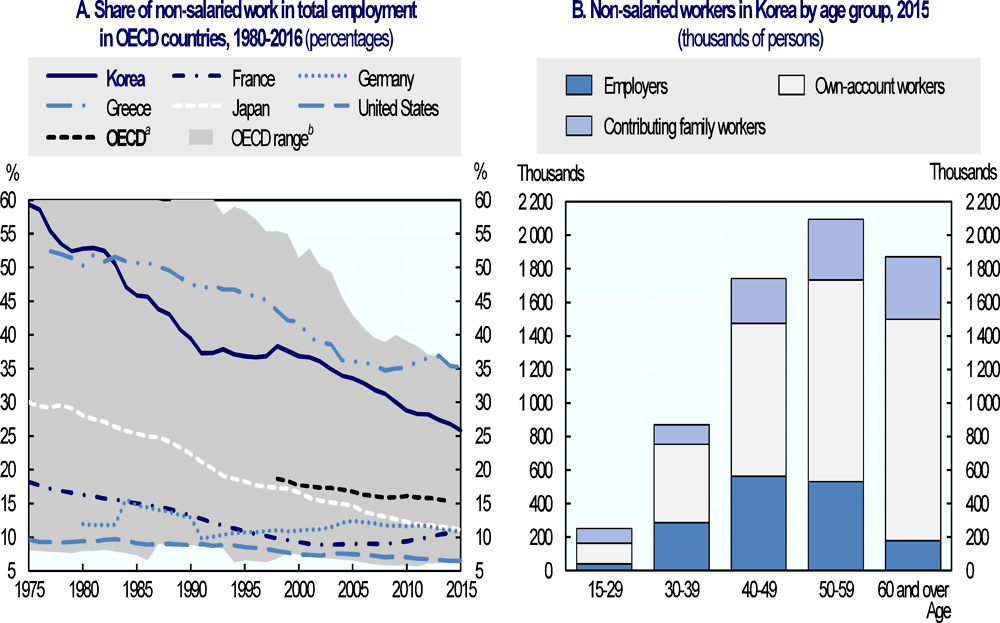
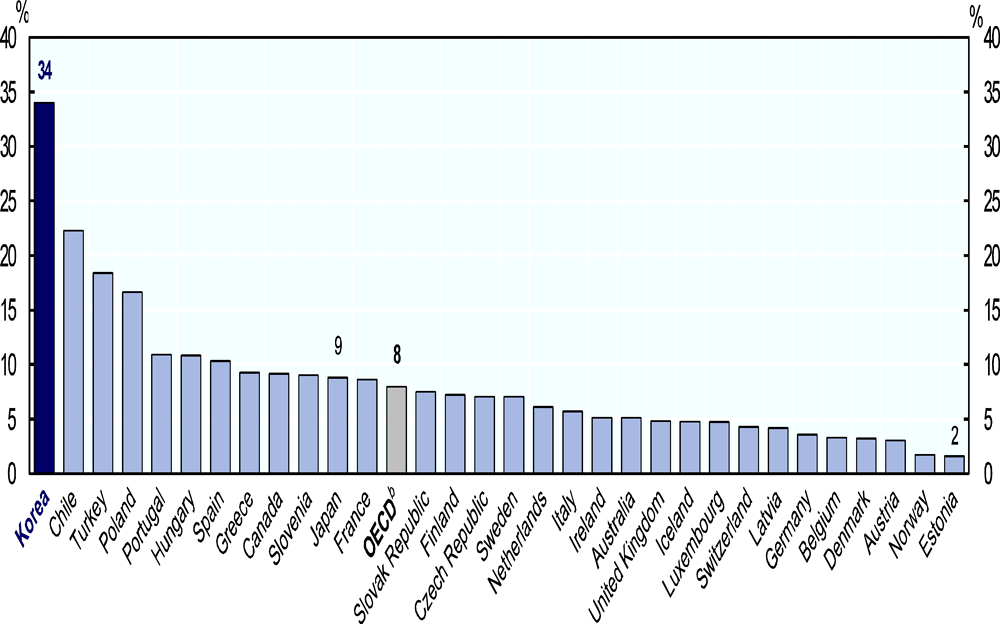
The Korean economy has yet to develop sufficiently enough to absorb its large number of non-salaried workers into more regular salaried employment. An abundance of non-salaried workers in Korea – including own-account workers, employers and contributing family workers – has emerged in tandem with the proliferation of micro-enterprises. The share of non-salaried workers in Korea’s total employment fell from 61.0% in 1970 to 25.5% by 2016. This remains much higher than the OECD weighted average of 15.3% in 2015 (Figure 1.5, Panel A).
The widespread practice of early retirement from the main job around the age of 45-50 also contributes to the abundance of micro-enterprises in Korea. Many middle-aged and elderly workers in Korea become self-employed upon reaching a mandatory age of retirement with their employer (or taking a form of early-retirement commonly known as “honorary retirement”). According to the Economically Active Population Survey, 54.3% of business-owners in Korea were previous salaried workers; 24.0% non-salaried workers; and 21.7% previously non-employed in 2015. The self-employed aged 50 years or more accounted for 62.8% of total self-employment in Korea in 2015 (Figure 1.5, Panel B).
Note: Self-employment includes own-account workers, employers, members of producers’ co-operatives, and unpaid family workers. Data for Germany are interpolated for the years 1984-90.
a. Weighted average of OECD countries.
b. Shaded area highlights the minimum and maximum values of OECD countries (excluding Korea).
Source: OECD (2017), “Labour Force Statistics: Summary tables”, OECD Employment and Labour Market Statistics (database), https://doi.org/10.1787/data-00286-en, Self-employment rate (indicator), https://doi.org/10.1787/fb58715e-en (accessed on 16 May 2017) for Panel A; and Statistics Korea (2015), “Additional Economically Active Population Survey for Non-wage Workers”, Korean Statistical Information Services for Panel B.
Dualities between regular and non-regular workers
Korea’s labour market displays some clear and very strong dualities. The clearest manifestation of labour market duality in Korea is the high prevalence of non-regular workers who account for a little over one-third of all salaried workers. Non-regular workers’ pay and working conditions are considerably less attractive than those of regular salaried workers (Table 1.1). While the share of non-regular employment has remained quite stable since 2003 at around 32-36%, those among them who work part-time increased quite substantially from 19.0% to 38.5% between 2005 and 2016.
Labour market duality is also a major cause of income inequality in Korea. In 2016, non-regular workers were paid 34.6% less per hour than regular salaried workers, even though their skills are broadly the same (OECD, 2015[5]). The wage gap between regular and non-regular salaried workers has gradually increased since the early 2000s and mobility between the two is very low. International comparisons show that temporary workers in Korea appear to be more at risk of becoming trapped in temporary employment or becoming unemployed than their counterparts in other OECD countries (OECD, 2013[6]).
Interactions between non-regular work and small firm size
Non-regular work in Korea is largely concentrated in micro-enterprises with relatively low productivity. Indeed, 48.7% of non-regular workers are employed in micro-enterprises with fewer than 10 employees and 72.1% of them in small firms with fewer than 30 employees. Since the incidence of non-regular work is much higher in micro-enterprises and those within the services sector (Table 1.2), there is considerable overlap between the two forms of labour market duality (OECD, 2013[6]).
Larger firms in Korea often prefer subcontracting out work to SMEs than hiring non-regular workers directly. This enables them to maintain low labour costs while enhancing business flexibility. Micro-enterprises, on the other hand, are more likely to hire non-regular workers to reduce their labour costs since subcontracting is usually not a viable option. The fact that nearly half of all non-regular workers in Korea are concentrated in micro-enterprises makes it more difficult for workers to build their way up into more secure, better-paid jobs in larger firms.
The concentration of non-regular workers in small enterprises is a major source of earnings inequality in Korea (Figure 1.6). Average wage levels are much higher among larger enterprises for both regular and non-regular workers, with the impact of firm size being somewhat stronger for non-regular workers (OECD, 2013[6]).
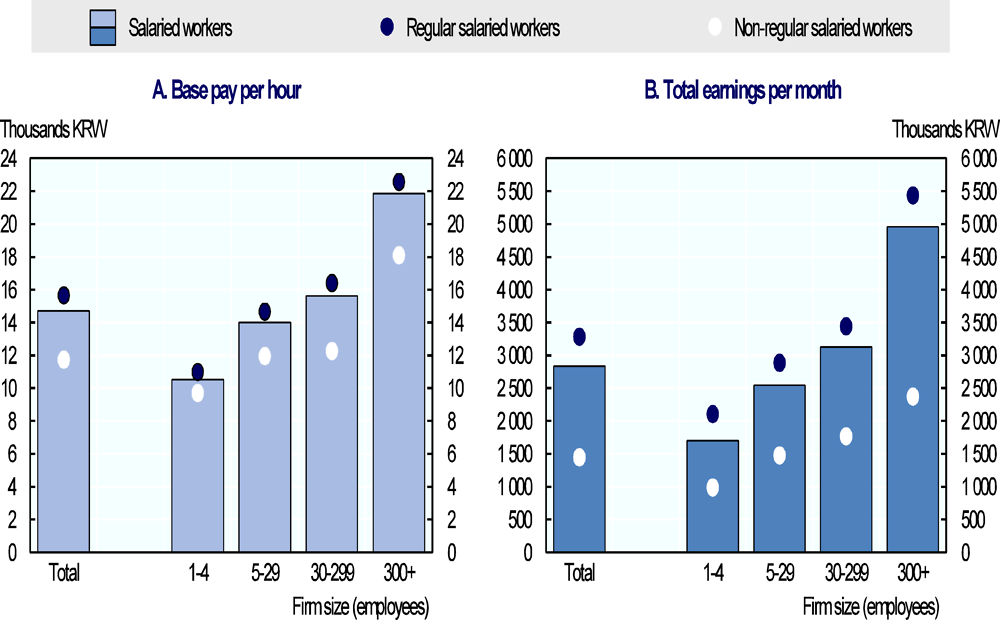
Source: OECD estimates using MOEL (2017), Survey Report on Labor Conditions by Employment Type, http://laborstat.molab.go.kr/newOut/renewal/menu05/menu05_search_popup.jsp, Table “Age, Days, Hours, Payments, Workers by Size, Education, Age”.
Indeed, the gap between the wages paid by SMEs and those paid by larger firms is considerable in Korea and has increased continuously over time. Average waged in firms of different sizes were relatively similar during the 1980s, with workers in medium-sized enterprises of 10-39 workers earning within 90%, on average, of what those in the largest enterprises of 300 or more workers were paid. Average wage levels diverged rapidly after that, creating considerable discrepancies among firms of different sizes (Figure 1.7).
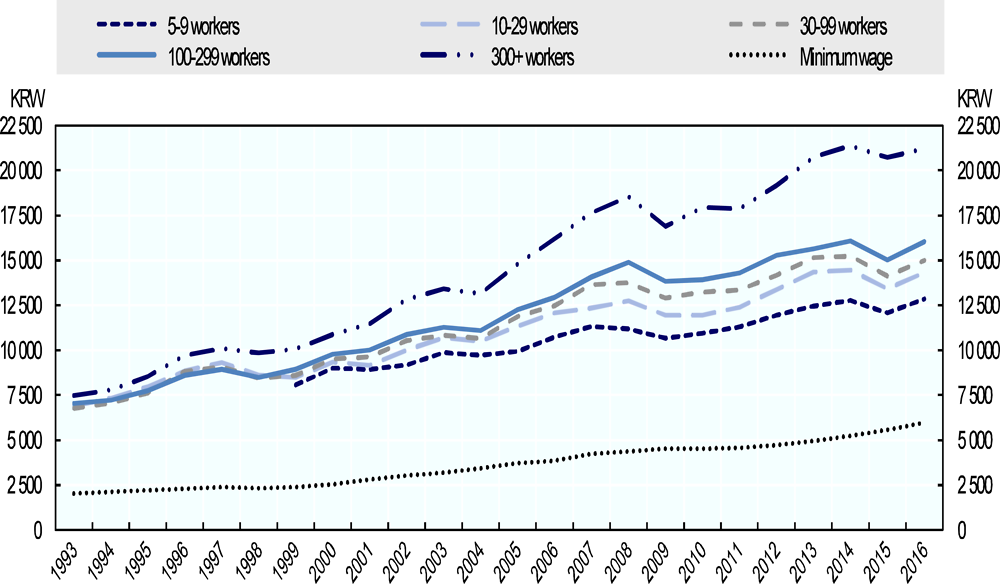
Note: Data refer to real average base pay per regular hour worked in 2015 prices. Data have been deflated using the KOSIS consumer price index (2015 = 100).
Source: Ministry of Employment and Labor, Survey Report on Labour Conditions by Employment Type, http://laborstat.molab.go.kr/newOut/renewal/menu05/menu05_search_popup.jsp, Table “Age, Days, Hours, Payments, Workers by Size, Education, Age”.
The combination of firm size and status in employment also results in an elevated incidence of low-paid work in Korea – making it the third highest OECD country after the United States and Ireland. Korea also has one of the highest overall ratios between the top and bottom earnings deciles, third only to the United States and Israel (Figure 1.8).
and earnings inequality is higher
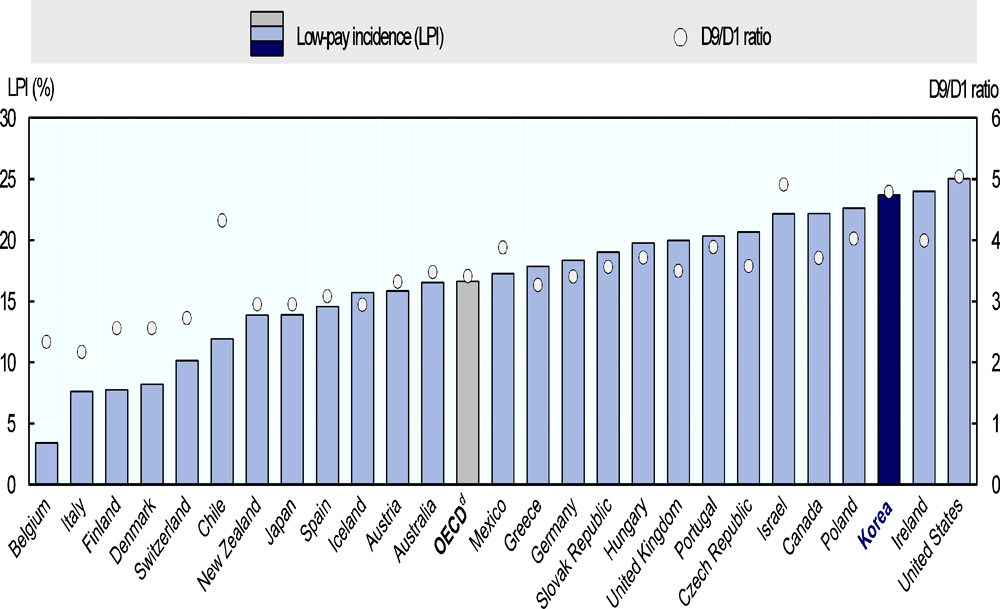
a. The incidence of low pay refers to the share of workers earning less than two-thirds of median earnings.
b. Earnings dispersion is measured by the ratio of 9th to 1st deciles limits of earnings.
c. Data refer to 2015 except: Israel (2011); Spain (2012); and Australia, Belgium, Germany, Greece, Iceland, Italy, Japan, Korea, New Zealand, Poland, Portugal and Switzerland (2014).
d. Unweighted average of the countries shown.
Source: OECD Earnings Distribution Database, www.oecd.org/employment/emp/employmentdatabase-earningsandwages.htm.
Further dualities between smaller and larger firms
Only 13.6% of workers in Korea were employed in large firms with 300 or more employees in 2014. On the other hand, 41.3% of employees work in micro-enterprises (i.e. those with fewer than 10 employees). Work in such enterprises can often be characterised by low wages; a precarious employment status; large gaps in social insurance coverage; and a near-total absence of trade unions (Figure 1.9).
Large firms in Korea used to employ a much larger share of workers before the 1990s – especially in manufacturing. Faced with increasing competition for exports and domestic market liberalization, however, large firms began to boost competitiveness through increasingly low-cost outsourcing. To meet this new demand, medium-sized enterprises also began passing on production processes to yet smaller-scale companies paying still lower wages (Kim, 2015[2]). Such a downward spiral spread widely through the manufacturing sectors and eventually into services sectors.
In 1993, establishments with 300 or more employees accounted for 22.6% of total employment in Korea (34.4% in the manufacturing sector). The share declined rapidly to 12.0% in 2000 before increasing slightly to 13.6% by 2014 (Figure 1.10, Panel A). Conversely, the share of employment among companies with 1-9 and 10-19 employees gradually increased from 37.3% and 8.4% in 1993, respectively, to 41.3% and 10.7% by 2014. Meanwhile, the overall share of employment among medium-sized companies has remained almost entirely flat. These sorts of firm dynamics in Korea stimulated an increase in the number of small companies offering very low pay. Figure 1.10, Panel B, shows the change in the number of companies over the past two decades for each category of firm size. Increases were observed primarily among small companies.
than in other OECD countries
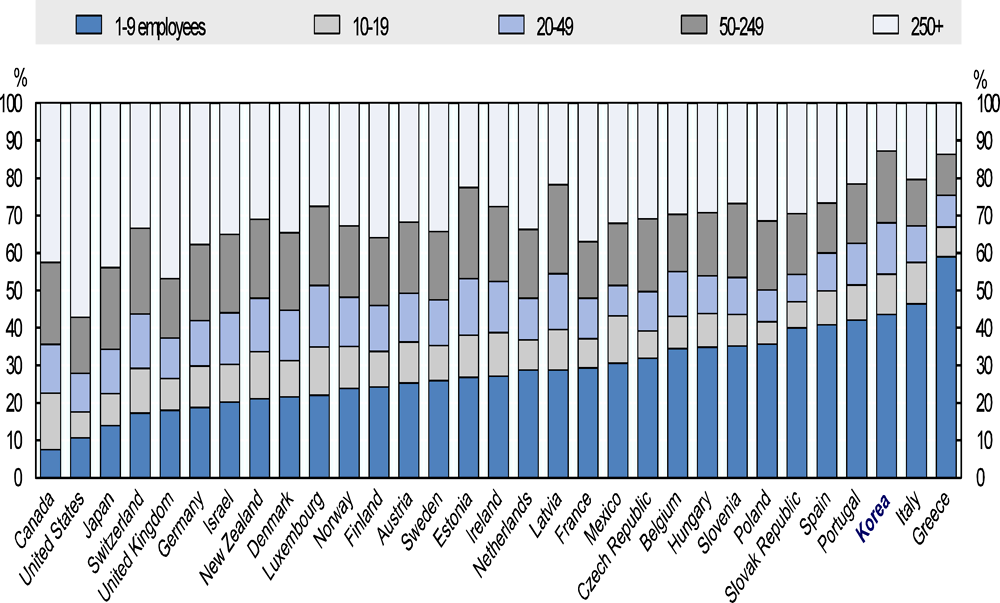
Note: Data cover the business economy, excluding financial intermediation. Firm size breakdowns differ slightly in the following exceptional cases: Canada has four categories referring to 1-4, 5-19, 50-299, and 300+; Japan and Korea have a slightly higher cut-off reference between the two largest categories (50-299 and 300+). Data do not include non-employers for Canada, Israel, Japan, Korea, Switzerland and the United States. Data refer to establishments for Korea and Mexico, which counts branches of a business as establishments and tends to show a relatively higher employment share of SMEs. Data for the United Kingdom exclude an estimate of 2.6 million small unregistered businesses.
Data refer to 2013 except: Ireland (2011); Japan (2012) and Canada, Israel, Korea and Mexico (2014).
Source: OECD Structural and Demographic Business Statistics (SDBS) Database, https://doi.org/10.1787/sdbs-data-en.
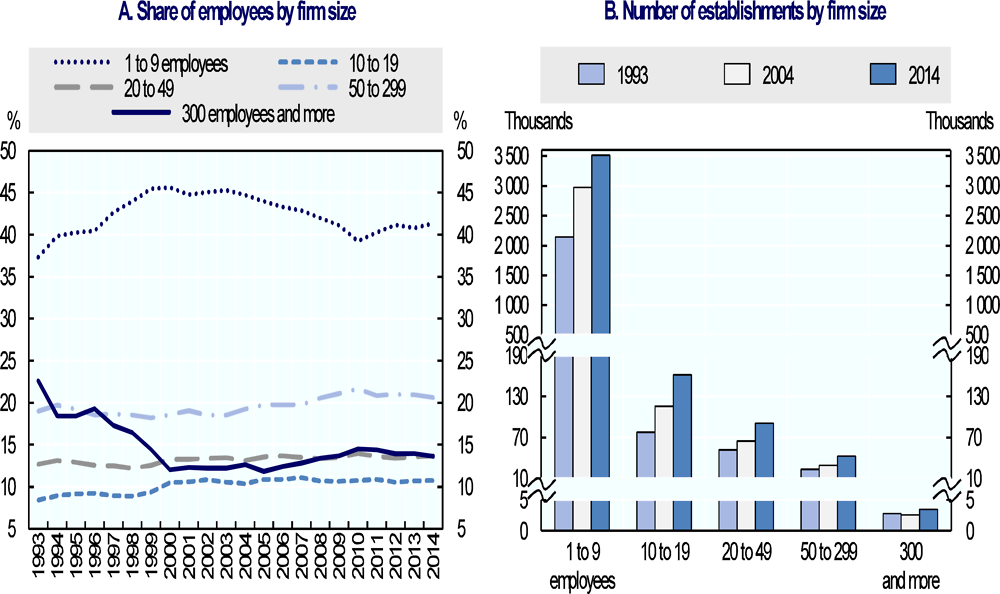
Source: Statistics Korea, Census on Establishments, 2015.
Most start-up enterprises in Korea emerge with extremely small funds: in 2015, 30.4% started out with less than KRW 5 million and a further 19.9% with KRW 5-20 million. Widespread self-employment coupled with limited business experience and small start-up funds largely explain the sharp drop of the survival rate after one or two years in manufacturing in Korea (Figure 1.11). Such instability also leads to the precarious employment conditions they offer workers.
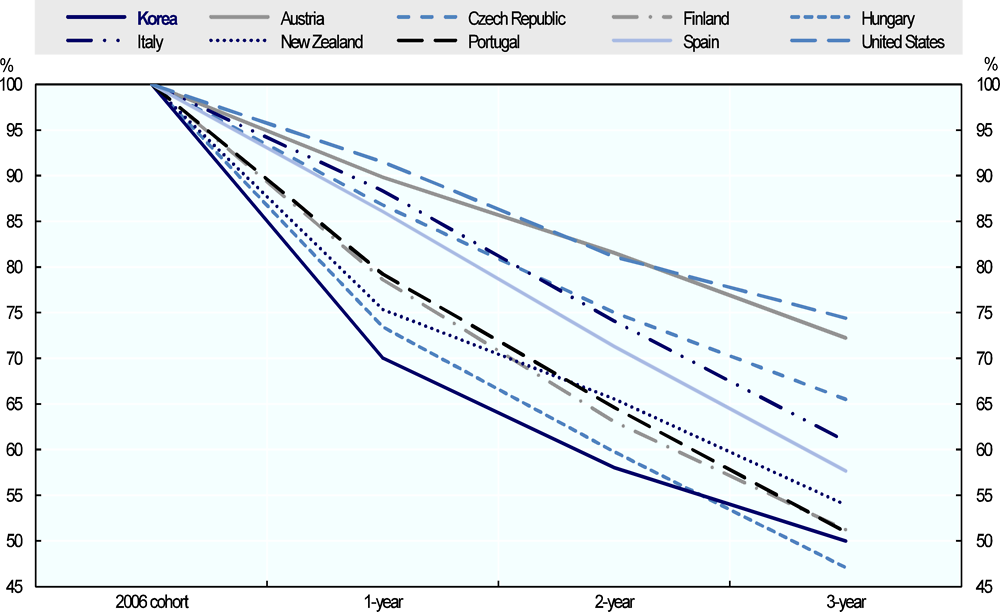
Note: The employer enterprise survival rate measures the number of enterprises of a specific birth cohort that have survived over different years. The n-year survival rate for a reference year t gives the number of n-year survival enterprises as a share of all enterprises registered for the first time in year t-n.
Source: OECD Structural and Demographic Business Statistics Database, SDBS Business Demography Indicators (ISIC Rev. 3): Employer enterprise survival rates, http://stats.oecd.org/Index.aspx?DataSetCode=SSIS_BSC_ISIC4# for Finland, New Zealand, Spain and the United States; and OECD (2013), Entrepreneurship at a Glance, OECD Publishing, https://doi.org/10.1787/entrepreneur_aag-2013-en, Figure 3.21, p. 52, for Austria, the Czech Republic, Hungary, Italy, Korea and Portugal.
The average job tenure of workers in Korea is lower than six years: the lowest of any OECD country and considerably lower than the OECD average of 9.3 years in 2015. In 2015, 30.9% of employees in Korea were in their jobs for shorter than one year – compared with an OECD average of 17.6%.
Employment in Korea is less stable, on average, among smaller firms. 50.7% workers in enterprises (those with fewer than five employees) have job tenure of shorter than one year in 2015, compared with 12% among enterprises with 300 or more employees (Figure 1.12). Such high employment turnover is closely related to the fact that the share of non-permanent employees in total salaried employment is twice as high in Korea as the OECD average, with most such workers concentrated in micro-enterprises. This presents one of the main obstacles towards enlarging social insurance coverage in Korea.
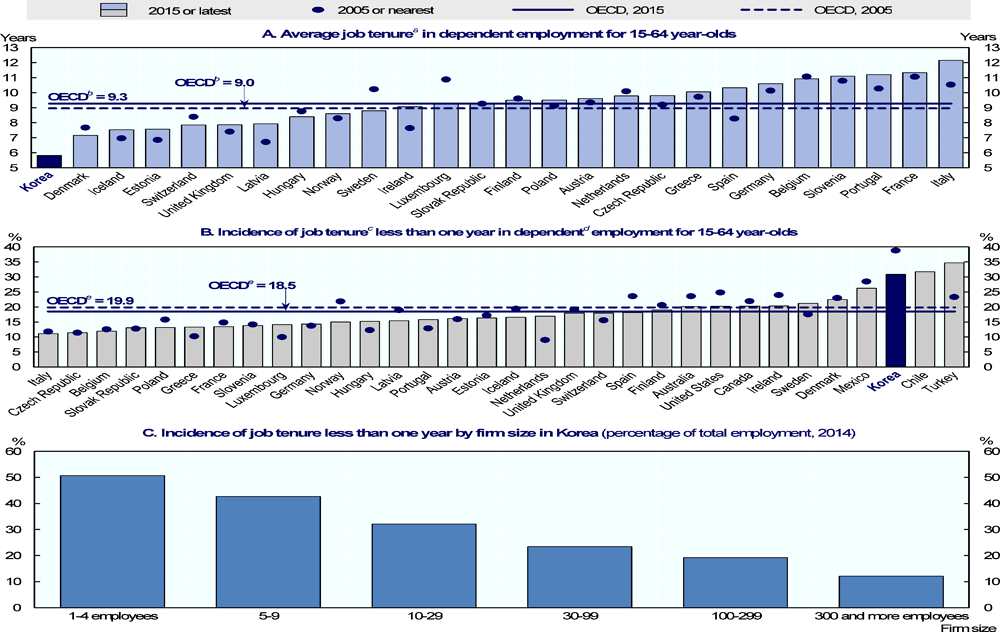
a. Data refer to 2015.
b. Unweighted average of 26 OECD countries (excluding Australia, Canada, Chile, Israel, Japan, Mexico, New Zealand, Turkey and United States).
c. Data refer to 2012 for Japan and 2014 for Austria and the United States.
d. For Japan, data refer to total employment.
e. Weighted average of 32 OECD countries (excluding Israel, Japan and New Zealand).
Source: Statistics Korea, Economically Active Population Survey, 2015 for Panel A. OECD Job Tenure Dataset, a subset of the OECD Employment Database, www.oecd.org/employment/database for Panels B and C.
Trade unions can bring considerable benefits to workers in terms of their wage levels and status in employment. Trade union members in all OECD countries predominantly have a permanent status in employment – with only 11% of them working on a non-permanent basis (OECD, 2017[7]).
Collective bargaining in Korea takes place predominantly at the level of firms. Trade union density varies considerably across firms of different size, ranging from 0.1% in small enterprises with less than 30 employees to 63% in large enterprises with more than 300 employees (Figure 1.13).
and overall union density is relatively low
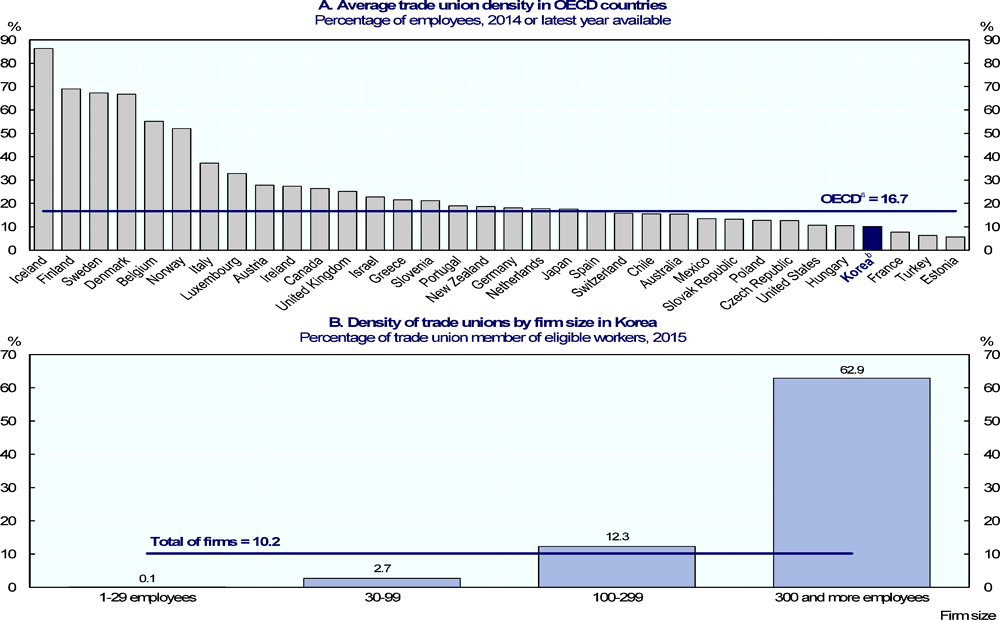
Note: Trade union density corresponds to the ratio of salaried workers that are trade union members, divided by the total number of salaried workers [from the Employment by activities and status Dataset, http://stats.oecd.org/Index.aspx?DataSetCode=ALFS_EMP, a subset of the Annual Labour Force Statistics (ALFS) Database]. Density is calculated using survey data, wherever possible, otherwise through administrative data adjusted for non-active and self-employed members.
a. Weighted average of OECD countries in 2014.
b. For Korea, data refer to 2012.
Source: OECD and J. Visser, ICTWSS Database (Institutional Characteristics of Trade Unions, Wage Setting, State Intervention and Social Pacts, 1960-2010), Version 3.0, www.uva-aias.net for Panel A; and MOEL (2016), “Analysis on trade unions based on data at the local labour offices in 2015” for Panel B.
Furthermore, the Labour Standards Act which is one of the most important laws on the working conditions of employees in Korea applies partially to micro-firms with less than five employees. Most of regulations on dismissal and working hour don't apply to the micro-firms. Employers are allowed to dismiss the employees without justifiable reasons. There are no daily or weekly limits on working hours at the micro-firms and the employers don’t have to additionally pay 50% of the ordinary wages for extended work.
The near-non-existence of trade unions and the somewhat limited application of the Labour Standards Act also contribute to persistently low wages and precariousness of employment in small firms in Korea.
Labour market situation of specific groups
In Korea, three separate groups of workers are particularly affected by low-quality, low-productivity jobs: women, youth and the elderly. Korea has scope to raise employment rates of women – especially during child-rearing ages. Lowering childcare costs and narrowing the gender wage gap could facilitate women’s employment and help more of them move into full-time work. Addressing mismatches between the skills acquired during education and those demanded by firms is a big challenge towards improving employment rates among young people in Korea. Despite a relatively high employment rate among older people in Korea, the problem of low-wage and precarious work arises continually.
Women workers
Despite some improvement in recent years, the employment rate of women aged 15-64 in Korea was only 56.2% in 2016 – almost 20 percentage points below that of men, constituting the fourth-largest gap of any OECD country. Many Korean women currently miss out on a professional career following marriage or childbirth around the age of 30, given the challenges of balancing professional and family duties (Figure 1.14).
according to age shows a pronounced M-shaped curve
(percentage of female, respectively male population in each age group)
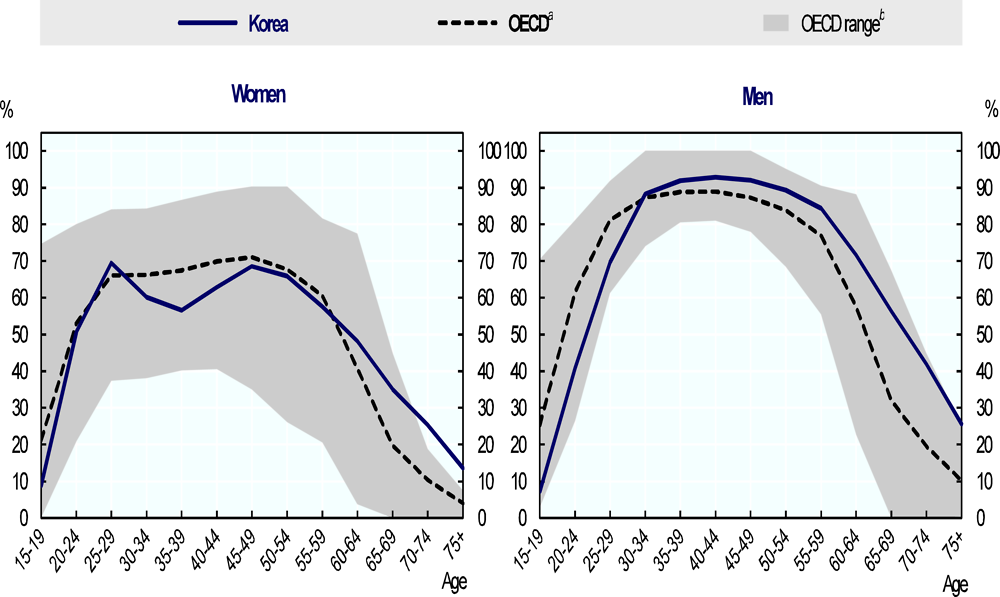
a. Weighted average of OECD countries.
b. Shaded area highlights the minimum and maximum values of OECD countries (excluding Korea).
Source: OECD Employment Database, www.oecd.org/employment/database.
Korean women are more likely than men to work as non-regular employees or be employed in SMEs. While the total share of non-regular employment in Korea is 32.8%, the share among female employees is 41%. Moreover, 23.3% of women in Korea work at very small firms with fewer than five employees, compared with 13.8% of men. These differences contribute to the Korea’s gender wage gap, which is the highest of any OECD country at 37% in 2014 (compared with an OECD average of 15%). The second-longest working hours in the OECD countries and the shortage of high-quality child care options also discourage Korean women from entering or re-entering the labour market following motherhood.
Contrary to any other OECD country, the gender employment gap in Korea is actually higher among the more highly-educated employed population. At 30%, the gender gap in employment is especially large among people with tertiary education – larger than in any other OECD country (Figure 1.15). This is highly inefficient given the high cost of tertiary education and the incredible skilled labour potential lost in this way (OECD, 2015[5]).
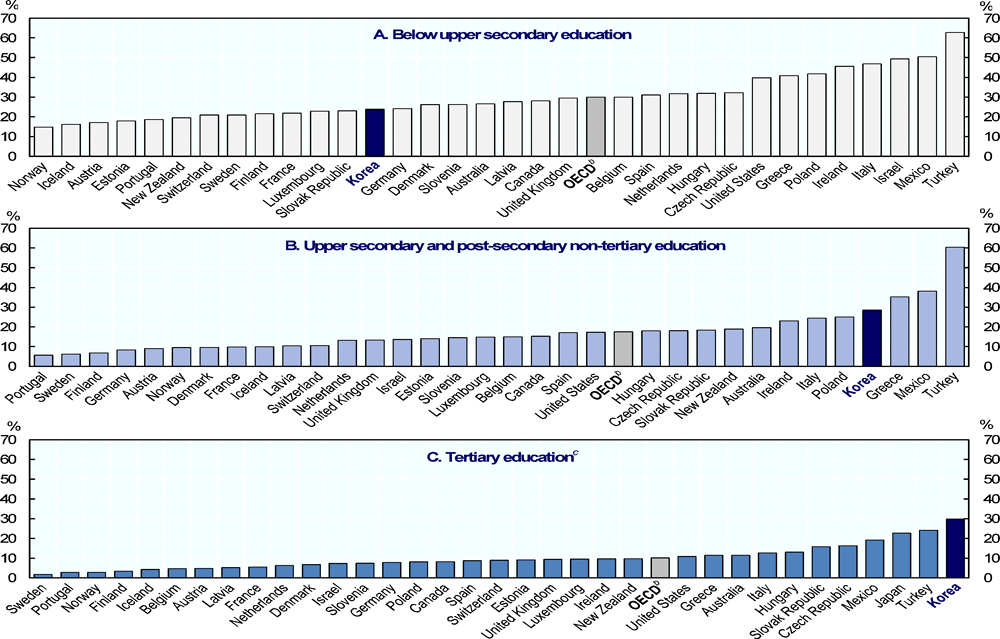
Note: The gender employment gap is calculated as the difference between male and female employment rate as a share of the male employment rate. Data refer to the population aged 25-64.
a. Data refer to 2014 for France.
b. Unweighted average of the 34 OECD countries shown in each panel (excluding Chile).
c. For Japan, data for short-cycle tertiary education and total tertiary education include upper secondary and post-secondary non-tertiary programmes (less than 5% of the adults are under this group).
Source: Educational attainment and labour force status: Employment rates and unemployment rates, by aggregated levels of educational attainment, trends Dataset from the OECD Education at a Glance Database, http://stats.oecd.org/index.aspx?queryid=69473.
Young workers
Korean students achieve excellent educational outcomes: in the 2015 PISA study, 15-year-olds ranked second across OECD countries in mathematics and fifth in both reading and science (OECD, 2016[8]). Virtually all young people, 98%, complete their upper-secondary education, and the share of the population with tertiary education is by far the highest in the OECD.
In spite of these impressive education outcomes, young people in Korea find the transition into work quite challenging: reflected in a low youth employment rate and a high share of young people who are not in employment, education or training (NEETs). The employment rate of youth aged 15-29 was 42.3% in 2016, well below the OECD average of 52.6% (Figure 1.16, Panel A). Korea’s NEETs rate stood at 18% in 2015 and, thus, above the OECD average of 15%. Moreover, the large majority of NEETs in Korea are inactive – 80% of them, compared with 60% elsewhere (Figure 1.16, Panel B).
of youth is inactive
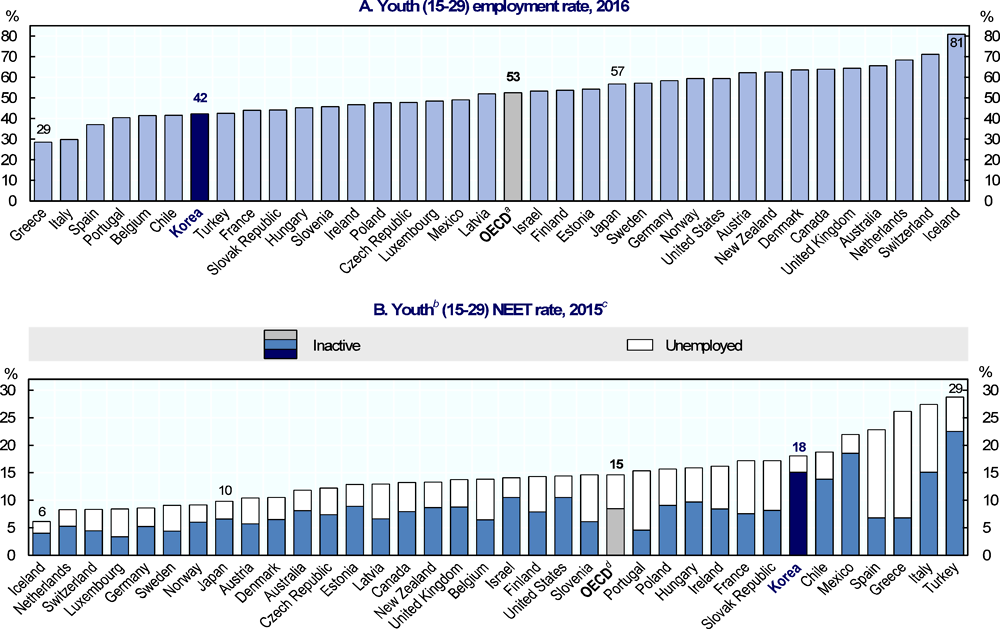
Note: NEET: Not in employment, nor in education or training. Countries are ranked in ascending order of employment rates in Panel A, and of NEET rates (unemployed plus inactive) in Panel B. Figures above the stacked bars refer to the NEET rates in Panel B. Due to the fact that youth in informal educational institution is categorized as NEETs in Korea, there is a tendency for the statistical share of NEETs to become larger values.
a. Weighted average of the 35 OECD countries.
b. Instead of 15-29 year-olds, data refer to 15-24 year-olds for Japan, and to 16-29 year-olds for Spain.
c. Data refer to 2013 for Chile and Korea, and to 2014 for Japan.
d. Unweighted average of the 35 OECD countries.
Source: OECD Employment Database, www.oecd.org/employment/database for employment rates; and OECD, Transition from School to Work Dataset, a dataset from the OECD Education and Training Database, www.oecd.org/education/education-at-a-glance-19991487.htm for NEET rates.
High inactivity rates reflect young people’s response to a strongly segmented labour market. In order to increase their chances of being hired by an attractive, large company or a public-sector employer, many young people in Korea try to acquire additional qualifications and certificates after having completed their studies (OECD, 2016[9]). They are counted as inactive NEETs in the labour market statistics, because such learning activities typically take place outside of the formal education system. Unlike in many other OECD countries, the NEET challenge in Korea may thus not reflect young people’s lack of skills, but rather an inefficient over-education in the face of labour market segmentation. NEET rates in Korea are nearly identical for young people with and without tertiary education, and the relationship between numeracy or literacy and the risk of being NEET is weaker than in most other OECD countries.
Elderly workers
While the employment rate of Korean aged 55-64 was 66% in 2015, well above the OECD average of 58.5%, many of them work in poor quality jobs, which are insecure and lower-paid. Older workers in Korea are strongly over-represented among non-regular workers. About 34% of Korean workers aged 55-64 hold a temporary job, compared with only 8% on average in OECD countries(Figure 1.17). This reflects the common pattern under which regular workers retire at relatively young ages from their career jobs and then commence “second careers” in non-regular jobs or as own-account workers in the highly competitive, low-productivity service sector.
Note: Data refer to dependent employment.
a. Data refer to 2013 for Australia.
b. Weighted average of the 30 OECD countries shown whose data refer to 2015 (i.e. excluding Australia).
Source: OECD Employment Database, www.oecd.org/employment/database.
According to the Supplementary Results of the Economically Active Population Survey for the Elderly in August 2016, the average age of separation from the main job (i.e. the job with the longest duration) for the labour force aged 55-64 was as low as 52 years old for men and 47 years old for women. The strong seniority-based wage system associated with a huge skill gap between younger and older people make businesses reluctant to hire or retain older people as permanent workers (Figure 1.18).
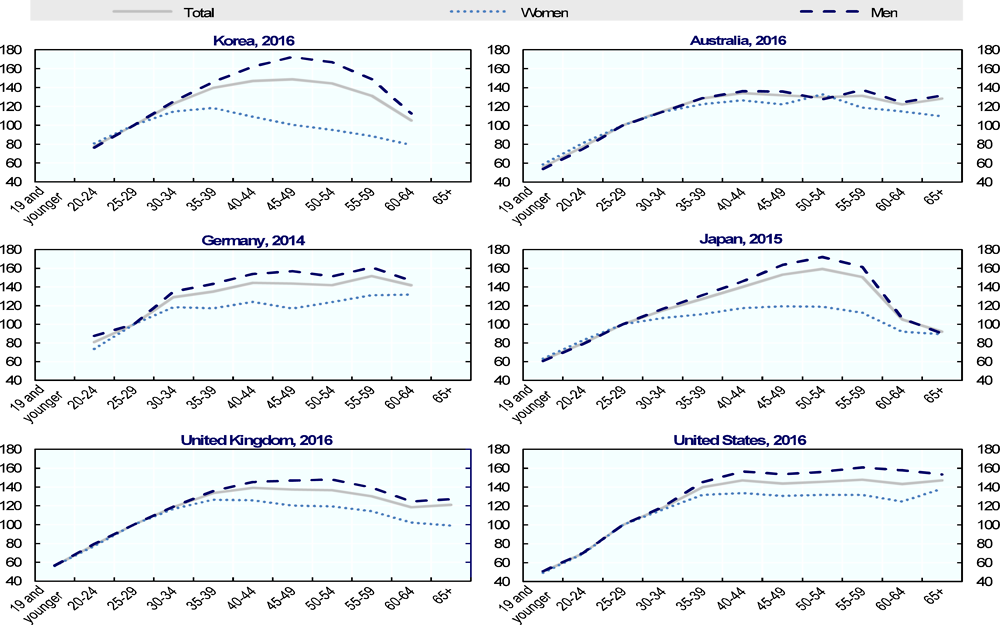
Note: Data refer full-time workers.
Source: OECD Earnings Database for age-earnings profiles.
Conclusion
Korea has gone through remarkable economic development during the past five decades, coupled with considerable social transformation. While overall employment has grown and unemployment and long-term unemployment are remarkably low, labour market developments have not kept pace with Korea’s overall economic development. Job quality and job security, in particular, remain poor for many Korean workers, highlighting pronounced labour market dualities. This, in turn, enables many of the lowest-paid, lowest-skilled workers to go undocumented, reducing their access to social protection.
The labour market faces a number of big challenges including, above all, a high prevalence of: a) non-regular employment; b) self-employment; and c) very small micro-businesses. These factors are associated with poor job quality and low pay. Strong labour market duality and inequality affects women more than men and older workers more than other groups. Moreover, many young people with tertiary education struggle to find adequate employment.
The peculiarities of the Korean labour market have shown to be persistent and a common practice of outsourcing of poor-quality jobs to SMEs – in particular those in the services sectors characterised by low productivity – has reinforced existing labour market dualities. To fulfil Korea’s growth potential, labour market problems will have to be addressed.
References
[2] Kim, J. (2015), “Promoting Good-Quality Job Creation in the Sector of SMEs”, KDI Focus, Vol. 29, http://econpapers.repec.org/article/kdikdifoc/v_3a29_3ay_3a2015_3ap_3a1-13.htm (accessed on 05 July 2017), pp. 1-13.
[1] OECD (1994), OECD Economic Surveys : By Country, 1993-1994 Korea., OECD.
[4] OECD (2013), Korea: Improving the Re-employment Prospects of Displaced Workers, OECD Publishing, https://doi.org/10.1787/9789264189225-en.
[6] OECD (2013), Strengthening Social Cohesion in Korea, OECD Publishing, https://doi.org/10.1787/9789264188945-en.
[5] OECD (2015), OECD Skills Strategy Diagnostic Report: Korea, OECD Publishing, http://www.oecd.org/skills/nationalskillsstrategies/OECD-Skills-Strategy-Diagnostic-Report-Peru-2016.pdf (accessed on 07 July 2017).
[8] OECD (2016), “PISA 2015 Results in Focus”, https://www.oecd.org/pisa/pisa-2015-results-in-focus.pdf (accessed on 07 July 2017).
[9] OECD (2016), OECD Economic Surveys: Korea 2016, OECD Publishing, https://doi.org/10.1787/eco_surveys-kor-2016-en.
[7] OECD (2017), OECD Employment Outlook 2017, OECD Publishing, https://doi.org/10.1787/empl_outlook-2017-en.
[3] Zoli, E. (2017), “Korea’s Challenges Ahead—Lessons from Japan’s Experience”, IMF, https://www.imf.org/en/Publications/WP/Issues/2017/01/18/Koreas-Challenges-Ahead-Lessons-from-Japans-Experience-44549 (accessed on 07 July 2017).