Chapter 3. Economy and the environment
Peru’s economy has performed well over the last decade thanks to macroeconomic stability, open trade, and inflows of foreign direct investment. However, much remains to be done to green the economy, as evidenced by poor performance on a number of environmental indicators. Growing awareness of the economic implications of environmental degradation has prompted action to endorse the OECD Declaration on Green Growth. This chapter reviews Peru’s achievements in the areas of environmentally related taxation, public expenditure, public-private partnerships and eco-innovation.
Key findings and recommendations
During the period of analysis, the Peruvian economy has grown at an average rate exceeding 6%, thanks to macroeconomic stability, open trade, and inflows of foreign investment attracted by the potential for natural resource exploitation. Together with establishing measures to ensure the conditions necessary for private investment in various productive sectors, the country has strengthened its environmental institutional framework as well as its legislation governing environmental management and conservation of natural resources, although it has not succeeded in decoupling environmental degradation, with its associated costs, from economic growth.
The estimated costs of environmental damage at the beginning of the analysis period amounted to some 4% of GDP. Seventy per cent of those costs were associated with the effects on health from waterborne diseases, atmospheric pollution in cities, exposure to lead, and contamination in the home. There are also estimates of water pollution from mining activities, which varied between 0.4% and 0.7% of GDP in the middle of the first decade of this century. Although the information is very sketchy, there are signs of a reduction in some environmental costs post-2006, especially those associated with atmospheric pollution. On the other hand, the amounts required to offset mining liabilities, which amounted to nearly 2% of GDP at the beginning of the period, have been growing along with the number of contaminated sites identified by the Ministry of Energy and Mines (MINEM), of which there were more than 8 600 in 2015.
Peru ranks third in Latin America and the Caribbean and first in South America in terms of the costs associated with natural disasters, as estimated over the period 1970-2010 by ECLAC. The combined costs of the El Niño/La Niña phenomena of 1982-1983 and 1997-1998 represent nearly half of GDP for the year 2000 —hence the fear of the effects that the current season’s event could have. During the period 2000-2005, the annual costs of natural disasters exceeded half a percentage point of GDP, and were associated primarily with losses in the agriculture sector. In the future, the additional GDP losses caused by climate change could amount to 15% for the period 2010-2100, and would likely be concentrated in the farming, high-Andean livestock and fisheries sectors.
Peru is well aware of its economic dependence on natural resources and the welfare effects of environmental costs. The country has been laying the basis for adhering to the OECD Declaration on Green Growth, through discussion of a national strategy for green growth and adoption of the intended nationally determined contributions (INDC) relating to the reduction of greenhouse gas emissions, among other things. Yet there is still a lack of consistency between development policies, plans and strategies, on one hand, and environmental targets, on the other; there are failures of co-ordination, both horizontal and vertical, among the various government institutions; and there are problems in reconciling investment promotion measures with efficiency and effectiveness in environmental policies.
Moreover, although Peru has abundant legislation for effective protection of the environment, and although the General Environment Law recognises the principle of internalising costs, the enforcement of legislation has relied essentially on command and control measures, with limited use of economic instruments and no specific provisions in the area of environmental taxation. In the absence of effective enforcement and penalties concomitant with damage, this strategy may be of limited effectiveness in achieving a better environmental performance. In practice, the fines levied bear no relation to the economic costs of the associated environmental damage, even though, with the creation of the Agency for Environmental Assessment and Enforcement (OEFA), there was a rise in the number and amount of fines levied toward the end of the period under analysis. Peru also allows for discounts on fines as an incentive to invest in compliance with environmental regulations.
Government expenditure on the environment, while growing, amounted to barely 0.4% of GDP at the end of the period under analysis (slightly more than 2% of total government spending), and of this amount only 27% was funded from general tax revenues. The majority of resources earmarked for environmental issues originated in utility rates and fees and taxes at the municipal level, which accounts for 75% of public environmental spending.
Generally speaking, the user pays principle has been applied to natural resource development and ecosystem services in the form of charges levied by the State (Law No. 26821 on sustainable use of natural resources, among others) for the use of water and the dumping of waste water, royalties on the exploitation of forest resources, entry fees to natural areas, and various taxes on the mining industry. The fees paid directly to the State as well as the rates charged for outsourced water and solid waste services do not typically cover the costs of their provision, and tend to lose value in real terms. Nevertheless, the contributions associated with mining and hydrocarbons exploitation (in their various forms: taxes and special levies, royalties, and so on) have been growing, averaging 1.5% of GDP, although they have fluctuated widely under the impact of the international economic cycle. These proceeds are allocated primarily to the regions where they originate, with no relationship to regional development indicators or environmental protection needs. It must also be recognised that tax evasion associated with illegal and informal mining amounts to USD 305 million a year: various estimates for the period under analysis indicate that cumulative evasion in the gold mining industry may have reached one percentage point of GDP at 2014 prices. Recent years have seen the development of systems of payment for ecosystem services, although the effectiveness and incentive value of these have yet to be evaluated.
When it comes to applying the polluter pays principle, the situation is less encouraging. Legislation to promote private investment and tax stability is making it difficult to undertake a green tax reform. Nevertheless, Peru’s low level of tax pressure, at around 16% of GDP, offers an opportunity to align environmental incentives with the need to raise greater revenues. Taxes associated with the generation of externalities (imposed on energy products and automobiles) represented about 0.6% of GDP in 2010, below the level in all OECD countries with the exception of Mexico. Revenues from the fuel tax (part of the consumer excise tax) remained relatively stable during the period under analysis until, in 2014, gasoline taxes were cut by 30%. In addition, the municipalities apply taxes on vehicle ownership and road use (levied on fuel importers and refiners, who pass them on to consumers). There is no clear relationship with the harmfulness of combustion-produced emissions, fuel quality, or the vehicle’s environmental characteristics. Moreover, there are exemptions from the fuel excise tax in 350 districts of eastern Peru, located for the most part in the departments of Amazonas, Loreto, Ucayali, San Martín and Madre de Dios. In addition, there is substantial fuel smuggling along the northern border.
Although no information is available on private spending on environmental protection activities, Peru has developed some meaningful public-private partnerships to foster investments in the public interest, including investments in water and sanitation and in the treatment and processing of wastes. However, there are no indicators that would make it possible to encourage environmentally friendly investments or to discriminate among proposals for the same project. The tax-funded works law, which provides incentives for regional and local public investment with private sector participation, allows firms to finance and implement public projects as a deducible from their tax liability, and allows subnational authorities to obtain financing in exchange for royalties and fees. The mechanism, which has financed investment in solid waste treatment, sanitation and other areas, will demand a great deal of transparency and ongoing reassessment, as local and regional institutions are progressively strengthened. Peru has no system for green public procurement, and public incentives for clean production and technologies are scarce and dependent on international co-operation. There are some incipient initiatives on extended producer responsibility (Supreme Decree No. 001-2012-MINAM).
Peru’s great natural heritage offers an opportunity for eco-innovation and the development of new productive sectors and internationally competitive niches. Nevertheless, R&D investment falls short of the average for Latin America and the Caribbean, and is far below the level in OECD countries. The intention is to boost such investment fivefold, from its 0.15% of GDP at the end of the period under analysis, and tax benefits are being awarded for innovation. The National Strategy for the Development of Science, Technology and Innovation gives priority to programmes for biotechnology and for environmental science and technology with an emphasis on climate change, among other things. But much more remains to be done to support a green growth strategy. The National Programme to Promote Bio-Trade was launched in 2003. Estimates suggest that exports of bio-trade products rose over the 2000 decade, amounting to more than USD 300 million by 2010, and that Peru is becoming one of the leading exporters of such products.
-
Complete the Green Growth Strategy in Peru, taking into account the role of environmental policies as a driver of economic growth. Include environmental policy goals in plans for national development and productive diversification, in the framework for budget planning and in sectoral policies and plans. Strengthen co-ordination between the National Centre for Strategic Planning, the Ministry of the Economy and Finance, the Ministry of Production, the Ministry of the Environment and other competent agencies to ensure the effective achievement of low-carbon green growth by defining specific, measurable and consistent environmental objectives.
-
Incorporate environmental considerations into the tax system by encouraging the introduction of environmental taxes, as applicable, and gradually eliminating environmentally harmful systems of exemptions and subsidies. Further the full enforcement of environmental criteria in taxes on fuel and vehicles, in light of their contribution to emissions and their impact on health. Replace public financial support with systems of payment for environmental services, as applicable, thereby ensuring efficient use of tax revenues and effective environmental protection.
-
Include environmental impact assessments in economic policies, in particular spending and public investment policies. Expand the strategic environmental assessments (SEA) of energy policy and transport plans, in particular for the Lima-Callao metropolitan area and other mid-sized cities, as a tool for long-term planning.
-
Develop a green public procurement system and include environmental considerations in the programme of incentives for improving municipal management.
-
Bolster regular budget funding for the environmental institutional framework in order to streamline the formulation of environmental policy and the oversight of compliance with its objectives. Promote the economic evaluation of environmental policies, plans and programmes, using tools such as cost-benefit and cost-effectiveness analyses and the establishment of objectives and goals with timetables and compliance indicators. Strengthen the use of management oversight tools to ensure compliance with those objectives.
-
Enhance the role of the private sector in the development of eco-innovation, energy efficiency, non-conventional renewable energy sources, the waste recycling, reuse and treatment sectors and other environmental policy objectives, through economic incentives, credit supports and soft loans, public-private partnerships and clean production agreements, among others. Build the eco-innovation component into R+D policy and ensure that funds from royalties foster the development of knowledge hubs in environmental protection, the sustainable use of natural resources and the creation of new environmentally friendly competitive niches. Leverage extended producer responsibility to encourage formalisation processes and strengthen eco-labelling systems in order to increase consumer awareness and encourage good private sector behaviour on the basis of the benefits of reputation.
-
Expand and deepen economic information related to the implementation of environmental policy instruments (integrated economic and environmental accounting systems, environmental spending, public financial support, direct regulation, environmental taxes, market creation mechanisms, service fees, voluntary systems, information systems) using cost-effectiveness analyses and following international methodologies and standards.
1. Links between the economy and environmental pressures
Over the past 20 years, Peru has opened up its economy to the world, achieving vigorous growth based on sound economic policies in a benign international context characterised by high prices for the raw materials that form the core of its exports. In the decade of 2003-2013, commodity exports increased by 547%, compared to an average export growth of 473%, and reached a peak in 2011-2012. The country’s reliance on a development model based on natural resources is reflected in the growing export share of minerals and hydrocarbons, along with agricultural, fishery and forestry products. Exports of commodities and natural-resource-based manufactures, which in 1990 represented 82% of the total, currently account for over 91%, as their relative weight increased during the period under analysis (Figure 3.1).
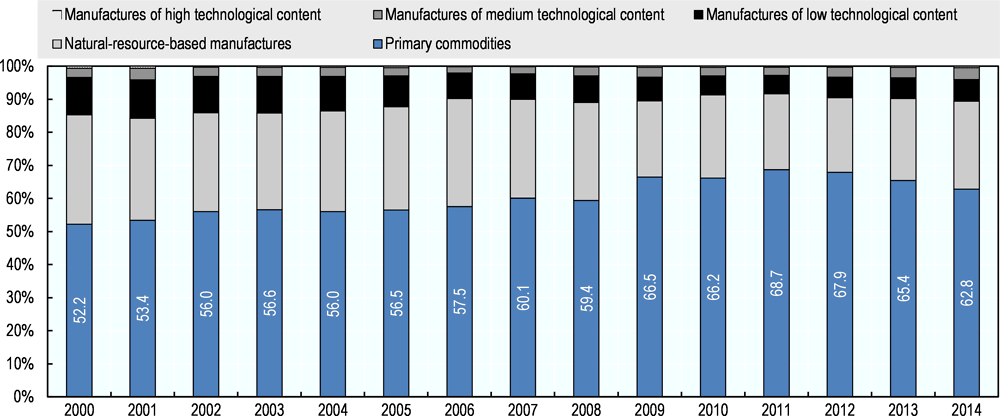
Source: ECLAC calculations on the basis of United Nations Commodity Trade Statistics Database (COMTRADE).
Inflows of foreign direct investment (FDI) increased from 2.3% of GDP in 2003 to 4.6% in 2013, thereby reinforcing the natural resource-dependent structure of production, since the investment was mainly absorbed by the mining and hydrocarbon sectors, which doubled their FDI share by the end of the period (Figure 3.2).
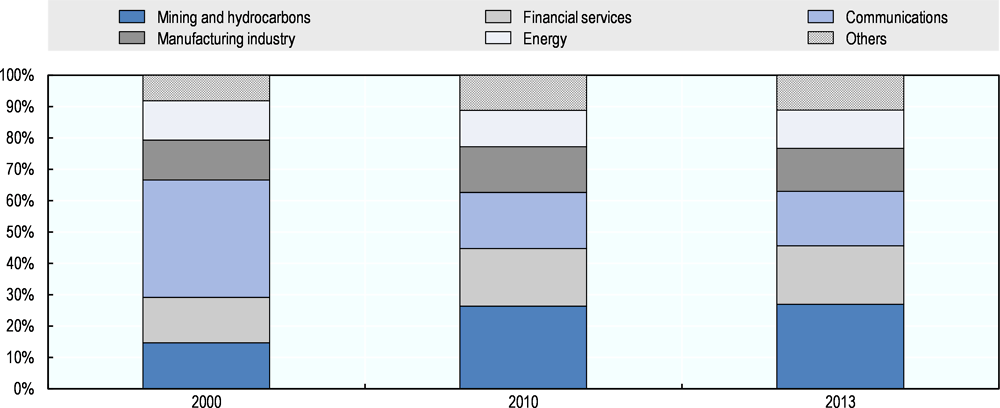
Source: Private Investment Promotion Agency (ProInversión), General statistics, 2015 [online] http://www.proinversion.gob.pe
This production structure, in which mining contributed 12% of GDP in 2013 while the forestry-agriculture and fisheries sectors accounted for 6%, generated increasing pressure on the environment and ecosystems. Economic expansion and current patterns of consumption have contributed to increased environmental degradation, which continues to be linked to economic growth and displays a worrying trend, despite the strengthening of environmental institutions and legislation (Chapter 2). Nonetheless, environmental quality indicators in Peru are similar to those in countries with the same level of development and industrialisation, and in some cases they are better than the OECD average. Examples are carbon dioxide emissions, both per capita and relative to GDP, energy intensity, the vehicle fleet, forest cover and fresh water per capita, among others (Annex I.B).
2. Economic effects of environmental degradation and climate change
Economic development in Peru is increasingly hampered by the costs imposed by extreme natural events and climate change, which compound the economic consequences of environmental degradation. Extreme events, exemplified by episodes of the El Niño and La Niña phenomena, in 1982-1983 and 1997-1998, respectively, had catastrophic effects in terms of both human lives lost and people made homeless. They also had a major economic impact on the fishery and agriculture sectors and on infrastructure, which makes Peru one of the countries most exposed to environmental risks (Bello, Ortiz, and Samaniego, 2014). Various estimates see climate change reducing GDP by 4.3 percentage points by 2025 (CAN, 2008) and by 6 points by 2050 (CAN, 2008). The Inter-American Development Bank and ECLAC (IDB/ECLAC, 2014) are projecting GDP losses of around 15% in the present century.
The World Bank estimated an environmental cost equivalent to 4% of GDP in 2003, mainly due to increased mortality and morbidity, declining productivity and the degradation of soils and infrastructure (Giugale, Fretes-Cibils and Newman, 2006). This mostly involves health effects, due to diseases caused by inadequate water supply and improper sanitation, atmospheric and indoor air pollution, as well as lead exposure. At the start of the period under review, the monetary cost of the high mortality and morbidity associated with environmental degradation in Peru, which affects the most vulnerable population groups disproportionately, was higher than in other countries of similar income level (World Bank, 2007). The cost of air pollution in metropolitan Lima was estimated at 0.5% of GDP at its peak in 2006. Since then it has abated thanks to a change in the energy matrix to prioritise gas consumption; the conversion of vehicles to run on gas; and, since 2010, restrictions on imports of used vehicles (Orihuela and Rivera, 2013). The contamination of water resources caused by mining activity has been costed at between 0.4% and 0.7% of GDP in 2008-2009 (Herrera and Millones, 2012). The resource cost of cleaning up mining liabilities represented nearly 2% of GDP at the start of the period analysed, a percentage that has been rising along with number of polluted sites identified by the Ministry of Energy and Mines (MINEM), which numbered 7 000 at the end of the period (Glave and Kuramoto, 2002, MINEM, 2011). Although few cost studies have been conducted, the negative effects of environmental degradation attributable to production processes, particularly water and air pollution, are known to be high (MINAM, 2008, OECD, 2015).
3. Environmental policy in Peru, competitiveness and economic activity
The need to harmonise sustainable natural resource use and reduce the environmental degradation associated with human activities has become increasingly important in Peru. Nonetheless, ever since environmental regulations were first developed, contradictions have arisen owing to a realisation that they could hamper economic activity. This led to the promulgation of the Private Investment Growth Framework Act (Legislative Decree 757) and the Mining Sector Investment Promotion Act (Legislative Decree 708), which modified the 1990 Environment and Natural Resources Code and rendered ineffective several of its provisions. To eliminate obstacles to economic activities, the first of these laws formalised the administrative sectoralisation of environmental management. Since the creation of the National Environment Council (CONAM) in 1994, and particularly the Ministry of the Environment in 2008, environmental policy has been strengthened with a view to establishing a more consistent relationship between environmental protection and economic activity. With the same objective, the environmental impact assessment system and the single window facility for large-scale investment projects were established, operating within the framework of the National Service of Environmental Certification for Sustainable Investments (SENACE) —created in 2012 and attached to MINAM— a body that will progressively take over the functions of the sectoral authorities as from 2015 (Chapter 2). In 2012, the Multisectoral Commission was created to draft legislative proposals and policies aimed at improving the environmental and social conditions in which economic activities are carried on, particularly in the extractive industries (Supreme Resolution 189-2012-PCM). The Commission is attached to the Office of the President of the Council of Ministers and has representatives from the Ministries of Development and Social Inclusion, Agriculture, Economic Affairs and Finance, Energy and Mines, Culture, Health and Production. Its work is complemented by the Multisectoral Commission for Marine-Coastal Environmental Management, among other entities (Supreme Decree 096-2013-PCM).
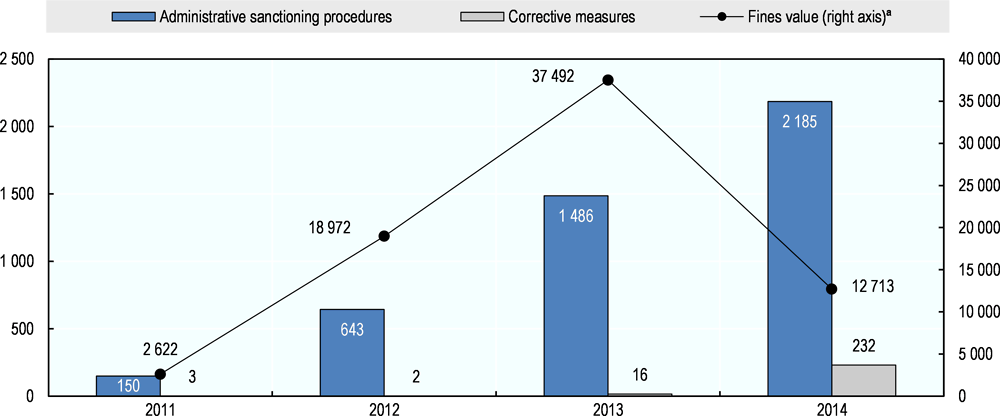
Concern about the economic consequences of environmental laws has also been reflected in legislative amendments to foster investment. Supreme Decree 054-2013-PCM specifies two circumstances in which the environmental management instrument does not need to be altered, and only a technical report is required from the owner of an investment project confirming that the required conditions are met. These circumstances are: (i) when it is necessary to modify ancillary components or to extend the scope of a project that already has environmental certification, and provided its execution would not have a significant environmental impact; and (ii) when technological improvements are to be made in the operations in question. The competent authority must notify its agreement within 15 days. The aforementioned decree was supplemented by Supreme Decree 054-2013-PCM, which aimed to reduce the cost and time to complete the procedures needed to implement investment projects. Law No. 30230 of 2014 provides for the adoption of tax measures and the simplification of procedures and permits, to encourage and invigorate investments; and priority is given to actions that prevent and correct conducts that infringe environmental regulations and are subject to sanctions by the inspection body, the Agency for Environmental Assessment and Enforcement (OEFA) (Figure 3.3). Under this law, fines are also reduced by up to 50% for up to three years, except in very serious circumstances. The effects of the application of the Investment Promotion for Economic Growth and Sustainable Development Act (Law No. 30327, of 2015), which aims to rationalise the granting of environmental permits requiring global environmental certification, facilitate expropriations for the execution of large-scale investment projects in infrastructure works and simplify procedures for assigning rights of way, still require thorough evaluation to ensure that this law makes it possible to harmonise environmental protection and economic development (Box 3.1). The legislation also provides for a cost-benefit analysis of regulations with the status of law, supreme decrees, environmental management instruments (including plans) and the methodology for calculating environmental fines.
The National Environmental Impact Assessment System Act of 2001 was substantially amended in 2008, as per Legislative Decree 1078; and the regulations to the Act were issued in 2009.
The single window facility, designed to optimise the environmental impact assessment of large-scale investment projects, was set up in 2015, under the Investment Promotion for Economic Growth and Sustainable Development Act (Law No. 30327). This legislation instituted the Global Environmental Certification, an administrative instrument issued by SENACE through which this entity approves category III environmental studies, for which it has 150 working days as from the date of presentation. To this end, information on the corresponding qualifying titles or opinions (14 in total),1 according to the nature of the project, is included in the Detailed Environmental Impact Study. Global Environmental Certification allows for environmental certification qualifications to be included in a single administrative procedure. The relevant public consultations should also be carried out within the aforementioned period.
The system responds to the need to speed up the approval of projects of economic and social importance for the country; but this improvement is controversial. Some civil society organisations have raised objections, arguing that the system makes it harder to protect indigenous territories, it could be detrimental to the autonomy and functions of regional governments, and it could increase social conflicts. These organisations also consider that the deadlines are very tight and that the system assigns excessive responsibilities to public officials in charge of procedures, who are exposed to sanctions.
As this legislation has only recently been passed, it is too early to assess its results; and these will largely depend on the human and financial resources available to SENACE and its effective co-ordination with the sectoral authorities. Accordingly, implementation of the law will need to be monitored to determine whether it contributes to creating a balance between the economic, social and environmental development of Peru.
Note1: Article 2 states that the law covers public entities involved in the granting of licences, permits, authorisations and the like, as well as entities related to the activities of environmental certification, tax collection, investment promotion, approval of rights of way, land valuation, protection of security areas and land purchase for large-scale infrastructure works. The scope of this rule is applicable to public, private, public-private or mixed-capital investment projects.
4. Mainstreaming green growth and sustainable development in public policies
Peru has many planning instruments, most of them aimed at fostering the country’s growth, competitiveness and development. The most far-reaching is the Bicentenary Plan: Peru towards 2021 (CEPLAN, 2011), which specifies the objectives, targets and activities needed to implement the State policies defined in the 2002 National Agreement. The policies are grouped around four thematic pillars. Sustainable development and environmental management form part of the “Country competitiveness” pillar, one of the objectives of which is to boost exports of organic products; while the “Conservation and sustainable use of natural resources and biodiversity” pillar contains guidelines on the valuation of natural heritage, promotion of corporate environmental responsibility, clean production, bio-trade, renewable energies, eco-efficiency and the use of economic instruments in environmental management. Indicators are also defined with baselines and targets for 2021, including the percentages of forest areas with permanent production and under forestry management (38% in 2009 and 75% in 2021); the number of marine species subject to sustainability measures (8% in 2008 and 15% in 2021); the share of renewable energies in gross domestic energy supply (49% in 2009 and 56% in 2021); the number of environmental variables included in the national accounts (none in 2010 and 85% in 2021); and the proportion of agricultural land under mechanised irrigation (2% in 2008 and 27% in 2021). The Plan envisages strategic programmes, for which it estimates necessary financial resources.
The National Competitiveness and Formalization Council of the Ministry of Economic Affairs and Finance (MEF) co-ordinates pro-competitiveness policies. The strategic pillars of the Competitiveness Agenda for 2012-2013 and 2014-2018 include the environment, and natural resources and energy, respectively. The first of these seeks to design activities to promote environmental sustainability aimed at increasing competitiveness, and emphasises the need to promote exports of goods and services derived from biodiversity. The Ministry of the Environment is tasked with attaining specific targets for eco-efficiency and forest conservation to mitigate climate change. The current agenda prioritises evaluation of the effects of applying environmental standards; the implementation of national land-use planning policy (including the review of economic-ecological zoning procedures); and the strengthening of management capabilities in relation to environmental quality and natural resource use (eco-efficiency, eco-labelling, renewable energies and mechanised irrigation, among others).
The National Productive Diversification Plan, developed by the Ministry of Production, aims to improve the country’s production structure, partly by reducing excess costs arising from over-zealous or ill-conceived regulations on safety, health and the environment. The objectives of the Plan include fostering productive innovation, the development of production clusters and the registration of patents; but it does not delve deeper into the productive potential of environmental protection or the competitive advantages associated with the sustainable use of ecosystemic goods and services.
The Ministry of the Environment is implementing the National Environmental Action Plan (PLANAA), Peru 2011-2021 (Supreme Decree 014-2011-MINAM), which, among other things, targets the sustainable use of natural heritage and the competitive and eco-efficient functioning of the public and private sectors. MINAM also prepares the National Environmental Action Agenda, which specifies objectives, along with the results expected during the agenda’s lifetime and follow-up indicators. The increased commercialisation of bio-trade products and investments in eco-businesses, together with the inclusion of environmental criteria in the regulatory framework of economic activity, are some of the expected results. These instruments are complemented by national strategies, either currently in force or in the process of being formulated, on issues such as climate change, desertification, biodiversity, water resources, trade and the environment.
In 2015, the Peruvian Government took initial steps towards endorsing the OECD Declaration on Green Growth, which recognises that environmental protection and economic growth can be compatible. To this end, a debate was launched on a green-growth strategy; and nationally determined contributions were adopted for the reduction of greenhouse gas (GHG) emissions, among other things. Since 2013, Peru has also been involved in the Partnership for Action on Green Economy (PAGE), sponsored jointly by the United Nations Environment Programme (UNEP), the United Nations Development Programme (UNDP), the United Nations Industrial Development Organization (UNIDO), the International Labour Organization (ILO) and the United Nations Institute for Training and Research (UNITAR). The aim of the project for Peru is to contribute to a form of development planning that embraces the concept of green growth, while also promoting efficient resource use, environmental quality and sustainability, the creation of green jobs and adoption of the instruments needed to implement them. The development of a green-growth strategy offers possibilities for harmonising, and creating synergies between, the Bicentenary Plan; the National Environmental Action Plan; the National Competitiveness Plan; the National Plan for Productive Diversification; the National Strategic Plan for Science, Technology and Innovation for Competitiveness and Human Development (PNCTI) 2006-2021; and the current strategies for the various aspects of sustainable development. The strategy’s linkage with multi-annual budget programming and the strict monitoring of results and fulfilment of targets and indicators will help to fully mainstream green growth in public policies.
5. Environmental taxes
Although tax revenues in Peru grew from 14.5% of GDP in 2000 to 18.3% in 2013 (OECD/ECLAC/CIAT/IDB, 2015), they are still relatively low compared to those of OECD members and other Latin American and Caribbean countries, which averaged 34.1% and 21.3% of GDP, respectively, in 2013. In that context, environmental taxes would boost revenue and provide incentives for implementing a green-growth strategy under the polluter-pays and user-pays principles.
Nonetheless, the current tax system is not aligned with a green-growth strategy, and in 2012, environmental tax revenues were barely 0.6% of GDP, well below the OECD average, and also lower than other countries in the region. Furthermore, there has been no increase in the period under review (Figure 3.3). Virtually all of these taxes are levied on fuels and gasolines, although some also apply to automobiles.
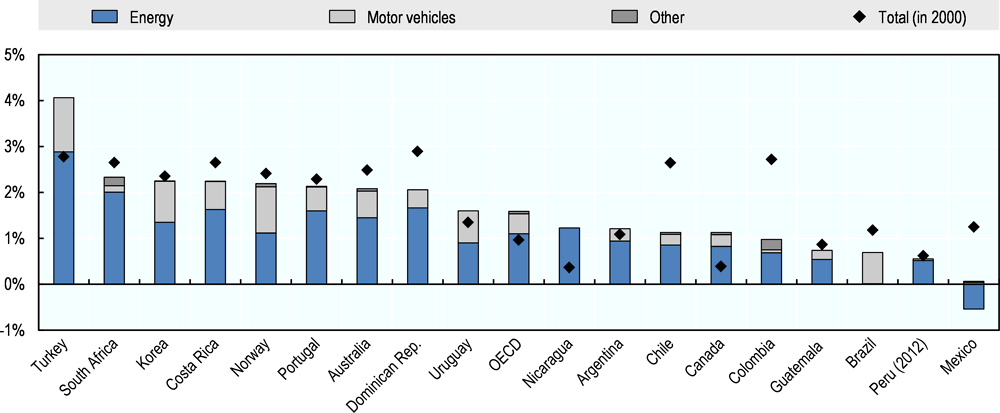
Source: OECD, OECD database on policy instruments for the environment [online] http://www2.oecd.org/ecoinst/queries.
The consumer excise tax (ISC) is a specific duty levied on the sale in Peru, by producers or importers, of motor gasoline, kerosene and kerosene-type fuels used in jet engines and turbines, also covering diesel fuels and coal. Revenue from this tax, which goes directly to the national government and is the most important environment-related tax, fell both in absolute terms and as a proportion of total tax revenue in 2013-2014, owing to the reduction in the rates applicable to gasoline and diesel fuels (Supreme Decree 316-2014-EF).
Development of the Fuel Toxicity Index (INC) by CONAM in 2005 (Board of Directors Decree 018-2005-CONAM-CD), initially for pedagogic purposes, was the first step towards relating the tax to the impact on the population of the pollutants contained in fuels. Law No. 28694 of 2006, regulating the sulphur content of diesel fuel, stipulates that, as from 1 January 2008, ISC rates on fuels should be “proportional to the degree of toxicity of the pollutants they contain for the health of the population”. To this end, MEF, in co-ordination with CONAM, is required to approve annual indices of relative toxicity. This change was set to occur gradually over a maximum period of eight years, ending on 1 January 2016, when the toxicity criterion should fully govern the setting of fuel taxes. The index applies exclusively to fuels used for energy purposes, but not to mixtures with other elements to produce intermediate or final products.
In 2007 (Supreme Decree 211-2007-EF and amendments), fixed amounts were established for taxes (per gallon or tonne), applying the criterion of proportionality to the degree of toxicity. In the annual table, the flat taxes on gasoline were gradually reduced, to a greater extent in cases where they had a higher octane value, to a lower level than those applicable to kerosene and jet fuels (gasoil). A substantial increase was also anticipated in the ISC on the latter two fuels and other types of fuel oil. However, at the end of the period the higher-octane gasolines were still subject to a relatively higher ISC. Preparation of the annual table was suspended in 2013, pending recalculation of the toxicity index (Supreme Decree 348-2013-EF). The new index, approved by Supreme Decree 006-2014-MINAM, will allow MEF to adjust ISC to penalise the most polluting fuels (Table 3.1).
The Amazon Investment Promotion Act (Law No. 27037 of 1998 superseded by Law No. 29742 of 2011) granted exemption from General Sales Tax (IGV) and ISC for firms located in the departments of Loreto, Ucayali and Madre de Dios, in respect of sales for domestic consumption of oil and natural gas and their derivatives in these areas. Similarly, firms in the department of Madre de Dios will be entitled to a refund of any ISC paid on the purchase of petroleum-based fuels. Nonetheless, these measures have not yielded the expected results, and they have generated a high fiscal cost and resulted in a misalignment of environmental incentives (APEC, 2015). The National Merchant Marine Reactivation and Promotion Act of 2015 also provides IGV and ISC exemption for a 10-year period on the sale of fuels and lubricants to cargo vessels flying the national flag. Public transport services, except rail and air, are also exempt from IGV. Other provisions grant a 30% refund of ISC on diesel oils, with the aim of encouraging the formalisation of interprovincial public passenger and freight transport services. Electric utilities using this type of fuel are totally exempt from the tax.
One of the direct sources of revenue for local governments is the road use tax (impuesto al rodaje), levied through the Municipal Compensation Fund at a rate of 8% on the sale of vehicle fuels (gasolines). The tax is applied at the manufacturing (refinery) stage, or when it is imported; and it is incorporated into the selling price of the fuel, which motorists pay as users of the local road infrastructure. It thus serves to remunerate the municipalities for road construction and maintenance (Municipal Tax Law, Legislative Decree 776).
In addition to general taxes (tariffs, IGV and VAT), vehicles are subject to a municipal promotion tax of 2% (national tax with revenue assigned to the municipalities). In contrast, the municipal Vehicle Ownership Tax, which is paid once a year and applies to the ownership of automobiles, vans, SUVs, trucks and buses, is equivalent to 1% of the value of vehicles in the first three years after registration. Lastly, in the case of used vehicles, an ISC rate of 30% is payable, in addition to the imposition of technical restrictions and age limits for importation purposes, while new vehicles are subject to a 10% ISC. Recreational boats, including jet skis, pay an annual rate of 5% of the original value, with the revenue thus received being assigned to the Municipal Compensation Fund.
6. Solid waste management charges
Pursuant to the General Law on Solid Wastes (Law No. 27314-2000) and its amendments, provincial municipalities are responsible for the management of solid wastes of household or commercial origin, and similar waste generated by other activities. In contrast, the district municipalities are tasked with the provision of solid waste collection and removal services and for the cleaning of public roads, spaces and monuments in the areas under their jurisdiction; and they charge fees (or rates) for providing these services. In 2013, the national per capita revenue obtained from public cleaning services averaged USD 3.50, with a maximum rate of about USD 12 in Lima and Callao. Nonetheless, the deficit reported in that year was almost 53%, and it has been trending upwards in the present decade (MINAM, 2014). Low collection and high arrears rates are very common problems among municipalities, which make it difficult to provide these services adequately (Chapter 7). To promote recycling and broaden the scope of extended responsibility among producers, so that it is not limited to electrical and electronic equipment, Supreme Decree 001-2012-MINAM creates new economic opportunities and fosters shared responsibility for solid waste management.
7. Fees for the provision of ecosystemic goods and services
The Organic Law on the Sustainable Use of Natural Resources (Law No. 26821 of 1997) was enacted to promote and regulate the sustainable use of renewable and non-renewable natural resources, by establishing a suitable framework for promoting investment and striking a balance between the economy, conservation and social development. The granting of natural resource use rights is governed by specific laws for each resource; and the rights in question give rise to economic benefits. The Ecosystem Service Payment Mechanisms Act of 2014 provides for the establishment of a system of payment for ecosystem services, under which measures that contribute to the conservation, recovery and sustainable use of such services would be paid for by their beneficiaries.
7.1. Water
In Peru, fees, referred to as “retribuciones”, are levied for water use (both consumptive and non-consumptive) and for waste-water discharge. In the first case, all users must pay the State an amount per cubic meter of water used, irrespective of right of use or origin (Water Resources Law, No. 29338 of 2009), since this natural resource is national property. The fees set by the National Water Authority (ANA), which vary by type of use (agricultural and non-agricultural), respond to economic criteria applicable to the productive sector and to social criteria applicable to the population and agrarian sector. The rate-setting process takes account of water availability in river basins and aquifers, along with the demand from, and effect of, the first of those sectors. The operating companies collect the fees, and the revenues are used by ANA to formulate watershed management plans; for water management in natural sources; the financing of quality control and monitoring measures; and to enhance availability and conservation. The payment for authorised discharge of waste water treated in a recipient body is an economic payment, and not a tax, which users have to pay annually. The Water Authority assesses its amount according to the quality of the water, the volume discharged and the cost of recovery at the affected source. The rate charged for discharges of domestic-municipal waste water is lower, and that applied to industrial waste varies according to the level of danger. The revenue obtained finances the monitoring, prevention, control and repair of environmental damage. In 2009-2014, annual revenue amounted to about 50 million Peruvian sol (PEN 50 million), or roughly USD 18 million; and it has since been rising, although it is still very low in per capita terms. Most of the payments for discharges correspond to the mining sector, followed by the sanitation sector with a much smaller volume.
In all cases, economic incentives are given for efficient use and the adoption of measures for the recovery or restoration of water bodies, including the application of treatment techniques to reduce the pollutant load. Incentives, in the form of certificates, give discounts on the fee payment and preferential treatment for obtaining water rights in respect of surpluses generated through efficiency and other measures.
In addition to the fees, users, where appropriate, are charged for the following: (i) use of the water infrastructure (charges to cover construction, operation and maintenance costs, and the recovery of investments); (ii) the distribution of water to the various sectors, and (iii) monitoring and control of the use of groundwater when the service is outsourced to third parties. In addition to the informality that characterises water use by the population and the agricultural sector, there are cross-subsidies from industrial users to domestic ones, and from higher-income households to those with lower incomes. Moreover, a large percentage of water consumption is not invoiced, which makes it difficult to recover costs (Chapter 8).
7.2. Forestry and hydrobiological resources and natural areas
The use of forest resources for commercial and industrial purposes must be governed by management plans and is subject to a system of concessions, authorisations and permits and the payment of an adjustable duty that depends on the usable volume, the value of the products in their natural state, their location and ease of access, environmental and landscape resources, and public services. Forestry legislation recognises deforestation duties, which vary according to the area to be cleared. These duties are paid to the National Forestry and Wildlife Service (SERFOR); and the resources they provide are used for forestry development, the application of control and monitoring mechanisms, and the promotion of afforestation, reforestation and recovery of degraded systems. Half of the revenue is distributed among the regional governments involved. According to the Food and Agriculture Organization of the United Nations (FAO) and the World Bank (2012), the revenue collected by the forestry authorities is insufficient for them to carry out their functions. In 2009, USD 3.2 million was obtained from forest exploitation duties, which, together with payments for administrative services, covered less than 50% of expenses. The same is true at the regional level, with Ucayali being the only department able to cover its expenses. The aforementioned study recommends reclassifying the timber species on the basis of their real market value, and increasing the amount charged for each category; or else for the Government to cover the budgetary needs of the forestry authorities. The possibility of reducing or eliminating the charges for exploitation rights as an incentive to sustainable management is ruled out, owing to the impact this would have on the budget of the forestry authority. The granting of incentives for the provision of environmental services is consistent with the existing mechanisms of payment for ecosystemic services. Several studies have found that the resources currently available, amounting to USD 0.5 per hectare per year, are insufficient for effective monitoring and control (Suárez de Freitas, 2009). The costs associated with illegal logging have also been documented (Chapter 9).
The exploitation of hydro-biological resources requires a time-limited right, granted by the Government through concessions, authorisations, permits or licenses and subject to an annual payment that is set according to the commercial value of the species to be extracted, their use and destination, and their degree of exploitation, among other considerations. In this context, emphasis is placed on non-transferable quota systems (Chapter 11). Aquaculture enjoys some exemptions from the payment for water use; and, in the case of deprived social conditions, from the payment of duties.
Rights in respect of tourism and recreational use of protected natural areas (ANP) for commercial purposes are granted through concessions, contracts, authorisations and permits. As in the previous cases, the granting of these rights (validity or exploitation) entails a payment to the State (SERNANP, 2014). Such payments are not considered taxes, and the sums collected must be reinvested in the management of the ANPs, although SERNANP can use up to 30% of the total revenue for the management of the National System of Protected Natural Areas. The collection of an ANP entrance fee, which is the system’s main direct revenue source, has trended positively since 2003. The funds received increased from PEN 5.5 million, which was then equivalent to just over USD 1.5 million, to almost PEN 9.3 million in 2013. While this represents a real increase of over 30%, it is much less than the proportionate increase in the number of visitors during the same period.
Several studies place a high value on the contribution made by ANPs to the country’s development, given the benefits they provide: water supply, hydroelectric power generation, non-timber forest products, food security for the local population, protection of watersheds against erosion and sedimentation, carbon capture, tourism and biotrade possibilities. They also note the relative lack of investment in the maintenance of these areas and possible additional sources of income (León Morales, 2007, Sanclemente, Ruiz and Pedraza, 2014). Although the financial resources available to the system do not allow the necessary expenses to be incurred, the allocation of regular public funds to the ANPs has increased significantly since 2009; and directly collected funds (duties, remuneration and entrance fees), have also increased since 2011, albeit offset by a stagnation or reduction in grants (Chapter 9).
8. Fiscal revenue obtained from non-renewable natural resources
The importance of natural resources, particularly non-renewables, to the Peruvian economy is also reflected in their contribution to fiscal revenues generated through special taxes and levies on mining, along with mining royalties and income taxes. In 2011, the Mining Solidarity with the People Programme was terminated, under which the mining companies committed to making a voluntary contribution equal to a percentage of their net profits. At the moment, steps are being taken to link taxation of the sector more closely to profitability, although the effects of its activities on the environment and the country’s natural heritage are not taken into account. The new royalties are not defined on the basis of sales (value of the concentrate calculated according to the international market price), but on operating profit; and they vary between 1% and 12%, on a cumulative progressive scale. The funds thus raised are distributed between local and regional governments (80% and 15% respectively), and national universities in the producing regions (5%).
The special mining duty is charged on the operating profits of firms that enter into agreements with the Government in respect of projects for which guarantee contracts and investment promotion measures are in force; so they are not taxes, but contractual obligations. In the absence of such agreements, known as “tax stability contracts”, a special mining duty is levied, which is also based on operating profits, although subject to other progressive rates (Laws No. 29789 and No. 29790). Both the duty and the tax are applied to the activities of exploitation of metallic mineral resources, and the companies deduct the amounts paid as an expense for income-tax purposes. Small-scale producers and artisanal miners are not covered (General Mining Law). Government revenues from this sector, which represented 0.9% of GDP in 2013, are mainly obtained from income tax, which in that year accounted for 78% of the total, compared to less than 7% in the case of royalties, and 15% for special taxes and charges. Under the mining industry revenue sharing arrangement (canon minero), 50% of these funds are channelled to the areas where mining activities are carried on.1 Thus, government income from this source is volatile and depends both on the profitability of the sector and on international prices (Chapter 12). There is also considerable evasion owing to illegal and informal mining activities (Torres, 2015).
Taxation in the hydrocarbons sector (oil and gas) consists of royalties and income tax. The royalty is calculated as a percentage of the value of the resource extracted; it is fixed for each contract and is deductible as an expense for income-tax purposes. The revenue in question has grown steadily in the period analysed, in proportion to the value and volume of the resources extracted. The Camisea Consortium makes the largest contribution in both taxes. In 2013, revenues from this sector were similar to those of mining, with royalties accounting for over 70% of the total. The canon minero is the mechanism for transferring a large proportion of the funds raised to subnational governments.
9. Fines
Given the importance of command and control measures relative to economic instruments to protect the environment and internalise externalities, effective enforcement and the imposition of sanctions in accordance with the damage caused are essential. Although, in practice, the fines paid cover far less than the economic cost of the environmental damage they aim to prevent, the creation of OEFA resulted in an increase in the fines imposed and their amount, although in 2014 and under the new legislation on the subject, the amounts were temporarily halved (Figure 3.3). Pursuant to provisions of Law No. 30230, OEFA cannot use income obtained from fines to finance environmental inspection activities, which must be funded from the regulatory contribution of the entities and companies it supervises. This contribution was established in 2000 under the Framework Act on Supervisors of Private Investment in Public Services (Law No. 27332); and, since 2013, it has had to finance the performance of OEFA environmental inspection activities in the mining and energy sectors (OEFA, 2014). Moreover, the agency grants ad honorem and economic incentives, in the form of discounts on fines, to recognise the application of good environmental practices over and above what is required by the regulations.
Note: a) In 2014, the value of one Tax Unit was PEN 3 800 (about USD 1 300).
Source: OEFA and MINAM.
10. Environmental expenditure and investment
The system of tax-funded works (Act to Promote Regional and Local Public Investment with Private Sector Participation, Law No. 29230), which entails forgoing tax revenue, makes it possible to channel part of the income tax payment by private firms into the formulation and implementation of priority public investment projects at all three levels of government and also at public universities. The firms recover the investment made through a certificate that allows them to deduct it from their income tax assessment. In 2009-2014, projects implemented under this modality increased exponentially, more than doubling each year; 20% of the projects (accounting for 28% of the funding) were in the sanitation sector, 33% in transport and 22% in education; the transport sector accounted for just under half of the investments. In addition, the Public-Private Partnerships Framework Act has strengthened this private investment promotion mechanism. Although not directly related to the environment, it nonetheless has environmental components in which private investment has increased considerably. Projects implemented through public-private partnerships include the construction of waste-water treatment plants in Taboada and La Chira, the provision of sanitation services in the districts of southern Lima, and the construction of some sections of the Lima and Callao metro network.
A large proportion of non-governmental and international co-operation funds is earmarked for the environment, with 17.5 per cent of co-operation funds allocated on a non-reimbursable basis between 2010 and 2014. The United States, Spain, Switzerland and Germany are the main donors. Environmental management is the preferred target of official assistance, while philanthropic grants focus on conservation. As Peru is a middle-income country, dependence on these resources can become problematic. Most of them, whether allocated on a reimbursable or on a non-reimbursable basis, are channelled through funds. The MIVIVIENDA Fund of the Ministry of Housing, Construction and Sanitation provides a grant for environmental protection in real estate projects, specifically for the adoption of water- and energy-saving measures and solid-waste management according to a plan. In this area, the National Fund for Natural Areas Protected by the State (PROFONANPE) and the National Environment Fund (FONAM) are leading players, with participation by officials from MINAM, MEF and other institutions of the business world and civil society.
11. Eco-efficiency and eco-innovation
In Peru, a national environmental-efficiency programme, known as Peru Ecoeficiente, is being implemented to promote savings in energy, paper and water in the public sector (Supreme Decree 009-2009-MINAM). In addition, as a means of encouraging green public procurement, the use of biodegradable and recycled products has been made mandatory (Supreme Decree 011-2010-MINAM). The General Law on the National Budget System provides for measures targeting the same objective; and in 2008, the Business Eco-efficiency Award was instituted.
Although the State Procurement Act recognises the principle of environmental sustainability and requires criteria to be applied to guarantee this in all procurement processes, “seeking to avoid negative environmental impacts in accordance with the rules on the subject”, the implementation of a green-growth strategy requires a comprehensive system of green public procurement and incentives for eco-efficiency and the use of clean technologies. The Law Promoting the Development of Techno-ecological Industrial Parks (Law No. 30078, of 2013), created to “ensure the growth and orderly development of industries at the national level with a cluster approach, in accordance with environmental stewardship, efficient energy use, social responsibility and water care”, constitutes an innovative initiative on the subject. The creation of the National Quality System in 2014 strengthened measures adopted to standardise environmental management, including labelling; and the energy efficiency standards and labeling project is currently executing.
12. Investment in research and development
Investment in research, innovation and development is at a very low level in Peru, compared to other OECD countries. Expenditure on R&D barely represents 0.1% of sales (CONCYTEC, 2014), although the development of science, technology and innovation has been prioritised since 2012 by strengthening the National Science, Technology and Technological Innovation System. In addition, a national strategy has been formulated and various funds created; and tax benefits have been granted to innovative enterprises. The five programmes approved by the National Council for Science, Technology and Innovation (CONCYTEC) include the National Transversal Programme on Biotechnology and the National Transversal Programme on Environmental Science and Technology. The latter has components related to climate change, the conservation and sustainable use of natural resources, and environmental quality. Patent registration is an indicator used to measure the effects of investment in science and technology, a field in which Peru displays poor results. Among other things, the number of Peruvian patents registered in the United States is below the regional average; and countries with a similar level of development, such as Chile and Colombia, have nearly three times and twice the number registered by Peru, respectively. Since 2010, the National Institute for the Defense of Competition and Intellectual Property Protection (INDECOPI) has registered a very small number of biotechnology patents; 97% of which were granted to foreign nationals.
13. Trade opportunities
Peru has an open economy and has signed trade agreements with the countries and blocs to which it exports. The treaties in force with Canada, the United States, the Republic of Korea and the European Union contain environmental chapters, which facilitated the creation of specialised councils and committees for monitoring and implementing their provisions. One of the titles of the agreement with the European Union is devoted to trade and sustainable development, and there is also a subcommittee dealing with the latter. Side agreements on environmental co-operation have been signed with Canada and the United States (Chapter 5). Under the agreement with Japan, two joint declarations were issued, on trade and the environment and on biodiversity, access to genetic resources and traditional knowledge. In general, bilateral agreements allow the parties to adopt measures to ensure that the environmental consequences of investments are taken into account; and several of them offer opportunities for trade in biodiversity products. Peru participates in several bio-trade programmes, as it is one of the leading exporters of products in that category (Box 9.2). A moratorium was also imposed on the entry into national territory and the production of living modified organisms for a ten-year period (Law No. 29811, of 2011); a regime was established on the subject; Law No. 27811 of 2002 was enacted; the National Commission against Bio-piracy was created, and numerous measures have been adopted to combat this activity.
In addition, as with imported capital goods, a zero tariff is applied to environmental goods recognised by the Asia-Pacific Economic Cooperation (APEC) Forum. The export sector needs to adapt to the demands of global markets, which are expressed both through regulations in the countries in which it sells its products and through greater environmental awareness among consumers, who make increasing demands as to the sustainability of production processes.
Bibliography
Abugattás, J. (2005), “El gasto medio ambiental en Perú: exploración inicial”, Medio Ambiente y Desarrollo series, No. 103 (LC/L.2349-P), Santiago, Economic Commission for Latin America and the Caribbean (ECLAC), September.
APEC (Asia-Pacific Economic Cooperation) (2015), “Peer Review on Fossil Fuel Subsidy Reforms in Peru. Final Report”, Singapore, July.
Bello, O., L. Ortiz and J. Samaniego (2015), “Assessment of the effects of disasters in Latin America and the Caribbean, 1972-2010”, Medio Ambiente y Desarrollo series, No. 157, Santiago, Economic Commission for Latin America and the Caribbean (ECLAC), December.
CAN (Andean Community) (2008), El cambio climático no tiene fronteras: impacto del cambio climático en la Comunidad Andina, Lima, May.
CEPLAN (National Center for Strategic Planning) (2011), Plan Bicentenario. El Perú hacia el 2021, Lima, February.
CONCYTEC (National Council for Science, Technology and Technological Innovation) (2014), Estrategia Nacional para el Desarrollo de la Ciencia, Tecnología e Innovación. Crear para crecer, Lima, May.
FAO/World Bank (Food and Agriculture Organization of the United Nations/World Bank) (2012), “Evaluación del impacto del cobro por derechos de aprovechamiento de madera en pie y otras tasas sobre el manejo forestal en Perú”, Estudios Sectoriales, vol. 6, February.
Giugale, M., V. Fretes-Cibils and J. Newman (2006), An Opportunity for a Different Peru: Prosperous, Equitable, and Governable, Washington, D.C., World Bank, December.
Glave, M. and J. Kuramoto (2002), “Minería, minerales y desarrollo sustentable en Perú”, Minería, minerales y desarrollo sustentable en América del Sur, London, Environmental Research and Planning Center (CIPMA)/ International Development Research Centre (IDRC).
Herrera, P. and O. Millones (2012), “Aproximando el costo de la contaminación minera sobre los recursos hídricos: metodologías paramétricas y no paramétricas”, Economía, vol. 35, No. 70, Lima, Catholic University of Peru.
IDB/ECLAC (Inter-American Development Bank/Economic Commission for Latin America and the Caribbean) (2014), “La economía del cambio climático en el Perú”, Documentos de Proyectos, No. 640 (LC/W.640), Lima.
León Morales, F. (2007), El aporte de las áreas naturales protegidas a la economía nacional, Lima, National Institute of Natural Resources, September.
MINAM (Ministry of the Environment) (2015), Caracterización y Cuantificación del Gasto Público Ambiental Peruano, Lima, September.
______ (2014), “Sexto informe nacional de residuos sólidos de la gestión del ámbito municipal y no municipal 2013”, Lima, December.
______ (2008), “Diagnóstico ambiental del Perú”, Lima, February.
MINEM (Ministry of Energy and Mines) (2011), “Pasivos ambientales mineros”, Lima, July [online] http://www.minem.gob.pe/_legislacionM.php?idSector=1&idLegislacion=6718.
OECD (2015), Multi-Dimensional Review of Peru: Volume I. Initial Assessment, Paris.
OECD/ECLAC/CIAT/IDB (Organization for Economic Cooperation and Development/ Economic Commission for Latin America and the Caribbean/Inter-American Center of Tax Administrations/Inter-American Development Bank) (2015), Revenue Statistics in Latin America and the Caribbean 2015, Paris, March.
OEFA (Agency for Environmental Assessment and Enforcement) (2014), Contribution by regulation. Agency for Environmental Assessment and Enforcement, Lima, August [online] http://www.oefa.gob.pe/?wpfb_dl=11825.
Orihuela, C. and F. Rivera (2013), “El costo económico de la contaminación del aire por PM10 en Lima Metropolitana: un análisis exploratorio”, Economía y Sociedad, No. 82, Economic and Social Research Consortium (CIES), December.
Sanclemente, G., L. Ruiz and N. Pedraza (2014), Contribución del sector privado a las áreas protegidas: estudios en Colombia y Perú, M. Rios and A. Mora (eds.), Quito, International Union for Conservation of Nature and Natural Resources (IUCN)/Environment Canada/Ecoversa Corporation.
SERNANP (National Service of Natural Protected Areas) (2014), Guía de otorgamiento de derechos para turismo en áreas naturales protegidas, San Isidro, March [online] http://www.sernanp.gob.pe/documents/10181/101461/guia+de+otorgamiento+de+derecho.pdf.
SNMPE/IPE (National Mining, Petroleum and Energy Association/Peruvian Institute of Economics) (2011), La tributación minera en el Perú: contribución, carga tributaria y fundamentos conceptuales, Lima, January.
Suárez de Freitas, G. (2009), “Situación actual del sector forestal en el Perú”, Tecnología y Sociedad, No. 9, Lima, Soluciones Prácticas, August.
Torres, V. (2015), “Minería ilegal e informal en el Perú: impacto socioeconómico”, Cuadernos de CooperAcción, No. 2, Lima, CooperAcción, August.
Vargas, P. (2009), “El cambio climático y sus efectos en el Perú”, Working Paper series, No. 2009-14, Central Reserve Bank of Peru (BCRP), Lima, July.
World Bank (2007), Análisis ambiental del Perú: retos para un desarrollo sostenible. Resumen ejecutivo, Lima, May [online] http://siteresources.worldbank.org/INTPERUINSPANISH/Resources/Res_Ejec_CEA_FINAL.pdf.
Note
← 1. See National Superintendency of Customs and Tax Administration (SUNAT), “Memoria institucional” [online] http://www.sunat.gob.pe/cuentassunat/planestrategico/memoraInstitucional.html.