Chapter 3. The FSE database and indicators of policy support to fisheries1
This chapter provides the latest available data on support to capture fisheries. The Fisheries Support Estimate (FSE) database now inventories budgetary support to fisheries that totals USD 13 billion (EUR 11.7 billion) in 33 countries and economies in 2015. For the first time, data for the People’s Republic of China (hereafter “China”) is included in the database, revealing the scale of policies in this important fishing nation. Nearly 88% of all support transferred to individual fishers recorded in the database originates in China. In a positive development, China has announced plans to progressively reduce this subsidy. For most other countries and economies in the database, support to general services to the sector, rather than transfers to individual fishers, dominate. Governments invest a significant amount of resources to this kind of support, which includes management, enforcement, research, infrastructure and marketing. On average, these expenditures by governments equal 16% of the value of landings; that is, USD 1 in every 6 earned by the sector. While some governments recoup these costs from fishers, this approach is not commonly applied and accounts for only a small percentage of the total outlay on general services to the sector.
New countries in the FSE change the picture of global support
In May 2017, the OECD released a first study using the new Fisheries Support Estimate (FSE) database, replacing the old Government Financial Transfers (GFT) classification that was used in the last OECD Review of Fisheries in 2015 (Box 3.1).
At the time that report, which included data from 31 countries, mainly members of the OECD, showed that more than 90% of budgetary support provided by governments was in the form of general services to the sector (GSSE). This kind of support offers benefits to the sector generally but does not make payments directly to fishers. The largest share of such support is for the provision of management services; that is, the cost of administration and operation of the management system.
Programmes that make payments directly to fishers, called transfers to individual fishers (TIF) in the FSE, were only a small share of the total and involved support to help fishers invest (for vessel construction or modernisation), leave the sector (decommissioning schemes) or to support their income (unemployment benefits).
The report did not contain information on fuel tax concessions, a form of support that has been the subject of some attention in recent years. This is because while these programmes have the same basic effect—reducing the cost of fuel purchased by fishers—they vary in their sector specificity. That is, in many countries these are not fisheries policies, but part of a larger scheme. As the FSE collects only programmes specific to fisheries, the coverage of this form of support is highly uneven across countries and so is omitted from reporting. The last time a systematic estimate of the value of fuel tax concessions was made was in 2008 (Martini, 2012[9]). That study found the value of these concessions to be around USD 2 billion (EUR 1.3 billion).
Much has changed with the recent update of the FSE database, which now includes 33 economies, seven of which are outside the OECD. Most significantly, the Peoples Republic of China (hereafter “China”), the largest fishing nation in the world, now appears in the FSE for the first time, changing the global coverage and the picture of support significantly. Costa Rica also enters the database for the first time, joining Colombia, to help improve the understanding of support in less-developed countries with smaller fisheries.
The most striking aspect of this is how it changes the scale of support and its composition. The largest single support policy in the FSE is now the fuel subsidy in China, which delivered USD 6 billion (EUR 4.6 billion) of support in 2014, the last year for which data is available.2 Support in China in 2015 has been estimated on the basis of government announcements that the level of support will be reduced to 40% of the 2014 amount by 2019.
This one policy accounts for 45% of the total budgetary FSE and changes the share of TIF in the FSE from less than 10% previously to more than 40%. The scale of this one programme is such that its changes drive the trends in the overall FSE. For this reason, some data is reported both with and without China included in order to focus on some of the other policy trends in the FSE.
Support in the FSE now totals almost USD 13 billion
The current version of the FSE database contains data for 2009 to 2015, with some earlier data available for certain programmes. Budgetary policy support to the capture fisheries sector as reported in 26 OECD countries resulted in net transfers totalling a reported USD 7.04 billion (EUR 6.34 billion) in 2015. In some of the discussion below, this group is used to produce an OECD average.
Total budgetary support reported in the FSE database including the seven non-OECD countries currently participating is almost USD 13 billion (EUR 11.7 billion)3. The majority of this was provided in the form of support to general services (GSSE) which, after accounting for cost recovery charges (CRC) of USD 170 million (EUR 150 million), are estimated to have totalled USD 7.04 billion (EUR 6.35 billion)4. USD 6.09 billion (EUR 5.49 billion) of support was provided in the form of transfers to individual fishers (TIF)5. In 2015 88% of all reported TIF was attributable to China’s fuel subsidies policy.
Instances of non-reporting have left some gaps, particularly for categories relating to support in the form of management and enforcement expenditures. All fisheries systems face costs associated with management and enforcement, so to ensure that aggregate levels of support reflect this and to avoid having missing data determine the TIF/GSSE ratio in the FSE, these gaps are currently filled with estimates. The missing values for management and enforcement support were estimated by deriving the average ratio of support to value of landings observed in reporting countries and applying this to the value of landings in non-reporting countries. The Secretariat is working with reporting countries to fill these gaps and eliminate the need for estimates6.
Support as a proportion of the value of landings has decreased overall in OECD countries
The FSE offers a partial view of global support, as not all countries are included in the database. This makes assessing trends over time less conclusive, as the number of countries for which data is available in the FSE changes. In addition, some gaps in reporting in some years may affect trends in the data.
The amount of support provided can vary considerably from year-to-year. This can be the result of the implementation of a multi-year programme, a result of changing economic and environmental conditions or other reasons. Wherever possible the base period when considering individual country data has been set as the annual average of 2009-11 and is compared with the reference period of 2015. As additional data is collected and a longer time series develops, the trends in the data will become clearer and more robust.
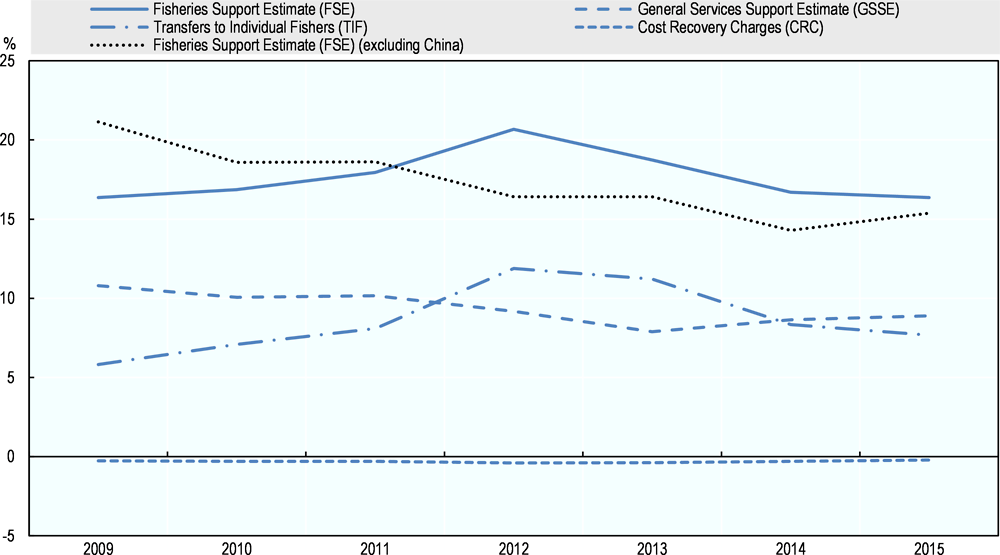
The recent inclusion of data relating to China has changed the pattern of budgetary support in aggregate. The underlying pattern of declining overall support and a shift towards GSSE policies still exist, but now does not begin until 2012 and 2014, respectively. This is due to a progressive and substantial increase in TIF by China between 2009 and 2013, which has since been falling.
The data show that, in general and in aggregate, reporting countries spend on support an amount approximately equal to 20% of the value of landings (Figure 3.1). This amount has been declining over time to around 16% in 2015, though adding China flattens this trend considerably.
1. Missing figures for value of landings have been estimated using data from 'The 2016 Annual Economic Report on the EU Fishing Fleet' (Belgium, France, Lithuania, Spain) or in some cases simply carrying over the value of the previous year.
2. The GSSE numbers reported here include estimations for management and enforcement expenditures, where missing.
3. Missing 2015 FSE data for China have been estimated by carrying over 2014 values, except fuel subsidies which have been estimated based on announced goals
4. Further details on the estimation methods used are provided in the text.
Source: OECD Fisheries Database.
The Doha Ministerial Conference in 2005 launched negotiations to clarify and improve WTO disciplines on fisheries subsidies, including through a prohibition of certain forms of fisheries subsidies that contribute to overcapacity and overfishing. Those negotiations did not conclude. There has been new activity at the WTO on fisheries subsidies since 2016 and efforts appear to have intensified.
The OECD released a report on support to fisheries that was intended to improve the evidence-base for negotiations. Its preliminary analysis suggested that for a similar rate of support provided to the different categories of support in the FSE:
-
Support directed at the use of variable inputs (such as for equipment, fuel or bait) is the most likely to increase fishing effort and the potential of overfishing, and the least likely to deliver real income benefits to fishers.
-
Support directed at the use of fixed inputs (vessels and other durable investments) is the most likely to encourage expansion of capacity as this lowers the cost of investment. The benefits of this support disperses into factor values and benefits only factor owners at the time the support is initially put in place.
-
Support based on fishers’ income appears to provide the greatest benefit to fishers and is relatively less likely to increase capacity or fishing effort.
-
Support to general services, a diverse category of policies including management, enforcement, infrastructure investments and R&D, appears to be the least likely to increase capacity or fishing effort.
The effect of support on capacity and fishing effort appears to be conditioned on, but not entirely mitigated by, the quality of the management system in place.
Source: OECD (2017), "Support to fisheries: Levels and impacts", OECD Food, Agriculture and Fisheries Papers, No. 103, OECD Publishing, Paris, www.dx.doi.org/10.1787/00287855-en.
Transfers to individual fishers (TIF) are provided in several forms
Transfers to individual fishers as a share of the budgetary FSE in OECD countries has been declining, and stood at 8% in 2015. This share jumps to 36% of budgetary FSE in 2009 and 47% in 2015 when Chinese data are included.
The TIFs reported in the FSE database are classified according to their implementation criteria, and cover forms of support that depend on the use of different factors of production, based on fishers’ incomes, or payments to reduce productive capacity. Support that reduces variable input costs accounts for most of the reported TIF in the database.
The fuel subsidy in China is classified in the FSE as a budgetary transfer and not a tax benefit. Fishers receive a payment to reduce the cost of their fuel consumption that is based on the price of fuel. The subsidy covers 50% of the cost of diesel above RMB 3 870 (USD 615) per tonne and 100% of the cost above RMB 5 070 (USD 806) per tonne. The subsidy was introduced in 2006 and has expanded in value along with the quantity of fuel consumed, primarily by the distant water fleet. The Chinese government announced in its 13th Five-Year Plan to reduce the fuel subsidy to 40% of the 2014 value by 20197.
Australia had the highest rate of growth for transfers to fishers based on the reduction of productive capacity. Between the base period (2009-2011) and 2015 spending in this area increased by an average of 27% per year, predominantly due to the use of net-licence buyback schemes in 2015. In 2015, Australia was third behind China and Spain in terms of absolute spending on transfers based on the reduction of productive capacity. China was the largest provider of payments based on fixed capital formation (usually vessel construction or modernisation), followed by Mexico, Indonesia and Spain.
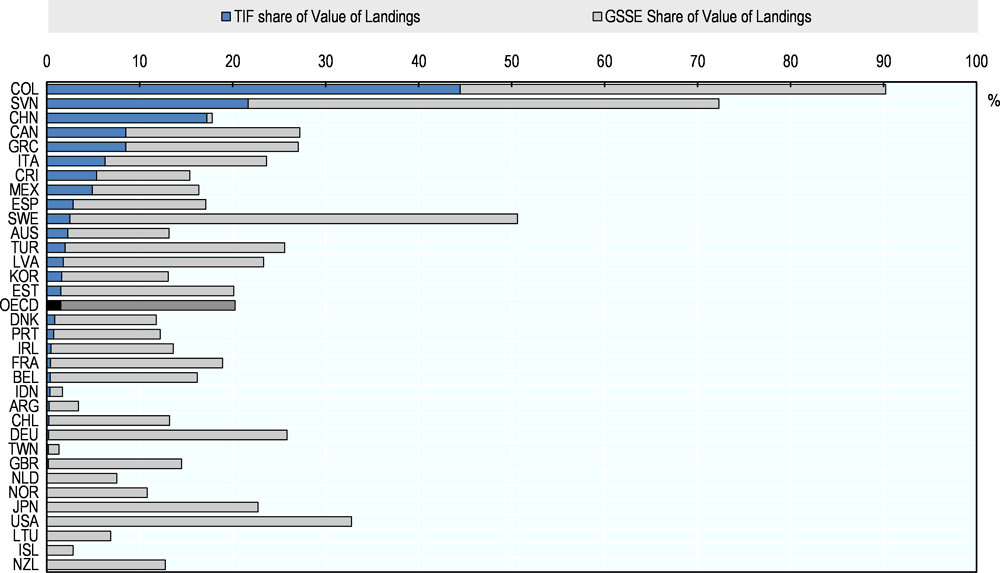
Transfers to individual fishers were below 5% of the value of landings in most cases in 2015 and less than 1% of the value of landings in 18 of the 34 countries covered. New Zealand, Iceland and Lithuania reported no budgetary transfers directed to individual fishers (Figure 3.2).8 Only Colombia (44%), Slovenia (22%) and China (17%) provided support in the form of transfers to individual fishers that exceed 10% of their value of landings in 2015. In Slovenia’s case, the relatively high amount results from a one-time payment made in 2015 under the European Fisheries Fund (EFF) “Socio-economic compensation for the management of the fishing fleet”.
1. Missing figures for value of landings have been estimated using data from 'The 2016 Annual Economic Report on the EU Fishing Fleet' (Belgium, France, Lithuania, Spain) or in some cases simply carrying over the value of the previous year.
2. The GSSE numbers reported here include estimations for management and enforcement expenditures, where missing. Further details on the estimation method used are provided in the text.
3. Portugal and Mexico did not report any figure under the GSSE category so the numbers provided here reflect exclusively the estimations of management and enforcement expenditures.
4. Missing 2015 FSE data for China have been mostly estimated carrying over 2014 values, except fuel subsidies.
Source: OECD Fisheries Database.
There appears to be a minimum fixed cost associated with management and enforcement, as smaller fisheries tend to show these costs as a higher proportion of the value of landings. This may explain the situation in Sweden for example.
Decommissioning schemes still in widespread use, but the amount of support provided is in decline
Decommissioning schemes are policies to reduce or otherwise adjust fleet capacity through the scrapping of fishing vessels or retirement of fishing licenses. Such policies reached their height in the mid-2000s (OECD, 2006[10]). While the total amount of support provided to these programmes has been reduced over time, they remain in broad use illustrated by the number of countries reporting on them for this Review.
Fleet adjustment, through programmes designed to help reduce the overall number of vessels, fishing power, or both, is still an important tool. In the EU, the EMFF provides for such spending under Union Priority 1 on Promoting environmentally sustainable, resource-efficient, innovative, competitive and knowledge-based fisheries with 11 EU Member States intending to use decommissioning as part of their EMFF operational programmes for the 2014-2020 period. China has also made this a major emphasis of the fisheries development aspect of its 13th five-year plan. Similar policies have also been reported in Chinese Taipei, Korea, Turkey and Australia.
Support to general services is mostly used for enforcement measures
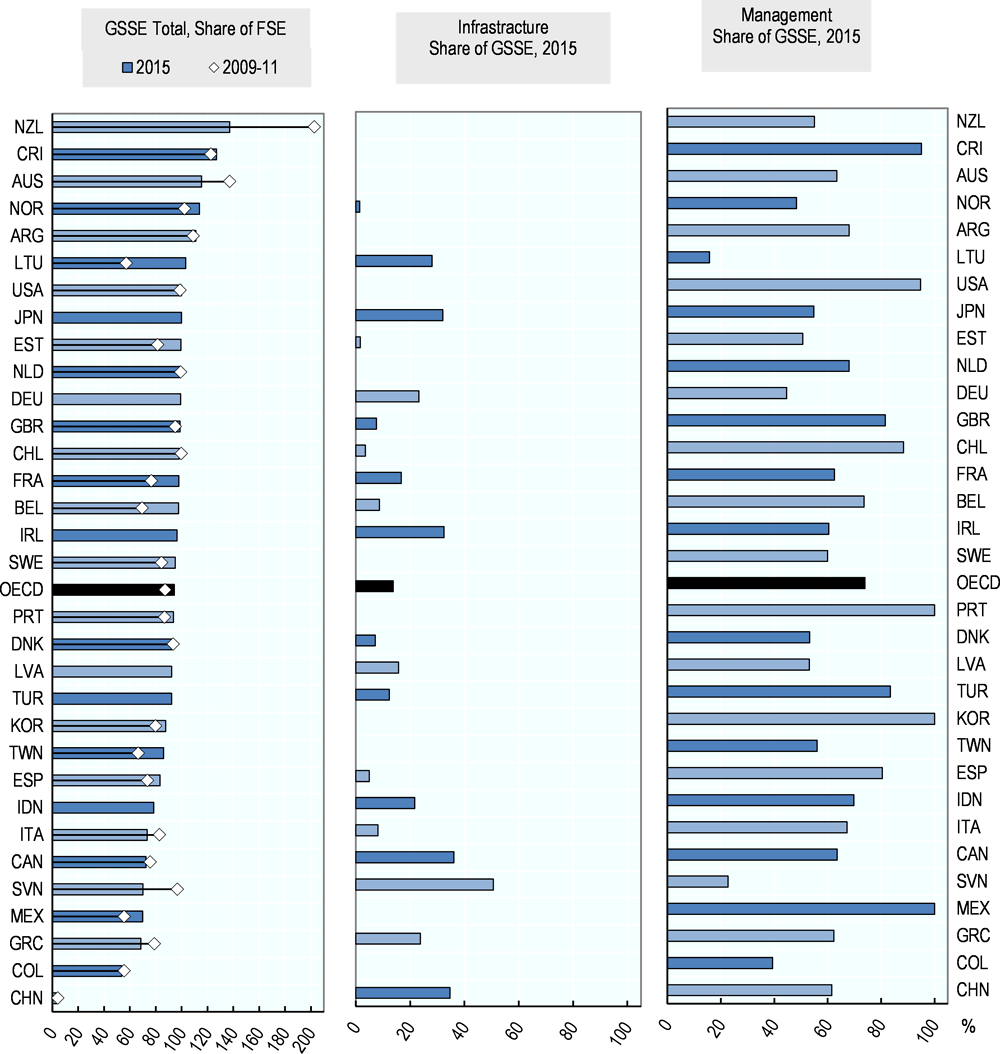
For most countries in the database, the relative importance of transfers to individual fishers has gradually decreased. This is partly a consequence of a decline in total spending in this area, but also because of an increase in absolute levels of support to general services between 2012 and 2015. The proportion of the total FSE in the form of general services policies has been increasing since 2009. After taking cost recovery charges into account, GSSE support made up 92% of total FSE transfers in 2015 (not including China), up from 83% in 2009 (Figure 3.3).9
Forms of support categorised as falling within general services include access to other exclusive economic zones (EEZs), infrastructure, marketing and promotion, community support, education and training, research and development, management of resources. When Chinese data is not included, expenditure on fisheries management programmes, surveillance and enforcement, and stock enhancement, accounts for the greatest part of general services support and accounted for 69% of all reported support (before cost recovery) in 2015. Provision of infrastructure (13%) and research and development (7%) accounted for most of the remaining reported support. China spends a relatively higher proportion of general services support on infrastructure, which changes the overall picture when this is taken into account.
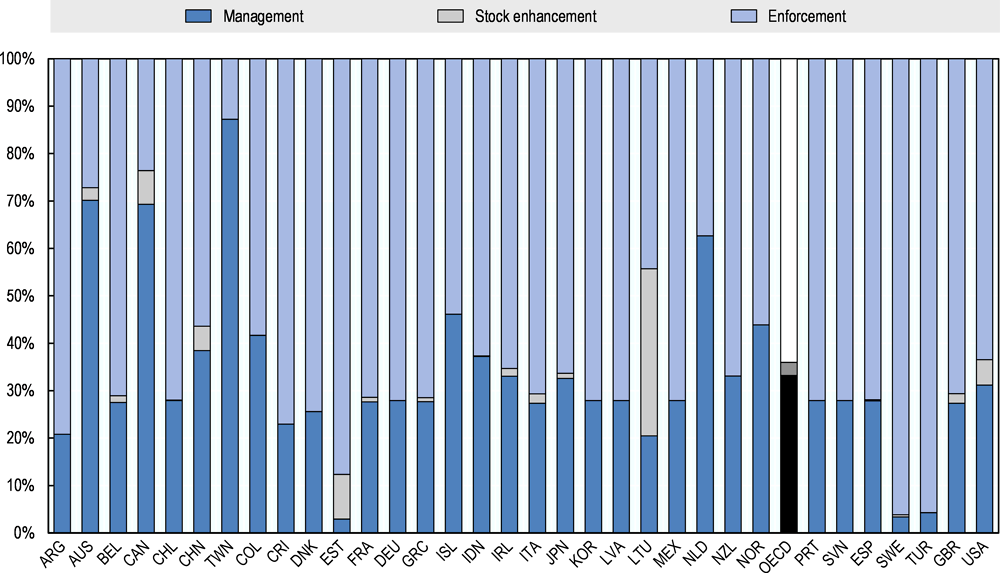
About three-quarters of the support reported in the GSSE is for funding fisheries management or for monitoring, control and enforcement (MCS) (Figure 3.4). In the majority of countries MCS costs accounted for around 65% of total FSE spending in 2015. The exceptions to this are Australia, Canada, Indonesia, Netherlands and Chinese Taipei, who allocate a majority of their general support expenditures to fisheries management programmes. Other notable exceptions are Sweden and Turkey where 96% of general support is allocated to enforcement alone. In absolute terms, the United States, Canada and Japan report the most spending on stock enhancement, which can take the form of ecosystem restoration or restocking. In relative terms Lithuania allocates the greatest proportion of general support to restocking inland fisheries (35%).
1. The GSSE numbers reported here include estimations for management and enforcement expenditures, where missing. Further details on the estimation method used are provided in the text.
2. Portugal and Mexico did not report any figure under the GSSE category so the numbers provided here reflect exclusively the estimations of management and enforcement expenditures.
3. Missing 2015 FSE data for China have been mostly estimated carrying over 2014 values, except fuel subsidies.
Source: OECD Fisheries Database.
1. The numbers reported here include estimations for management and enforcement expenditures, where missing. Further details on the estimation method used are provided in the text.
2. Portugal and Mexico did not report any figure under the GSSE category so the numbers provided here reflect exclusively the estimations of management and enforcement expenditures.
3. Missing 2015 FSE data for China have mostly estimated carrying over 2014 values, except fuel subsidies.
Source: OECD Fisheries Database.
Cost recovery charges are small and not widely applied
Cost recovery charges (CRC) are typically levied in the context of offsetting the costs of providing GSSE support. As a proportion of the annual value of landings, these have fluctuated at an average of 2-3% in the countries that utilise CRC over the period 2009-15, in absolute terms the total value of cost recovery has increased by 3.8% per year over the same period. Of the 33 economies represented in the FSE database at some point between 2009 and 2015 only 10 reported the use of cost recovery charges. Some countries, such as New Zealand and Iceland, make substantial use of cost recovery and essentially collect the full cost of fisheries management in the form of charges to the sector.
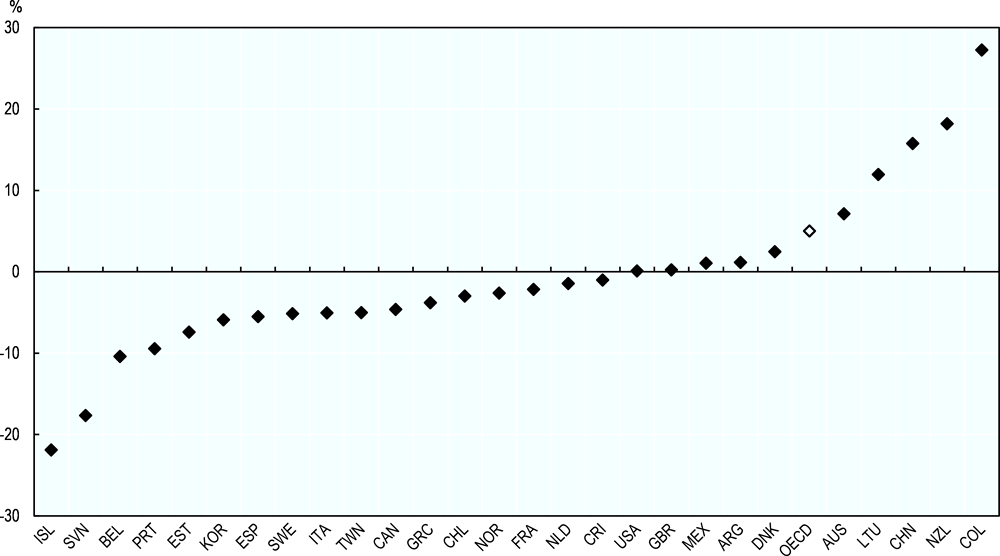
Annual average rates of change in total FSE are mixed and uneven at the country level
The majority of countries have reduced reported support and in all but seven countries the absolute change is less than 10% per year (Figure 3.5). With the exception of China, the smallest changes have generally occurred in the largest fisheries. Support in China increased by 16% per year on average between the reference period and 2015 as spending on the fuel subsidy increased to its peak in 2014.
The largest annual average rate of change is seen in Colombia (+27% per year), whilst the largest decrease took place in Iceland (-22% per year). This is a result of the relatively low absolute levels of support they provide to their fishing industries, which make even small changes seem large in percentage terms. In 2015 Iceland had the lowest level of support as a share of landed value of all countries in the database; it also had the third lowest level of support in absolute terms. Colombia had the highest level of support as a share of landed value but it also had the fifth lowest absolute level of support in the same period and the trend in support is opposite that of the average.
The ratio of FSE to value of landings (Figure 3.2) puts the outcome of the apparently high growth rate observed for New Zealand into context. The explanation for this increase is that prior to 2012 New Zealand had not reported expenditures related to research. Research expenditures account for close to a third of New Zealand’s FSE expenditures. This explains the significant yearly increase in New Zealand’s FSE estimates from 2009 to 2015, so any increase in expenditure is likely to be significantly lower. Regardless of any growth in its FSE, New Zealand still has one of the lower ratios of support to value of landings of all OECD economies in the most recent period reported.
1. The numbers reported here include estimations for management and enforcement expenditures, where missing. Further details on the estimation methods used are provided in the text.
2. Missing 2015 FSE data for China have been mostly estimated carrying over 2014 values, except fuel subsidies.
Source: OECD Fisheries Database.
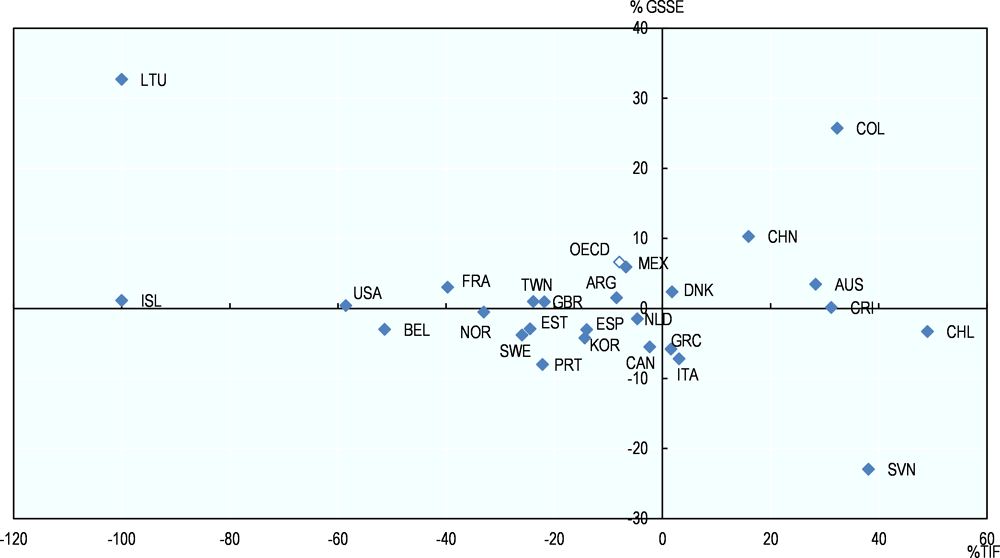
Most countries have reduced the amount of support provided directly to individual fishers
Eighteen countries have reduced the amount of support provided to individual fishers between the 2009-11 reference period and 2015. (Figure 3.6—those in the left half). Of these, nine have also reduced the amount of support to general services in the same period. Reductions in TIF have generally been proportionally larger than those in the GSSE, but this is largely driven by the relative difference in the absolute sizes of the two forms of support. Nine countries increased spending on TIF, of which four increased both TIF and GSSE (Colombia, China, Australia and Denmark).
1. The GSSE numbers reported here include estimations for management and enforcement expenditures, where missing. Further details on the estimation methods used are provided in the text.
2. Portugal and Mexico did not report any figure under the GSSE category so the numbers provided here for GSSE changes reflect exclusively the estimations of management and enforcement expenditures.
3. Missing 2015 FSE data for China have been mostly estimated carrying over 2014 values, except fuel subsidies.
Source: OECD Fisheries Database.
References
[9] Martini R. (2012), Fuel Tax Concessions in the Fisheries Sector,
[10] OECD (2006), Financial Support to Fisheries: Implications for Sustainable Development,
Notes
← 1. The statistical data for Israel are supplied by and under the responsibility of the relevant Israeli authorities. The use of such data by the OECD is without prejudice to the status of the Golan Heights, East Jerusalem and Israeli settlements in the West Bank under the terms of international law.
← 2. The fuel subsidy in China is a budgetary transfer, not a tax concession.
← 3. Not all economies participating in this Review participate in the FSE database. Currently the following countries or economies are included; Australia, Belgium, Canada, Chile, Denmark, Estonia, France, Germany, Greece, Iceland, Ireland, Italy, Japan, Korea, Latvia, Mexico, Netherlands, New Zealand, Norway, Portugal, Slovenia, Spain, Sweden, Turkey, United Kingdom, United States, Colombia, Costa Rica, Lithuania, China (People’s Republic of), Indonesia, Argentina, Chinese Taipei.
← 4. Support considered as falling within the category of general services includes access to other EEZs, infrastructure, marketing and promotion, community support, education and training, research and development, management of resources.
← 5. Transfers that support fishers individually include support that reduces variable or fixed costs, maintains income, and payments to reduce capacity
← 6. In a small number of cases data on the value of landings was not available for 2015. Estimated management and enforcement expenditures in 2015 were therefore calculated using the value of landings for that country in 2014. Indicators where the value of landings is used to contextualise the level of support also use value of landings from 2014 if it was not available for 2015. This is under the assumption that value of landings will have not changed significantly from one year to the next. In all cases, if the data used in an indicator or associated figure is not for 2015 this is stated in the text or in a note appended to the figure. Following this approach the indicators presented here provide the most up-to-date and complete picture currently possible of support to fisheries over the period 2009-15.
← 7. This reduction amount is used to (linearly) estimate the change in the subsidy between 2014, the last year available, and 2015.
← 8. EU Member State support is heavily influenced in scope and volume by EU structural support (EFF, EMFF).
← 9. Improved policy coverage in both the TIF and GSSE components of the FSE could change this picture.