Chapter 5. The financing of non-financial corporations1
Non-financial corporations are responsible for a large share of the economic activity in most advanced economies. They produce goods and services, they invest, and they employ a large share of a country’s labour force. Their importance in the “real” economy is evident in nearly every economic activity. This chapter focuses on non-financial corporations’ interactions within the financial system, both as borrowers and as lenders. Their investments of available funds across instruments may provide important insights into their investment strategies and their propensity towards risk. Conversely, different sources of funding for non-financial corporations shed light on their key choices, such as the choice of debt or equity or the mix of long versus short-term debt. This chapter further provides insights on non-financial corporations’ balance sheets, and on the indicators that can be derived from them. It also addresses key conceptual and operational issues, such as the differences between the System of National Accounts (SNA) and corporate or business accounting.
1. The role of non-financial corporations in the economy and in financial markets
Before we can explore the role of non-financial corporations in the economy and the financial markets, we first need to understand what and who they are. Like most accounting terminology, the generic name “non-financial corporations” does not always encompass the full scope of the subject. Non-financial corporations are incorporated legal entities that largely produce goods and services for the market. The “non-financial” label means that they principally engage in the production of non-financial goods and services, as opposed to financial services. Non-financial corporations therefore encompass many industrial classifications. The “corporations” tag means that these entities come into being by law via incorporation, in many cases authorised by the government. This gives them their own legal status separate from their owners, which limits the liability of the owners in a number of circumstances (e.g. business failure). Their “incorporated” status is also what differentiates these businesses from the unincorporated enterprises and sole proprietorships that are generally part of the household sector discussed in Chapter 4.
Non-financial corporations do not only consist of the large companies and conglomerate firms listed on the stock markets, but may also include smaller unlisted firms with limited liability. This institutional sector includes the enterprises that produce the cars we drive, the televisions we watch, the food we eat and various forms of media that inform and entertain us. They are the enterprises that provide many of us with a pay cheque, and they account for most of the companies in which we invest in order to get our piece of the corporate pie.
Statisticians organise enterprises into sectors based on the predominance of their operations. As said, the commonality of companies in the non-financial corporations sector is that they are separate legal entities and they produce non-financial goods and services. Beyond that the companies can be quite different. The non-financial corporations’ sector includes, for example, incorporated energy and resource firms, agriculture, forestry and fishing businesses, manufacturers, companies engaged in distribution of products (wholesalers and retailers), entities engaged in construction and real estate, transportation services, and other non-financial business services (professional, scientific and technical services), as well as information and cultural services.
The three most significant roles of non-financial corporations are as producers of goods and services, as investors in non-financial assets (which leads to the future production of goods and services), and as borrowers in financial markets. The last role implies that they are investment vehicles for the other sectors of the economy such as households and financial corporations. With respect to the latter, it can be added that, in some economies, non-financial corporations have become significant net lenders to other sectors, as their financial position is such that their saving exceeds their need for investments in non-financial assets.
Non-financial corporations’ role as producers of goods and services
The sum of non-financial corporations’ production is referred to as their output. It is what results from the production of goods and services by combining labour, capital, and intermediate goods and services. Non-financial corporations are the source of much of the world’s output and employment. In most countries, non-financial corporations account for over 60% of total output, as can be seen from Table 5.1. This share is fairly consistent from one country to the next. The average share for the OECD countries in the table is almost 70%.
Non-financial corporations’ role in investment
Investment plays a key role in any economy, ensuring that capital used in the production process to meet the demand for goods and services is in place. In order for non-financial corporations to remain viable, they need to invest in productive assets. Therefore, investment, or gross fixed capital formation (GFCF) as it is called in national accounts terminology, is crucial to non-financial corporations’ current and future production. In many economies, non-financial corporations account for the overwhelming share of such investment in non-financial assets. Table 5.2 shows the share of investment of non-financial corporations to total investment for selected OECD countries.
Non-financial corporations’ role as an investment vehicle: net borrowing and net lending
Non-financial investment, that is, investments in assets like buildings, machinery and equipment, and software, are the link between the non-financial corporations’ “real” accounts (or real activity) and financial accounts (or financial activity). If non-financial corporations are able to generate saving in excess of their non-financial investment needs in a given accounting period, they are known as net lenders or net financial investors. If non-financial corporations are unable to generate saving that match their investment needs in a given accounting period, they are net (financial) borrowers. The relevant balancing item is the net lending/net borrowing position, and is recorded in the capital account. Non-financial investments can be financed in one of two ways, through the use of internal funds (current or retained earnings), or by borrowing funds from other sectors of the economy.
In the event that non-financial corporations require external funds, other sectors must be willing to provide them with funds. This highlights the third important role non-financial corporations play in the economy – an investment vehicle for investors from other sectors. Non-financial corporations offer investors a stake in their earnings (in the form of dividends on equity held) or interest payments on debt. The end result is that claims on non-financial corporations can be found on the balance sheets of other sectors in the economy, such as households, financial corporations and non-residents. The reverse is also true: in the event that non-financial corporations have excess funds they become financial investors and supply these funds to other institutional sectors. In recent years, the latter has been the situation in Canada, the US, and some other countries as well. See also Box 5.1.
In Canada, as well as in some other OECD countries, the non-financial corporations’ sector moved from a net borrowing position to a net lending position around the turn of the 21st century. This structural change fundamentally altered the balance sheets of non-financial corporations, and is an excellent example of the link between the “real” accounts of non‐financial corporations and their corresponding financial accounts.
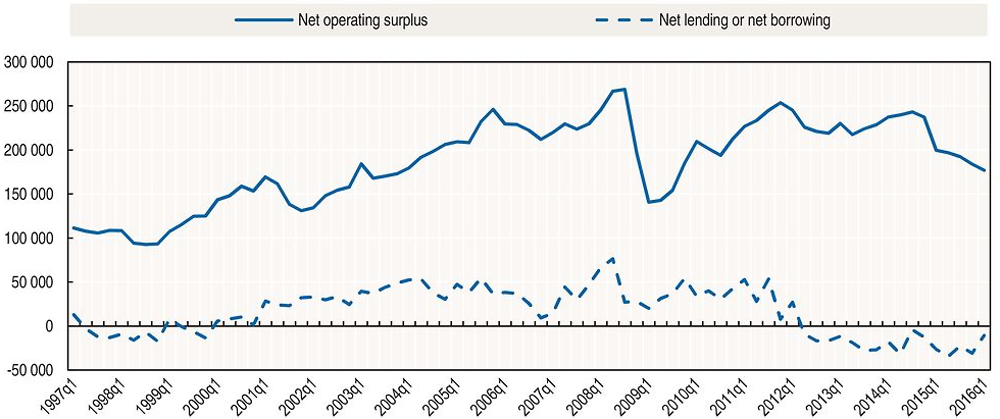
In Canada, corporations began generating large net lending positions since 2000. Corporate earnings have been on a strong upward trend since about 1997 (except for a few interruptions – the high-tech bust in 2001, and the financial crisis in 2008-09). This earnings growth was led by consumer demand and, in many industries, foreign demand (see Figure 5.1).
Clearly, earnings growth has had a major impact on the financial position of non-financial corporations. However, a second significant factor has been lower capital expenditure relative to net operating surplus over the last 17 years (see Figure 5.2).
The above developments suggest a number of things. First, Canadian non-financial corporations have benefitted from generally high commodity prices over the period under consideration – creating a growing gap between the supply of internal funds and the funds required for investment. This has led to a modification in corporate investment behaviour – a shift towards financial investment as a growing use of funds. Notable acquisitions of financial instruments have included both portfolio and inter-company investment. Some of the latter has been directed outside of the country via foreign direct investment, suggesting the increased influence of global production among Canadian multinational enterprises.
Source: Statistics Canada (2016), Table 380-0076 – Current and capital accounts – Corporations, quarterly (CAD) (database), www5.statcan.gc.ca/cansim/a26?lang=eng&id=3800076.
Source: Statistics Canada (2016), Table 380-0076 – Current and capital accounts – Corporations, quarterly (CAD) (database), www5.statcan.gc.ca/cansim/a26?lang=eng&id=3800076.
Major flows of financial investment have been directed to liquid assets and other portfolio investments since 2000. In particular, currency and bank deposits (domestic and foreign) and various other types of portfolio investments have trended upward since the late 1990s. This development has substantially improved the liquidity position of non‐financial corporations. In policy circles, these investments in liquid assets have often been referred to as “dead money” of the non-financial corporations’ sector, or funds that could be used for capital expenditure.
Not surprisingly, similar patterns for non-financial corporations have been observed in a number of countries. In the US, this development has been sometimes referred to as the “financialisation” of non-financial corporations – a rise in investment in financial assets along with a decline in accumulation of tangible non-financial assets (see, for example, Davis (2013) and Fano and Trovato [2013]).
The associated issue of “dead money” will be explored in more detail below.
The financial behaviour of non-financial corporations
Thus far it has been established that the national accounts record the role of non-financial corporations as producers of goods and services, investors and net lenders/net borrowers. If the national accounts stopped here, users of macroeconomic statistics would be left with a cliff-hanger, as important questions remain unanswered:
-
Where do firms obtain their funds if they need to borrow?
-
Where do firms invest their excess funds?
-
What tools (or instruments) do firms use to raise funds?
-
How do firms raise funds over economic cycles?
These questions are answered by examining the financial accounts and balance sheets of non-financial corporations.
2. Sources and uses of funds for non-financial corporations
A key function of the non-financial corporations’ sector financial accounts and balance sheets is to record their financial activity and financial positions. That is, financial accounts and balance sheets show how firms finance investment activities, in particular when their demand for funds exceeds their internally generated source of funds; and in which financial instruments they invest, in particular when their source of internally generated funds is greater than their demand for non-financial investments in the current period.
Put simply, suppose a firm needs USD 1 million to purchase a machine but it has had a bad year for earnings and is just scraping by. The financial accounts and balance sheets record the sources of funds, that is, the firm’s borrowing of financial funds, disaggregated by instrument, and who is lending the firm the money needed to purchase the machine. Conversely, suppose the firm had a very successful year and generated a surplus of USD 2 million – the accounts record how it is using the extra USD 1 million in cash (the difference between the USD 2 million surplus and the USD 1 million cost of the machine).
A second key function of the non-financial corporations’ financial accounts and balance sheets is to provide insight into the sector’s financial management strategy, perceptions of risk and longer term economic outlook. One way to explore both of these functions is to look at the financial accounts from two perspectives: the use of funds and the source of funds.
Investment results from the saving of the non-financial corporations’ sector. The latter is the balancing item of the current account (i.e. in 2008 SNA terminology, the combination of the production account and the generation, distribution and use of income accounts). The current account’s balance of incomes and expenditures is carried down to the capital account. When non-financial corporations primarily use saving (and other sources of funds) to invest in non-financial assets, they are signalling to the rest of the economy that they believe demand for their goods and services will be sustained, or will increase. They are also implicitly indicating that they expect the return on investment in non-financial assets to be greater than the return they could earn on financial assets. When non-financial corporations primarily use their saving to invest in financial assets (or reduce liabilities), they are in turn signalling to the rest of the economy that they want to strengthen their net financial position, usually in light of projected lower demand for products. The relationship between saving, non-financial investment and financial transactions can vary considerably, even over short periods of time and is an important indicator of economic cycles and growth.
Disregarding net receipts of capital transfers (which are relatively minor in the countries under consideration), Table 5.3 summarises the sources and uses of funds for non-financial corporations in recent years in Canada and the US. A few interesting observations can be gleaned from this table, which compares two closely related economies. First, the components of the sources of funds – both saving and the incurrence of liabilities – tend to be more volatile than those of the uses of funds. Second, the longer-term trend of non-financial corporations towards increased saving has been interrupted in recent years in both countries, most notably in Canada. Third, external sources of funds have picked up over the last three years in both countries, but the uses of funds have not always moved in tandem. This suggests that the economic behaviour of non-financial corporations does not always follow the same pattern. Below is a closer examination of the uses and sources of funds for non-financial corporations.
Uses of funds by non-financial corporations
The acquisition of non-financial assets
As noted above, one of the key uses of funds by non-financial corporations is investment in non-financial assets. In general, non-financial corporations hold a significant amount of an economic territory’s non-financial assets such as non-residential buildings and structures, machinery and equipment. Today, investment by non-financial corporations is no longer just about machines and buildings, but also about designs, formulas and software code. Intangible assets, or intellectual property products (IPPs), are becoming increasingly important. Table 5.4 shows the amount of non-financial assets held by the non-financial corporations sector for selected OECD countries compared to the national total of non-financial assets.2 In many countries the non-financial corporations sector holds a significant portion of the countries’ non-financial wealth. Other important categories of non-financial assets are dwellings owned by households, and infrastructure developed by government.
While it is important to measure aggregate investment in non-financial investments, it is equally important to provide details about the type of investments. This detail is important for a number of reasons. Firstly, it provides insight into the evolving production process in the domestic economy. It can also shed light on the composition and industrial-geographical distribution of investment changes over time. In many economies, such changes have been significant over different periods.
Secondly, this detail allows aggregate analysis of the duration of fixed assets and the corresponding term structure of the liabilities that may have been incurred to finance the investment. This is essential in terms of the analysis of financial stability. For example, there have been times when non-financial corporations have relied relatively more on either short-term or long-term debt to finance long-term non-financial investment and were seemingly unprepared for unexpected but sustained interest rate developments or abrupt changes in the cost of borrowing.
Thirdly, this detail can shed some light on the sources of funds available to the sector. For example, in some industries and over some periods, investors may be more willing to invest in non-residential structures or machinery and equipment than they would be to invest in intangible assets. In some cases investors may be interested in a stake in the firm’s equity if the funds are being used to finance research and development, whereas they prefer debt instruments if the investment is being used to finance the purchase of assets such as buildings and machines.
It is therefore important that the capital and financial accounts and balance sheets of the non-financial corporations sector provide information on the type of non-financial asset investments, and are ideally complemented by a detailed investment account that provides additional industrial, asset and geographic detail.
Financial uses of funds
A second and increasingly important use of funds for non-financial corporations is in the form of financial investments. This is primarily investment in financial assets but it can also relate to liability transactions, such as paying down debt or the buy-back of own shares.
The financial accounts and balance sheets provide a picture of the non-financial corporations’ evolving portfolio of financial investments, measuring transactions in financial assets and liabilities by type of instrument. For example, the very different investment patterns over time in the Canadian non-financial corporations’ sector are evident from analysing the financial accounts; this is summarised in Table 5.5, with a period of recession in the fourth quarter of 2008 up to the second quarter of 2009.
In 2008, the sector invested heavily in corporate equity, including inter-company investment. This reflected the surging markets that lasted up to the outset of the global financial crisis. In 2009, investment in equity and investment fund shares decelerated, while investment in currency and deposits increased. In 2013, investment in currency and deposits was again significant, and investment in equity and investment fund shares continued to decline. Clearly, non-financial corporations manage their financial asset portfolio in concert with changes in economic and financial conditions.
More generally, the financial accounts and balance sheets record the financial investment preferences of non-financial corporations, in relation to current economic events, such as earnings, financial market fluctuations and business cycles. Disregarding the settlement of liabilities, they specifically reveal non-financial corporations’ choices with respect to the type of financial assets they would like to hold. This is essential in understanding investment patterns and potential risks of non-financial corporations, shedding light on issues such as preferences for short-term versus long-term investment and firms’ projections of future demand. Non-financial corporations will invest where the financial return is the highest. For example, if they feel that investing in a machine or a building will bring a significant return to their owners, they will focus on the acquisition of non-financial assets. Conversely, if their expectations about the demand for their goods and services are weak or declining, they may decide that they can earn a higher return (at least temporarily) by directing funds towards financial assets rather than non-financial assets.
In addition to providing insight into the sector’s expectations about future growth, the financial account investment flows and balance sheet holdings also provide insight into preferences with respect to the type of financial investments and associated risk. If, in a certain period, non-financial corporations invest heavily in very liquid assets, this provides an indication of their need to access funds in the near term, either due to internal reasons or as a reaction to financial market fluctuations. On the other hand, if non-financial corporations invest primarily in bonds, this provides an indication of their willingness to “tie up” their funds for a longer period of time and their expectations about financial markets. If this investment is focussed in central government securities, corporations are seeking a safe haven for investment, and this detail thus provides information about their current assessment and preferences with respect to risk in their sector, the domestic economy, and the global economy. Needless to say, the “what” non-financial corporations invest in provides a significant amount of information about their assessment of risk, their reactions to current economic events and their predictions of future economic conditions. In recent years, non-financial corporations in many countries have increased their investment flows and holdings in liquid assets. When funds are increasingly used to invest in such financial assets, this investment is often referred to as “dead money” – reflecting a perception by some analysts that such funds could be better put to use (see Box 5.2).
In most economies, a notable feature of non-financial corporations is investment in associated corporations. This is accomplished by transferring some of the funds that a non-financial corporation has available in one part of the enterprise group to another part of the enterprise group, either through equity investments or loans and advances. These types of investments can be reflected in the financial accounts (and balance sheets) as an additional breakdown in the equity and investment funds category, as is the case in Canada, where these are called “corporate claims”. This detail is important as intercompany investment transactions can be indicative of fixed capital formation in the same industry, in upstream or downstream industries of the enterprise group, and of corporate re-structuring going on in the economy as well as in other economies through foreign direct investment. These flows can often signal times of consolidation through mergers and acquisitions, and expansion through investment in start-ups or affiliates.
In recent years there have been concerns expressed about the large stockpile of liquid assets held by non-financial corporations, sometimes referred to as “dead money”. In 2012, the Governor of the Bank of Canada took note of the significant liquidity position of Canadian corporations. He noted that while this reflected prudence on the part of the corporate sector after the financial crisis and recession, the liquidity position also represented funds that could be invested in non-financial assets in order to spur current and future economic growth. More specifically, he noted that “the level of caution could be viewed as excessive ... their job is to put money to work”.
Similar questions were raised in the US around the same time. As early as 2005, the Governor of the Federal Reserve Board noted: “Although capital investment has been advancing at a reasonably good pace, it has nonetheless lagged the exceptional rise in profits and internal cash flow”. In 2013, the Federal Reserve Bank of St Louis emphasised that “US corporations are holding record-high amounts of cash”.
Source: OECD (2017), “Financial Balance Sheets, SNA 2008 (or SNA 1993): Non-consolidated stocks, annual”, OECD National Accounts Statistics (database), https://doi.org/10.1787/data-00720-en.
The IMF has recently demonstrated that this increased corporate saving and net lending was the case in a number of G7 and OECD countries (2015). This research into the liquidity of corporations suggested “... that the emergence of the corporate saving glut may be more related to a perceived paucity of profitable (domestic) investment opportunities”.
While the inter-company financial investment flows can provide insight into trends over time, there are a number of important questions these data do not address. The first is with whom is this investment being made, and does it represent a vertical investment (supply chain) or a horizontal investment (concentration)? In order to address these questions, users often request that the non-financial corporations’ sector financial accounts and balance sheets be sub-sectored into more granular groups, and that these granular groups take the form of a traditional industry-based classification so that they are able to better understand the vertical (within industry) and horizontal (outside of the industry) investment. However, such detail is generally missing from most financial accounts and balance sheets. Furthermore, users are also increasingly interested in whether the inter-company investments are between residents and non-residents. Given the increasingly global nature of enterprises there is a substantial amount of cross-border financial investment taking place, often related to supply chain management. These international flows are specifically captured in the financial accounts with the rest of the world, but also reflected (implicitly, at least) in the financial transactions of the non-financial corporations’ sector.
Another use of funds is tied to actively reducing debt loads. In 1981-82, with nominal interest rates at historical highs and in the midst of a six-quarter recession, non-financial corporations in many countries paid off significant portions of both short-term and long-term debt. The interest charges associated with their debt levels were becoming unmanageable and, therefore, firms found it more important to reduce their liabilities than to invest in financial assets or non-financial assets. This use of funds contributed significantly to a substantial restructuring of corporations’ financial positions, setting the stage for the economic recovery that followed.
Sources of funds for non-financial corporations
As noted earlier in this chapter, non-financial corporations are responsible for a large share of total output, non-financial investments and employment in most economies. As such, they need access to funds in order to finance new initiatives as well as react to changing economic conditions. In developed economies, especially for large corporations, funds are accessed through the capital market (debt and equity), the money market and the business loans market. A key focus of the non-financial corporations’ financial accounts and balance sheets is to present the sources of funds available to non-financial corporations. An analysis of these sources of funds reveals a great deal about the overall strategy of firms, as well as how they are reacting to current financial market conditions.
The sources of funds available to non-financial corporations can be illustrated in a number of ways. They can be presented in such a way as to distinguish between internally generated or externally raised funds. In the case of external funds, the accounts reveal whether or not corporations chose to finance their funding needs through borrowing or through the issuance of shares. With respect to debt, the accounts typically articulate whether corporations are issuing short-term or long-term debt. They can also indicate whether the source of funds is domestic or foreign.
Internal sources of funds
As noted above, non-financial corporations exist to generate a return to their owners, whether immediately distributed or not. In the national accounting world this return is measured by the corporate operating surplus. Part of the income generated by a non-financial corporation is used to pay interest to lenders, and to pay corporate taxes. The remainder of the income represents the economic return to the owners. It can be distributed to the owners, or it can be retained within the corporation. The non-distributed portion ends up in the non-financial corporation sector’s saving. This saving represents an internal source of funds directly available to a corporation to either invest in non-financial or financial assets, or to reduce debt. Non-financial corporations can also sell assets, most often liquidating financial assets, as a second source of internal funds. However, since it is prudent to retain liquid assets and some financial assets are longer term investments (e.g. inter-company claims), it is common for non-financial corporations to generally raise funds externally.
External sources of funds
In many countries and in most time periods, the internally generated saving of the non-financial corporations’ sector are not sufficient to meet non-financial corporations’ investment needs; or corporations may decide to divert some of the saving into financial assets. In other words, non-financial corporations generally have a need to raise funds via equity or debt on a regular basis. As such, non-financial corporations must turn to other sectors of the economy in order to secure their required funds for a given accounting period. The ratio of the sources of internal funds (represented by corporate saving, again disregarding the impact of capital transfers), with the total demand for funds on financial markets for Germany and the United States is presented in Figure 5.4. It is clear that, in general, non-financial corporations require more funds than what is internally generated through saving. However, the difference between the two countries presented, Germany and the United States, is quite striking. While the United States’ reliance on external funding has been somewhat volatile over the period presented, Germany has been more reliant on internal funding, certainly since 2000.

Source: OECD (2017), “Detailed National Accounts, SNA 2008 (or SNA 1993): Non-financial accounts by sectors, annual”, OECD National Accounts Statistics (database), https://doi.org/10.1787/data-00034-en; and “Financial Accounts, SNA 2008 (or SNA 1993): Non-consolidated flows, annual”, OECD National Accounts Statistics (database), https://doi.org/10.1787/data-00718-en.
More generally, non-financial corporations have different means to raise external funds. Typically, they borrow from financial corporations, issue debt securities or issue new shares of equity. Their choices provide significant insight into the expectations, behaviour and structure of the corporations. For example, economies where a relatively large proportion of firms are publicly held may engage in more equity financing than in economies where privately held firms are more dominant. This is one material difference between Canada and the US, with the latter having a much higher share of listed firms.
The choice of debt or equity may also be related to the business cycle. In times where stock market prices are low and economic confidence is building – such as just prior to or the early part of an upturn in a business cycle, when share values typically start to trend up – investors may be more willing to invest in equity than in corporate bonds, and equity financing becomes more attractive to firms. This equity-business cycle relationship can be seen when economic growth is plotted against the net issuance of new equity, with stock markets tending to lead economic growth; see Figure 5.5. On the other hand, in the later stages of a business cycle when share prices are also typically peaking, there may be more of a tendency to increasingly rely on debt as a source of funds, which can lead to financial stability concerns. Generally speaking, in the context of debt issues, a corporation should have enough confidence in the economic conditions so as to not compromise their ability to meet future obligations (including the payment of interest as well as the repayment of debt). In any case, the choice between equity and debt is an important one for non-financial corporations, which is governed by the availability of funds on the financial markets, changes in the financial position, and future prospects, and the choice has varied considerably over time.

Source: Statistics Canada (2017), Table 378-0119 – Financial Flow Accounts, quarterly (CAD) (database), www5.statcan.gc.ca/cansim/a26?lang=eng&retrLang=eng&id=3780119&&pattern=&stByVal=1&p1=1&p2=31&tabMode=dataTable&csid=; Statistics Canada (2017), Table 380-0064 – Gross domestic product, expenditure-based, quarterly, www5.statcan.gc.ca/cansim/a26?lang= eng&id=3800064.
With respect to debt financing, non-financial corporations also have the choice of short-term or long-term debt. Short-term debt is defined as any debt with a maturity of less than one year at the time of issue, while long-term debt is defined as any debt with a maturity of more than one year. Furthermore, in many economies, only larger firms may have access to the bond market and, especially, the money market. Smaller firms have to rely more heavily on loans from financial corporations to raise funds. The term structure of borrowing in any given period again may reveal a great deal about corporations’ expectations regarding future growth and financial conditions such as interest rates. Enterprises tend to issue short-term debt if interest rates are highly volatile, or they expect that interest rates will fall in the near future. Enterprises would tend towards long-term debt when they feel interest rates are stable at an acceptably sustainable level, or if they sense that interest rates may increase in the future. While Canadian corporations’ borrowing on money and capital markets trailed off during the last recession, their issues of long-term debt advanced as interest rates reached historic lows after the 2007-09 economic and financial crisis. This is demonstrated in Table 5.6.
Short-term versus long-term debt may vary considerably across OECD countries and over time. In Figure 5.6 a striking feature is the strong reliance on short-term debt in some European economies. This situation contrasts with patterns in other European countries such as Finland, Sweden and the United Kingdom, where corporations almost entirely rely on long-term debt.
As with financial investments, information about non-financial corporations’ liabilities can also show from whom (at least in part) non-financial corporations receive their funding. An emphasis on from-whom-to-whom information is also a feature of the G-20 Data Gaps Initiative (see Chapter 10). Traditionally, the financial accounts and balance sheets have provided details on the type of financing received by non-financial corporations, but the focus has mainly been on the instruments – debt or equity, long-term or short-term. Increasingly, users are demanding that an additional dimension be added to the financial accounts: “from whom”, i.e. from whom are non-financial corporations receiving their funds; from domestic sectors or from foreign sectors; and if funds are from domestic sectors, are the funds coming from other non-financial corporations, banks, institutional investors or other financial corporations. This “from whom” dimension provides additional insight into the economy-wide risk associated with sectoral inter-connectedness.

Source: OECD (2017), “Financial Balance Sheets, SNA 2008 (or SNA 1993): Non-consolidated stocks, annual”, OECD National Accounts Statistics (database), https://doi.org/10.1787/data-00720-en.
Data sources for the non-financial corporations’ sector vary considerably across countries. The source data are used to estimate financial accounts and balance sheets, as well as other changes in assets accounts. Data quality and asset-liability details may vary across countries, but there are four basic data sources: publicly available corporate balance sheets, survey statistics, tax data, and counterpart information (e.g. banks’ deposit liabilities or loan assets) or indirect data (e.g. securities’ databases). These are not mutually exclusive sources and most compilers leverage as much information as they can, often using two or more data sources. Integrating these data sources is a further methodological complication as each of these data sources has its own characteristics.
An issue in the compilation of financial accounts and balance sheets concerns the level of consolidation of national accounts data on financial assets and liabilities for non-financial corporations. Depending on the source data, this consolidation can vary considerably across countries. Enterprise-based survey sources tend to present data that are generally consolidated at the enterprise level, i.e., borrowing and lending among related entities would be eliminated. Legal entity-based source data, however, tend to present assets and liabilities in which the borrowing and lending between legal entities belonging to the same enterprise (group) are not cancelled out. As a consequence, total assets and liabilities will be larger in the latter case than in the former, and may compromise international comparability. Needless to say, it is important to consult any available country metadata in order to properly interpret the financial accounts and balance sheets data for non-financial corporations.
In relation to borrowing from non-residents, there is an additional important dimension: the currency composition of foreign debt, as foreign investors are sometimes unwilling to assume the additional risk (and potential reward) of an appreciation or depreciation of the currency, with respect to the holdings of non-financial corporations’ debt. In order to guard against currency fluctuations, non-financial corporations therefore often seek or are required to issue debt in a common currency such as the Euro or the US dollar. For example, in Canada the majority of private corporation bonds held by non-residents have been issued in US dollars, to “protect” foreign investors against large depreciations of the local currency. As a result, non-financial corporations are exposed to currency risks when raising funds in foreign currency. Specifically, they will have to pay interest and reimburse the principal at whatever exchange rate prevails when these obligations come due. This may lead to increased foreign currency hedging activity on the part of borrowers. It is thus becoming increasingly important that financial accounts provide detail on the currency composition of debt.
3. Capital gains in the non-financial corporations’ sector
The previous section discussed the uses and sources of funds of non-financial corporations. Below, the focus changes to the outcome or result of all this activity – namely the stocks of assets and liabilities, or the stocks of wealth. Before one can examine the net worth or net wealth of non-financial corporations, one needs to first examine, in addition to the net purchases of assets and the net incurrence of liabilities, another set of flows to derive a clear picture of the sector’s wealth. These flows are comprised of the revaluations of assets and the so-called “other changes in the volume of assets”.
Revaluations reflect changes in the price of assets/liabilities during the accounting period, from unrealised gains or losses on those items. Other changes in volume represent changes in assets/liabilities that are not due to financial transactions or revaluations. The latter flows may relate to, for example, discoveries and depletions of subsoil assets, catastrophic losses and uncompensated seizures, as well as adjustments to the value of assets not due to price changes. These two types of other flows are contained in the 2008 SNA “other changes in assets” account.
The “other flows” (revaluations together with the other changes in the volume of assets) have been typically significantly larger than the financial transactions in many developed countries for a number of years, and this has been led by large capital gains and losses. This is the case as relevant financial instruments are measured on a market value basis on the balance sheet account of the national accounts, and the prices of financial assets (and liabilities) can change significantly, given changing market expectations about future returns and risk. By far the largest “other flow” in the accounts of non-financial corporations occurs in corporate equity assets and liabilities. This is generally followed by revaluations of non-financial assets, for example changes in the reproducible costs of fixed assets. Other flows in other financial instruments, such as other accounts payable/receivable, currency and deposits, loans and even bonds, are usually quite small relative to the financial transactions.
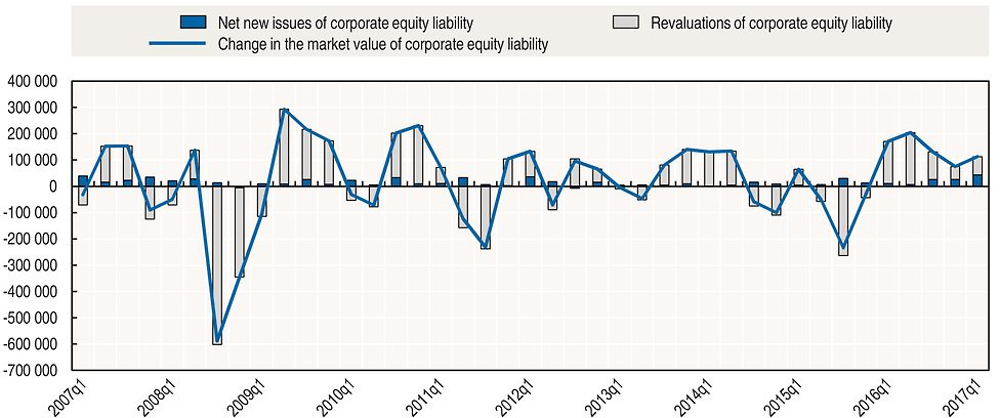
The change in the market value of corporate equity provides a good example of the impact of revaluations (see Figure 5.7). Corporate equity has fluctuated significantly over time in Canada, as can be seen from the total change in the liability equity position valued at market prices (blue line). Clearly, these changes have been governed by the other changes in assets account (grey bars), more specifically revaluations. Given the market capitalisation methodology employed to value equity, volume changes are negligible for the corporate equity liability (but can occur as the result of corporate births and deaths). The revaluations, or capital gains and losses, reflect market participants’ perceptions of the value of non-financial corporations. While gains have tended to outweigh losses over time, generating an upward trend, the impact of the financial crisis and recession is evident in 2008 and 2009.
Source: Statistics Canada (2017), Table 378-0121 – National Balance Sheet Accounts, quarterly (CAD) (database), www5.statcan.gc.ca/cansim/pick-choisir?lang=eng&p2=33&id=3780121; Statistics Canada (2017), Table 378-0119 – Financial Flow Accounts, quarterly (CAD) (database), www5.statcan.gc.ca/cansim/a26?lang=eng&retrLang=eng&id=3780119&&pattern= &stByVal=1&p1=1&p2=31&tabMode=dataTable&csid=.
4. The financial position of non-financial corporations: balance sheets
As noted before, the ultimate objective of most non-financial corporations is to generate wealth for its owners. If this is indeed the case, the financial accounts for non-financial corporations require a stock dimension – the sum result of all the activity and other changes of non-financial corporations at a point in time. This “sum of activity” is captured in the balance sheets. The balance sheets provide a “picture” at a given point in time of the stock of assets and liabilities of the non-financial corporations sector. They thus measure, at given intervals (quarters, years), the financial health of the sector, or its evolution over time in a time-series format.
The balance sheet account resembles the structure of the capital and financial account. The balance sheet includes the sector’s non-financial assets, of which the acquisitions less disposals are recorded in the capital account; the stock of financial assets and liabilities, of which the transactions are recorded in the financial account; and net worth. For non-financial corporations, the balance of assets and liabilities is largely reflected in corporate equity. As we will see later in this section, equity has a particular treatment in the balance sheets of corporations according to the System of National Accounts.
The balance sheet also sheds light on structural changes in the organisation of local and global enterprises as well as on associated wealth and financial stability, and thus on the future operating capacity of non-financial enterprises. It supplements the analysis of production and income generation that can be drawn from the national accounts supply-use tables.3
Non-financial assets
For non-financial corporations, non-financial assets typically account for a significant share of total assets. When examining the non-financial assets section of the balance sheet account of the non-financial corporations sector, it is important to consider three aspects: coverage, ownership and valuation. In this respect, it could be argued that ensuring complete coverage is the most important consideration in constructing a balance sheet. In many ways, the stock of non-financial assets – or capital base – explains how non-financial corporations go about producing goods and services and generating income for their owners. Produced assets (e.g. structures, machinery and equipment) comprise the principal non-financial assets for the non-financial corporations’ sector, followed by land and inventories. If non-financial assets are not fully articulated on the balance sheet, then there is a disconnect between the production of goods and services, the generation of income, and the assets that are used by the sector to produce these goods and services and contribute to net worth changes. This potential disconnect is best illustrated using a few examples.
Currently “branding” does not fall within the asset boundary of national accounts. This means that the development and use of a brand does not find its way onto the national accounts’ balance sheets for non-financial corporations. It is widely accepted however, that firms invest in the development of a brand and then use that brand to sell goods and services and earn a return on their investment. Excluding this asset is likely to attribute too much return to other assets that are recorded on the balance sheets. As a result, it is difficult to have a proper understanding of the assets that were used to produce the goods and services of the non-financial corporations sector.
Another asset that is often missing from the balance sheet accounts concerns natural resources. Non-financial corporations in many economies are often granted (for a price) the explicit right to extract natural resources by governments. This right to extract is an asset they acquire in order to produce goods and services. For many non-financial corporations, this is one of the most important assets that they own and exert ownership rights over (i.e. they can sell the asset). However, this asset is often not reflected in the balance sheet of national accounts, mainly because measurement issues related to the delineation and estimation of the reserves (e.g. proven reserves versus probable reserves) and the future income that can be derived from extracting these reserves. The exclusion of natural resources is a significant data gap in some countries that leads to an underestimation of the sector’s assets. As a result, the relevance of these accounts and the international comparability of wealth data may be adversely impacted.
The second important aspect that needs to be considered when examining non-financial assets in the balance sheets is the establishment of the owner to which the assets is to be attributed. The purpose of the balance sheets is to provide a current representation of the sector’s assets, liabilities, and the balance of these two categories, net worth. Ownership of assets is an important characteristic that needs to be taken into consideration when analysing the balance sheets of non-financial corporations. National accounts distinguish between legal ownership and economic ownership, with a preference for the latter – that is, national accounts allocate assets to the sector of the user (for example, in the case of financial leasing). Therefore, within the balance sheets assets are recorded in the sector that has economic ownership of the asset. In the case of financial leases, a liability (and a corresponding financial asset in the legal owner’s sector) is recorded to reflect the “borrowing” of this asset from the legal owner. This approach links the goods and services produced by non-financial corporations and the assets that are used to produce the goods and services.
A final aspect to be considered is the valuation of non-financial assets. As many non-financial assets are not regularly traded on second-hand markets, it is difficult to find appropriate market values for the assets which are in use for a certain period of time. The 2008 SNA therefore uses an alternative method, called the “perpetual inventory method” or the “current replacement cost method” for produced capital assets, which is based on the past accumulation of assets, adjusted for depreciation and price changes. Non-produced assets should be similarly valued at some approximation to market value. More details on this, and other issues concerning the measurement of non-financial assets, are discussed in Chapter 8.
Financial assets
For non-financial corporations, the largest assets tend to be deposits, accounts receivable (mostly intra-sectoral) and inter-company investment. The latter item, which may consist of equity as well as loans, is not separately recorded in standard national accounts presentations, but included under the relevant instruments (equity or loans). It is increasingly important to be able to separate inter-company investment from the individual instruments, especially given the significant growth in recent times of direct investment in subsidiary companies abroad. This is further discussed in the context of globalisation later in this chapter. Furthermore, portfolio investment has also grown in recent years in some western economies, as the growth of companies’ earnings has been increasingly directed into liquid assets such as deposits, tradeable shares and debt securities (see Box 5.1) with growing shares in foreign securities. The above factors have, in turn, led to an increase in the share of financial assets to total assets of non-financial corporations in many economies in recent years. This is evident in Table 5.8 with Canadian financial assets gaining ground over Canadian non-financial assets steadily since 2000, growing from 42% to 53% of total assets, interrupted only by the effect of the drop in the value of equity assets in the fourth quarter of 2008. As a result, it has become important to analyse the financial assets of non-financial corporations in terms of instruments held. Table 5.8 also shows the shares of deposits in total financial assets for non-financial corporations for Canada. As can be seen, the share of liquid deposit assetshas doubled from 8% to 16% of total financial assets in the 25 years since 1990, with a cyclical increase in liquidity evident in the financial crisis period.
It is also interesting to analyse the financial assets of non-financial corporations by counterparty, relating investors and borrowers. Increasingly, statistics are becoming available on the counterparty sectors in which the sectors of the economy invest, or from which they borrow, as per the G-20 Data Gaps Initiative (see Box 5.4). The power of the latter detail on “from-whom-to-whom” (FWTW) information for non-financial corporations is best demonstrated using an example. Assume that users are informed that the non-financial corporations’ sector holds USD 100 million in financial assets. That single number does not reveal anything about non-financial corporations’ risk or their assessment of current economic conditions. Now assume that users are told more specifically that non-financial corporations hold the USD 100 million in currency and deposits. This provides additional information regarding risk (in this case, minimal risk) and indicates that non-financial corporations are probably looking to invest these funds elsewhere in the short to medium term, since they are likely earning a relatively low return. Now assume that users are also told that non-financial corporations hold the currency and deposits, denominated in US Dollars, with a bank in the United States. This information regarding non-financial corporations’ financial assets – how much (the value), what type (the instrument) and with whom (the counterparty sector) provides a complete picture that assists in the assessment of the risk and investment patterns of this sector.
The importance of measuring the sector inter-connectedness within an economy has been one of the themes of the G-20 Data Gaps Initiative, post-financial crisis. In most affected economies, the rapid transmission of financial instability across inter-sectoral lines in the 2007-09 period underlined vulnerabilities that had not received much attention up to that point. The balance sheet-led financial crisis and recession contributed to an ongoing need to better articulate the assets and liabilities of lenders and borrowers, vis-à-vis different sectors of the economy. This would help users in understanding the inter-relationships and potential proliferation and magnification of risks if major players in one sector experienced economic difficulties.
In short, there is a need to better present financial accounts and balance sheet statistics in terms of interconnections between sectors. This is presented as sectoral details underneath each financial instrument. For example, if a pension funds holds bond assets, then the details on interconnectedness would indicate whether these are bonds of domestic non-financial corporations, financial institutions or governments, or whether these are bonds issued by non-residents. This is known as from-whom-to-whom (FWTW) presentation.
Currently, FWTW information in financial accounts and balance sheets is limited and typically embedded in the type of instrument. For example, the non-financial corporation sector’s balance sheets may identify financial investments in non-resident bonds or government bonds; and they may also identify investment in money-market funds or bank deposits (indicating transactions with banks). Such detail begins to provide a picture of “with whom” non-financial corporations are investing. It signals where non-financial corporations feel there is risk and where they sense there is opportunity. The non-financial corporations’ financial accounts and balance sheets can, in conjunction with the regional or international accounts, also provide insight on where (which economic territory) non-financial corporations are making their financial investments. As part of the G-20 Data Gaps Initiative (which is discussed in further detail in Chapter 10), it is expected that the FWTW-information will become increasingly available for many countries.
Liabilities
Liabilities of non-financial corporations tend to outsize financial assets by a significant margin. The largest liability of non-financial corporations normally consists of equity held by others, though its importance fluctuates over time. This fluctuation reflects changes in the market valuation of equity over time, as well as time-dependent preferences for the use of debt versus equity. Loans, marketable debt instruments (bonds and short-term paper issues outstanding) and accounts payable also tend to be relatively large proportions of total liabilities.
The use of debt securities varies considerably across OECD countries. Figure 5.8 presents the use of debt securities and loans by non-financial corporations for a number of different countries. It shows that the US has the highest proportion of debt securities, which can partially be explained by US non-financial corporations’ access to debt markets.
At the same time, the liquidity of non-financial corporations in Canada has also improved in concert with the growth in financial investments in liquid assets. A broad measure related to liquidity looks at liquid assets relative to short-term liabilities and provides a measure of non-financial corporations’ ability to meet their short-term debt commitments. Figure 5.9 demonstrates that, in Canada, this ratio fluctuates over time, but the increase in deposits and portfolio investment suggests that liquidity is not currently an issue of concern for the non-financial corporations sector.
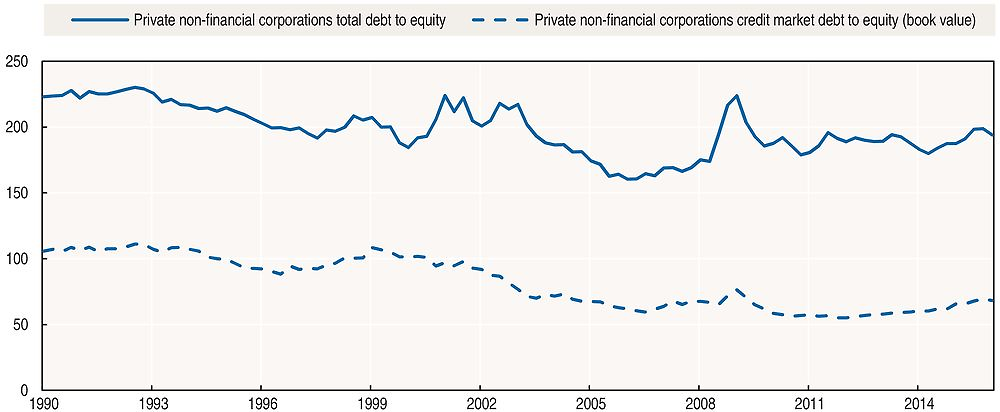
Leverage is another measure of the financial health of non-financial corporations. The debt-to-equity ratio is a measure of the non-financial corporations’ leverage. Leverage has been on a slight downward trend in Canada, the United States and other OECD countries over the last 25 years, further underlining the general health of the balance sheets of the enterprises in this sector. Notably, the leverage ratio based on national accounts data is calculated at market value. This makes the ratio sensitive to stock market swings. Therefore, it is also useful to compile a measure of leverage based on book values or historical cost. Figure 5.10 shows both ratios for Canada. Despite the larger volatility of the national accounts-based ratio, both indicators generally move in concert.

Source: OECD (2017), “Financial Balance Sheets, SNA 2008 (or SNA 1993): Non-consolidated stocks, annual”, OECD National Accounts Statistics (database), https://doi.org/10.1787/data-00720-en.
Source: Statistics Canada (2017), Table 378-0121 – National Balance Sheet Accounts, quarterly (CAD) (database), www5.statcan.gc.ca/cansim/pick-choisir?lang=eng&p2=33&id=3780121; Statistics Canada (2017), Table 378-0119 – Financial Flow Accounts, quarterly (CAD) (database), www5.statcan.gc.ca/cansim/a26?lang=eng&retrLang=eng&id=3780119&&pattern= &stByVal=1&p1=1&p2=31&tabMode=dataTable&csid=.
Source: Statistics Canada (2017), Table 378-0124 – National Balance Sheet Accounts, financial indicators, corporations, quarterly (per cent) (database),0 www5.statcan.gc.ca/cansim/a26?lang=eng&retrLang=eng&id=3780124&&pattern=&stByVal=1&p1=1 &p2=31&tabMode=dataTable&csid=.
Equity and net worth: a key difference between national and corporate accounting
Apart from the valuation and the definition of assets, one of the major differences between the SNA and business accounting relates to the treatment of equity. Differences between national accounts and business accounts are discussed in detail in Box 5.5. Here, we address the differences in defining net worth, net asset value and owners’ equity. The basic accounting identity used in business accounting is:
Total assets = Total debt liabilities + Owners’ equity
In the system of national accounts, the equity of a corporation, in the sense of shares and other equity valued at market prices, is treated as a liability, hence the accounting identity becomes:
Total assets = Total liabilities (including outstanding equity at market prices) + Net worth (i.e. any remaining residual)
Note that when total assets are equal to total liabilities in the SNA, there is no residual net worth of the non-financial corporations’ sector. Furthermore, if stock market prices are particularly high, in view of investors’ future profit expectations, then residual net worth may even become negative. This leads to the following three questions:
-
Why is equity treated as a liability in national accounts? The market value of corporate equity is treated as a liability in the balance sheets (and the financial accounts), because all corporate shares have an external owner. For example, assume that a mutual fund invests in the shares of a non‐financial corporation. This investment is a financial asset owned by the mutual fund sector. If the mutual fund holds a financial asset, then there must be a corresponding liability in another sector – in this case, in the non-financial corporations’ sector. However, one can also think of the market value of corporate equity (on the liability side of the corporation) as a measure of corporate net worth belonging to shareholders when analysing the non-financial corporations’ sector in isolation.
-
Can owners’ equity be derived as the net asset value in the system of national accounts? Yes, it can and some countries (including Canada) release such a supplementary national accounts measure – sometimes referred to as the net asset measure or current value measure of the corporation. It is calculated as total assets minus total debt liabilities (i.e. excluding the market value of corporate equity). One would expect that this value is equal or at least close to the market value of the corporate equity liability. However, this is rarely the case, because one amount is based on the value of the shares on the stock market, while the other is based on the intrinsic value of the corporation, i.e. the difference between the assets and the debt liabilities on the balance sheets. The net asset value may also be quite different from the owners’ equity according to business accounting. One reason is the divergent valuation practices. For example, in business accounting, non-financial assets are usually valued at historical cost, while the 2008 SNA applies the current replacement cost method. It may also differ due to coverage. For example, some assets are recognised in the national accounts which are not recorded as such in business accounting, such as intellectual property products. On the other hand, in the case of business accounts some provisions for future expenses may be deducted from the owners’ equity.
-
Why is there residual corporate net worth in the system of national accounts? Residual corporate net worth is that part of corporate net worth which is not assigned to another sector as an asset. It can be the result of the methodology employed in recording assets and liabilities in the balance sheets, or it can be related to measurement errors. Measurement errors can arise due to missing or misvalued assets and debt liabilities in the net asset measure of the intrinsic value of the corporation, or any mismeasurement in the calculation of the market value of the outstanding shares (listed and unlisted) in the corporate equity liability measure. In addition, residual corporate net worth may arise due to a “market expectation gap”. More specifically, the share prices of corporations reflect the investors’ perception about the future earning potential and value of the enterprise. If they are “pricing” the shares higher than the net asset value, it may be an indication of i) excess speculative activity; ii) investors’ assessment of assets that are not recorded on the balance sheets; or iii) investors’ expectations about future profits which are not reflected in the assets. The reverse can also be the case.
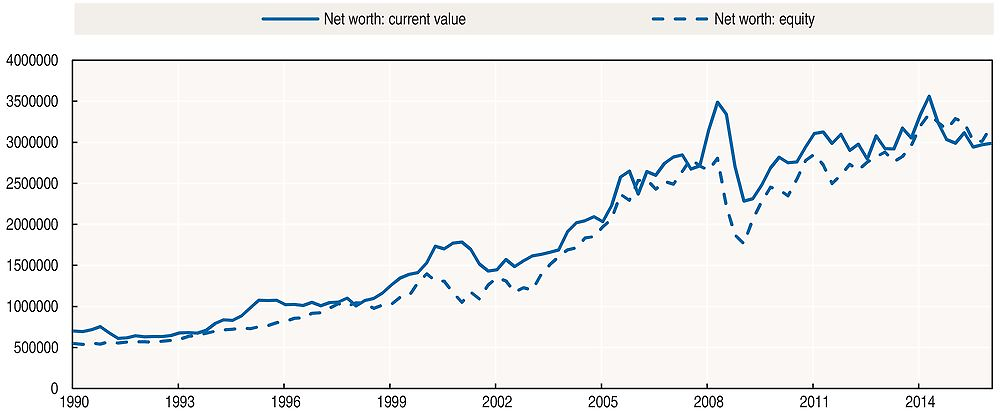
For instance, assume that the non-financial corporations sector’s assets for a given country are USD 100 000 and its debt liabilities are USD 90 000. The net asset value of the firm is therefore USD 10 000 (USD 100 000 in assets less USD 90 000 in debt liabilities). Assume that the sector has 1 000 shares outstanding and the current market value (stock market price) of these shares is USD 15 per share. The market value of the firm’s equity is USD 15 000 (1 000 shares × USD 15 per share). In national accounts, the difference between the USD 10 000 net asset value (or current value) and the USD 15 000 equity is referred to as the sector’s (residual) corporate net worth. In this case, net worth according to national accounts is equal to minus USD 5 000. Figure 5.11 shows these different measures, the net asset value (or current value) and the market value of equity, for non-financial corporations in Canada. While these measures track each other well over time, they are rarely equal, with the difference representing residual corporate net worth.
Source: Statistics Canada (2017), Table 378-0121 – National Balance Sheet Accounts, quarterly (CAD) (database), www5.statcan.gc.ca/cansim/pick-choisir?lang=eng&p2=33&id=3780121; Statistics Canada (2017), Table 378-0119 – Financial Flow Accounts, quarterly (CAD) (database), www5.statcan.gc.ca/cansim/a26?lang=eng&retrLang=eng&id=3780119&&pattern= &stByVal=1&p1=1&p2=31&tabMode=dataTable&csid=.
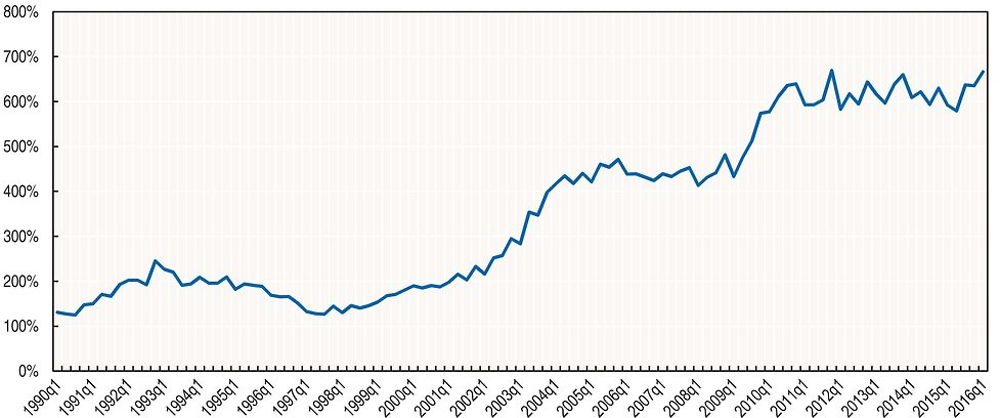
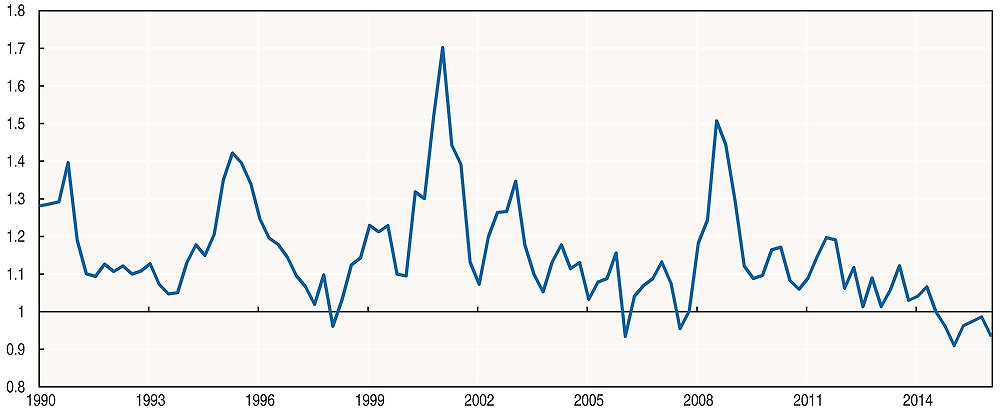
In economic theory, putting measurement issues aside, the relationship between the market value of equity to a corporation’s net asset value (at current replacement costs) is often referred to as Tobin’s q. Tobin’s q suggests that the market value of an enterprise should be equal, or close, to its intrinsic value at current values. If Tobin’s q is greater than 1 it is reflective of the fact that investors are assigning a premium to something, likely valuing some unmeasured or unrecorded asset of the company, or expecting larger future profits not reflected in the assets. As can be derived from Figure 5.12, the Tobin’s q measure for the non-financial corporations’ sector in Canada is quite volatile, with peaks in the dotcom bubble around 2000, and around the Great Recession.
Source: Statistics Canada (2017), Table 378-0121 – National Balance Sheet Accounts, quarterly (CAD) (database), www5.statcan.gc.ca/cansim/pick-choisir?lang=eng&p2=33&id=3780121; Statistics Canada (2017), Table 378-0119 – Financial Flow Accounts, quarterly (CAD) (database), www5.statcan.gc.ca/cansim/a26?lang=eng&retrLang=eng&id=3780119&&pattern= &stByVal=1&p1=1&p2=31&tabMode=dataTable&csid=.
Just like a business’s financial statements can be used to derive important financial indicators that speak to the health of the business, the information contained in the national accounts can be used to analyse the overall health of the non-financial corporations’ sector. Such ratios can be particularly useful, given the recent emphasis on the financial stability of institutional sectors. Although the level of detail given in sector accounts varies across countries, most compilers should be in a position to produce some of these ratios.
The following list comprises some (but not all) of the informative ratios that can be calculated from the financial accounts and balance sheets, some of which have been used in the main text.
-
Financial assets to non-financial assets ratio: This ratio provides a broad indication of the structural changes in asset investment, which can be used to assess whether emphasis has shifted towards or against investment in financial assets.
-
Financial asset composition ratios: The financial assets to non-financial assets ratio can be supplemented by ratios that look at the composition of assets, such as short-term to long-term assets or inter-company investment to other assets. These ratios shed additional light on structural changes (e.g. shifting away from fixed capital formation and into investment in other companies) and/or preferences for liquidity and risk.
-
Liquidity or current ratio (current assets to current liabilities ratio): This ratio is a measure of the sector’s ability to meet its short-term obligations. It may be more useful to exclude other accounts receivable/payable. Excluding inventories (the least liquid current asset) is often referred to as the acid-test ratio.
-
Short-term to long-term debt ratio: This ratio provides a broad indication of structural changes in liabilities, which can be used to assess whether emphasis has shifted towards short-term or longer-term borrowing.
-
Debt burden (debt service ratio): This is the ratio of interest (and, optionally, principal) payments to debt. These payments can also be scaled to corporate income. This ratio provides a direct measure of the costs associated with debt, as well as offering a useful supplement to leverage measures. It also provides an indication of vulnerability to interest rate fluctuations.
-
Leverage ratio (debt to equity ratio): This ratio is a measure of the private non-financial corporations’ sector’s financial leverage. A higher debt to equity ratio indicates that the sector has been increasing its relative share of debt in external financing (and vice versa). Fluctuations in the market value of equity can also cause changes in this indicator; therefore, this ratio is sometimes calculated using book values.
-
Tobin’s q (the ratio of the market value of equity to its net asset value at replacement costs): This ratio is a measure of any premium (e.g. valuing some unmeasured or unrecorded assets) or discount (expectations of lower returns) investors have assigned to non-financial corporations.
-
Performance ratio (saving or undistributed earnings to equity at book value): This ratio is a measure of the private non-financial corporations’ sector’s earning power on shareholders’ investment at book value.
-
Return ratio (saving or undistributed earnings to non-financial assets): This ratio is a measure of the private non-financial corporations’ sector’s earning power on its non-financial assets, or capital base.
-
Internal to external sources of funds ratio: This ratio provides an indication of the reliance on funds borrowed or raised externally in relation to saving or own funds. It provides a rough picture of the changing structure of the sources of funds for the non‐financial corporations’ sector.
-
Saving and/or net lending to GDP ratio: This ratio provides a broad indication of the role of the non-financial corporations’ sector in providing funds for financing investments or in providing funds to the rest of the economy.
5. Globalisation, foreign direct investment and non-financial corporations
Globalisation has become an important feature of the present-day economy. In addition to contributing to growth in foreign trade in goods and services, multinationals are increasingly becoming active in other countries’ production processes, with parts of these processes spanning the globe and being allocated to countries on the basis of comparative advantages and cost-effectiveness (including minimisation of the global tax burden).
Foreign direct investment (FDI), both inward and outward, is a useful indicator of a country’s level of economic globalisation, allowing some insights into how interrelated economic infrastructure is with the rest of the world. Data on FDI provide information on the first level of connectivity of international inter-corporate relationships, which are closely related to international trade and global production and distribution of goods and services. A more general way of monitoring the impact of globalisation is by compiling non-financial accounts, financial accounts and balance sheets for non-financial corporations broken down by foreign controlled corporations; public corporations (controlled by government); and national private corporations, sometimes part of domestic multinationals. See also Box 5.6.
Non-financial corporations account for the bulk of foreign direct investment (FDI) in Canada. The control of employment and capital by foreign non-financial corporations in the Canadian economy is notable, especially in certain industries. For the manufacturing sector alone, these firms contributed 500 000 jobs or one-third of the total employment in the industry in 2013. Wholesale and retail trade sectors contributed 600 000 jobs, accounting for 22% of the total employment in these activities. In fact, non-financial activities account for the lion’s share of employment controlled by foreign parents. In manufacturing as well as in mining, quarrying, and oil and gas extraction industries, foreign controlled firms hold significant non-financial assets in Canada.
Of the CAD 1 trillion in revenues generated by foreign-owned Canadian enterprises in 2012, 37% was in the manufacturing sector. The combined wholesale and retail trade sectors followed with a 33% share. Part of this income is related to sales abroad. Foreign controlled corporations tend to be relatively more engaged in international trade, exporting CAD 222.6 billion in 2013, while importing CAD 274.4 billion – representing half of all Canada’s goods exports and 58% of all goods imports. While foreign investment contributes significantly to the Canadian economy, there are also certain vulnerabilities with respect to potential production chain interruptions or changes in global production patterns.
On the other side of the ledger are the impacts of direct investment abroad. The focus is again on majority ownership of foreign subsidiaries. Non-financial corporations account for the largest portion of Canadian direct investment abroad, particularly outside of North America and the Caribbean where investment in goods producing industries dominates. In 2013, the activities of foreign manufacturing affiliates were mainly located in the North American and Caribbean regions as well as in Europe. Foreign affiliate sales and employment activity in South and Central America, Asia/Oceania and Africa were concentrated in manufacturing, mining, and oil and gas extraction.
Canadian statistics on activities of foreign affiliates also generate statistics on assets and liabilities, though these are not yet released with respect to outward investment. One of the forthcoming benefits of this information is a broader perspective on foreign exposures of domestic non-financial corporation parents with respect to majority-owned subsidiaries abroad.
More generally, foreign exposures of Canadian non-financial corporations cover any foreign currency denominated assets and liabilities. That includes, among other items, any portfolio investment assets (covered in the portfolio investment survey) and debt issues (covered by other securities databases) as well as direct investment abroad for minority ownership situations (covered in FDI statistics and the direct investment survey). However, for majority-ownership direct investment, domestic parents are exposed to all of the assets and liabilities of these foreign firms. For this reason, they would typically consolidate these firms in their globally consolidated financial statements, whereas in the 2008 SNA the goal is to only record the transactions and positions of the domestic enterprises, including their exposures to foreign affiliates. Therefore, statistics on the assets and liabilities under domestic parents’ control would yield more complete information on the foreign exposures of domestic non-financial corporations.
In many economies, a significant portion of FDI takes place in the non-financial corporations’ sector. As such, the equity and loans/advances portion of outward FDI are recorded as part of the relevant asset instruments in the domestic non-financial corporations’ balance sheets. Moreover, inward FDI is included in the liabilities of non-financial corporations, typically as part of loans and equity. In other words, foreign direct investment flows and stocks are covered, at least implicitly, in the financial accounts of the non-financial corporations sector. The 2008 SNA recommends showing the assets/liabilities related to FDI as additional memorandum items to the standard financial accounts and balance sheets. In order to shed light on the financial position of the sector, the SNA recommendations for the standard tables could be expanded to include additional functional categories or industry details and geographic details forging a stronger link between the sector and international accounts.
More details on FDI of non-financial corporations would lead to a better understanding of the impacts of inward and outward cross-border inter-company investments, either directly or indirectly, on the economic performance of the domestic economy. Clearly, whether a resident multinational chooses to invest in the domestic economy or in another country has a direct impact on the economic growth and employment in the domestic economy. In addition, more detailed data may lead to a better understanding of risks and vulnerabilities of non-financial corporations. Assume, for example, that a company in country A decides to make a loan to an affiliate in country B. In the typical set of accounts for non-financial corporations, this loan would be recorded as a loan asset on the balance sheets of country A. If, as suggested by the 2008 SNA, additional detail was added that recorded the direct investment asset as well as any industry or geographic detail, users would know a lot more about the risk and interconnectedness of the non-financial corporations’ balance sheets in country A. We would gain an understanding of the exposure that the non-financial corporations’ sector in country A has from its affiliates and investments in other countries.
New types of data on the impact of inward and outward FDI, focussed on the concept of control (more than 50% of voting shares owned), continue to be developed. The OECD Activity of Multinational Enterprises (AMNE) Statistics are part of this work. As can be gleaned from Table 5.9, the share of value added and the level of employment generated by non-financial corporations under foreign control differs across OECD countries, but remains significant.
Key points
-
Developed economies typically have a large and complex set of non-financial corporations engaged in a variety of industries. Non-financial corporations are a subset of the broader corporate sector, which also includes financial corporations. However, the economic and financial activities of non-financial corporations are very different from those of financial corporations. As such, it is important to monitor and understand non-financial corporations’ economic behaviour.
-
Non-financial corporations own and/or use the bulk of productive non-financial assets in the economy and, as such, contribute significantly to employment, international trade and economic growth.
-
They finance their economic activity primarily through undistributed current earnings, or saving, as well as by raising funds through debt or equity. The latter implies a need to generate sufficient future earnings to cover obligations associated with incurring debt, or providing a good return on investments in their equity.
-
Non-financial corporations have experienced long and short cycles of relatively high and low leverage. This suggests that monitoring financial stability in this sector might be seen as a priority, in terms of sustainability of economic growth.
-
In recent periods, non-financial corporations’ financial positions have improved in many economies, reflecting higher holdings of liquid financial assets. Some policy makers have lamented this trend, arguing that these “excess” funds could be put to better use in expanding the productive capital base.
-
Both of the above points suggest a need to understand the financial inter-linkages of this sector to other sectors in the economy, by augmenting the financial accounts and balance sheets with details on a from-whom-to-whom basis.
-
At the same time, non-financial corporations are heavily engaged in cross-border inter-company investment, either in the form of FDI or in the form of portfolio investment. Increasingly, non-financial corporations have investments in companies abroad and foreign companies have investments in domestic companies. In recent years, the acceleration of FDI flows reflects increased globalisation.
-
The latter, in turn, has two implications. First, shifting global production patterns can affect domestic economic growth, employment and trade. Secondly, these patterns can create vulnerabilities, implying a need to better understand the complex international inter connectedness of this sector. This suggests that additional statistical details, for example by breaking down the non-financial corporations’ sector into activities by multinational enterprises and other corporations, and improved linkages with international accounts would be useful.
-
There are many indicators that can be used to analyse the overall health of the non-financial corporations sector. These indicators are growing in use and importance, given the increased attention that is paid to the financial stability and growth perspectives of non-financial corporations. These indicators include, among other things, financial asset composition ratios, the liquidity ratio, the debt service ratio, Tobin’s q, the return ratio, and the saving to GDP ratio.
-
While the accounting for non-financial corporations in national accounts is largely similar to the business accounting used in financial reports, there are also some significant differences. The asset boundary, i.e. which non-financial assets are recognised, differs between the two accounting systems, with the 2008 SNA accounting for a somewhat larger set of non-financial assets. Furthermore, equity is presented and classified differently: in business accounting, the fundamental accounting equation is Assets = Liabilities + Owners’ Equity, which comprises shares, contributed surplus, retained earnings and reserves (adjusted for provisions). In the national accounts, equity is classified as a liability. There are also differences in valuation and presentation between business financial reports and national accounts.
Going further
National accounting and business financial accounting
There are many similarities between what is presented in national accounts and what is included in business financial reports. This is convenient, as national accounts are largely derived from business financial statements. There are also some important differences.
Presentation
In general the non-financial corporation financial accounts and balance sheets are structurally similar to what you would find in a set of business accounts. Both have an income account, or profit and loss account, but national accounting segments income more finely than business accounting. Similarly, both national accounts and business accounts have an account that relates to capital expenditure. Moreover, the SNA financial account is the equivalent to the business accounting statement of change in financial position. However, the latter also includes revaluations and other changes that are treated as separate accounts in national accounting. The balance sheet is the statement with the largest resemblance between the two bases of accounting. However, even in the balance sheet there remain important differences, especially with respect to the classification and valuation of assets and liabilities.
Valuation of assets and liabilities
At the outset, it should be recognised that, with respect to valuation, business accounting is moving closer to national accounting. The traditional trend in business accounting to rely on book value measures (acquisition cost for assets and issue price for liabilities) and the principle of market valuation in national accounting have resulted in significant differences. The relatively new international business accounting guidelines for corporations, known as the International Financial Reporting Standards (IFRS), recommend more current value accounting for financial instruments as compared to some previous accounting regimes (along with a more comprehensive measure of income). However, this is both a benefit and a challenge for compilers of financial statistics, as companies in the non-financial corporations’ sector evolve towards IFRS.
In national accounting, non-financial assets will generally be valued differently from what would be found on a typical non-financial corporation’s balance sheet. Estimates of the stocks of non-financial assets themselves along with their depreciation could be substantially different, since the national accounts reflect economic depreciation (rather than tax allowable rates), and use a valuation at current prices (instead of book value, based on historic costs). Even in cases where financial statements move from a book value basis to a more current value basis, the prices and methodology used to determine the current values of both non-financial and financial assets could be quite different from national accounting.
In terms of liabilities, while corporations are moving towards more current valuation for tradeable financial assets, this is not the case for liabilities. This is directly contradictory to national accounting, which applies a market price valuation for tradeable liabilities. The SNA recommends this, because its main purpose is to measure aggregates in industries, sectors and the economy as a whole. In this context, consistency of valuation on both sides of the balance sheet and across all sectors is a requirement related to both the accuracy and relevance of the statistics.
Adjustments to assets-liabilities: provisions
In business accounting charges (expenses) are made against current income for a variety of provisions (e.g. potential asset impairment, deferred income tax, as well as certain environmental liabilities and employee pension obligations). Provisions are amounts set aside for probable but uncertain future asset value losses or future liabilities of an enterprise. The use of provisions is consistent with the principle of accrual accounting, where financial events are recorded on a timely and ongoing basis instead of when the event may be subject to a cash settlement or otherwise final impact on the financial statements. Provisions also give rise to corresponding adjustments on the business balance sheet account: either an asset is reduced in value or a new liability is created, and there are matching appropriations from retained earnings in the equity account such that assets remain equal to liabilities plus equity. In the case of non-performing loans or trade receivables, new provisions are one of the entries (along with recoveries and write-offs) in the allowance for doubtful accounts which is netted against the asset account.
In national accounts provisions, being due to exogenous events with a likely future impact on the business, are not part of income arising from current economic production, and are thus excluded from operating surplus/mixed income (and therefore, saving). Similarly, any provisions based changes to the value of assets or liabilities are not part of transactions in the financial account; rather, to the extent that provisions are known, they should be treated as other changes in the volume of assets. These volume changes would then impact the relevant stocks on the balance sheets, including net worth. However, related to data availability issues, national accountants may or may not record adjustments for these items, as a consequence of which international comparability may be hampered. On the one hand, the allowance for doubtful accounts is typically deducted in relation to impaired loans and accounts receivable (based on the treatment in source data), with the flow (new provisions) accounted for as other changes in the volume of assets. Furthermore, changes in pension obligations on defined benefit plans, due to actuarial revaluations may give rise to changes in the relevant liabilities on the balance sheets. On the other hand, certain environmental liabilities do not necessarily have a counterpart asset in the economy (a 2008 SNA requirement), and are ignored in national accounts. Similarly, deferred income taxes are not treated as liabilities.
Equity and net worth
The different treatment of equity and net worth in business accounting and national accounts has already been discussed earlier in this chapter, at the end of Indicator 4.
Coverage and classification
The national accounts typically have a more complete coverage of assets. Research and development, and other intellectual property products, such as software and databases, mineral exploration, and entertainment, literary and artistic originals, are all recognised and recorded as assets in the system of national accounts, whereas in business accounting expenditures on these categories are often treated as current expenditures, certainly when produced in-house.
There may also be some (usually minor) differences in the way instruments are classified. Instruments such as bonds in business accounts may be classified as currency and deposits in the financial accounts. As another example, corporate financial reports show the components of intercompany investment as separate asset, as opposed to allocating these components with other equity and debt assets on the SNA balance sheet.
References
Fano, D., G. Trovato and L. Paganetto (2013), Patterns in Financial Flows? A Longer-Term Perspective on Intersectoral Relationships in Public Debt, Global Governance and Economic Dynamism, Springer Milan, Milano.
Greenspan, A. (2005), Testimony of Chairman Alan Greenspan: Federal Reserve Board’s semiannual Monetary Policy Report to the Congress before the Committee on Banking, Housing, and Urban Affairs, U.S. Senate, Washington, DC, www.federalreserve.gov/boarddocs/hh/2005/february/testimony.htm.
OECD (2017), “Detailed National Accounts, SNA 2008 (or SNA 1993): Non-financial accounts by sectors, annual”, OECD National Accounts Statistics (database), https://doi.org/10.1787/data-00034-en; and “Detailed National Accounts, SNA 2008 (or SNA 1993): Balance sheets for non-financial assets”, OECD National Accounts Statistics (database), https://doi.org/10.1787/data-00368-en; and “Financial Balance Sheets, SNA 2008 (or SNA 1993): Non-consolidated stocks, annual”, OECD National Accounts Statistics (database), https://doi.org/10.1787/data-00720-en; and OECD (2017), “Financial Accounts, SNA 2008 (or SNA 1993): Non-consolidated flows, annual”, OECD National Accounts Statistics (database), https://doi.org/10.1787/data-00718-en.
OECD (2017), Measuring Globalisation: Activities of Multinationals 2007, Volume I, Manufacturing Sector, https://doi.org/10.1787/meas_vol_1-2007-en-fr.
Sánchez, J.M. and E. Yurdagul (2013), Why Are Corporations Holding So Much Cash?, The Regional Economist, Federal Reserve Bank of Saint Louis, Saint Louis, www.stlouisfed.org/∼/media/Files/PDFs/publications/pub_assets/pdf/re/2013/a/cash.pdf.
Statistics Canada (2016), Table 380-0076 – Current and capital accounts – Corporations, quarterly (CAD) (database), www5.statcan.gc.ca/cansim/a26?lang=eng&id=3800076.
Statistics Canada (2017), Table 378-0121 – National Balance Sheet Accounts, quarterly (CAD) (database), www5.statcan.gc.ca/cansim/pick-choisir?lang=eng&p2=33&id= 3780121; and Table 378-0119 – Financial Flow Accounts, quarterly (CAD) (database), www5. statcan.gc.ca/cansim/a26?lang=eng&retrLang=eng&id=3780119&&pattern=&stByVal= 1&p1=1&p2=31&tabMode=dataTable&csid; and Table 380-0064 – Gross domestic product, expenditure-based, quarterly, www5.statcan.gc.ca/cansim/a26?lang=eng&id=3800064; and Table 378-0124 – National Balance Sheet Accounts, financial indicators, corporations, quarterly (percent) (database), www5.statcan.gc.ca/cansim/a26?lang=eng&retrLang= eng&id=3780124&&pattern=&stByVal=1&p1=1&p2=31&tabMode=dataTable&csid.
U.S. Federal Reserve (2017), Financial Accounts of the United States (database), www.federalreserve.gov/apps/fof/FOFTables.aspx.
Notes
← 1. The statistical data for Israel are supplied by and under the responsibility of the relevant Israeli authorities. The use of such data by the OECD is without prejudice to the status of the Golan Heights, East Jerusalem and Israeli settlements in the West Bank under the terms of international law.
← 2. It should be noted that here non-financial assets only refer to produced non-financial assets, and do not include so-called “non-produced non-financial assets”, such as land and natural resources. Land, in particular, is one of the most important categories of non-financial assets, but few countries have estimates for the total value of land. For more information, refer to Chapter 8.
← 3. Supply-use tables describe, in detail, the supply of products by domestic industries and by imports, and the use (or demand) of these products for intermediate consumption, final consumption, non-financial investments and exports. The tables also show the production process by domestic industry: which products are produced, and which inputs are used in this process.